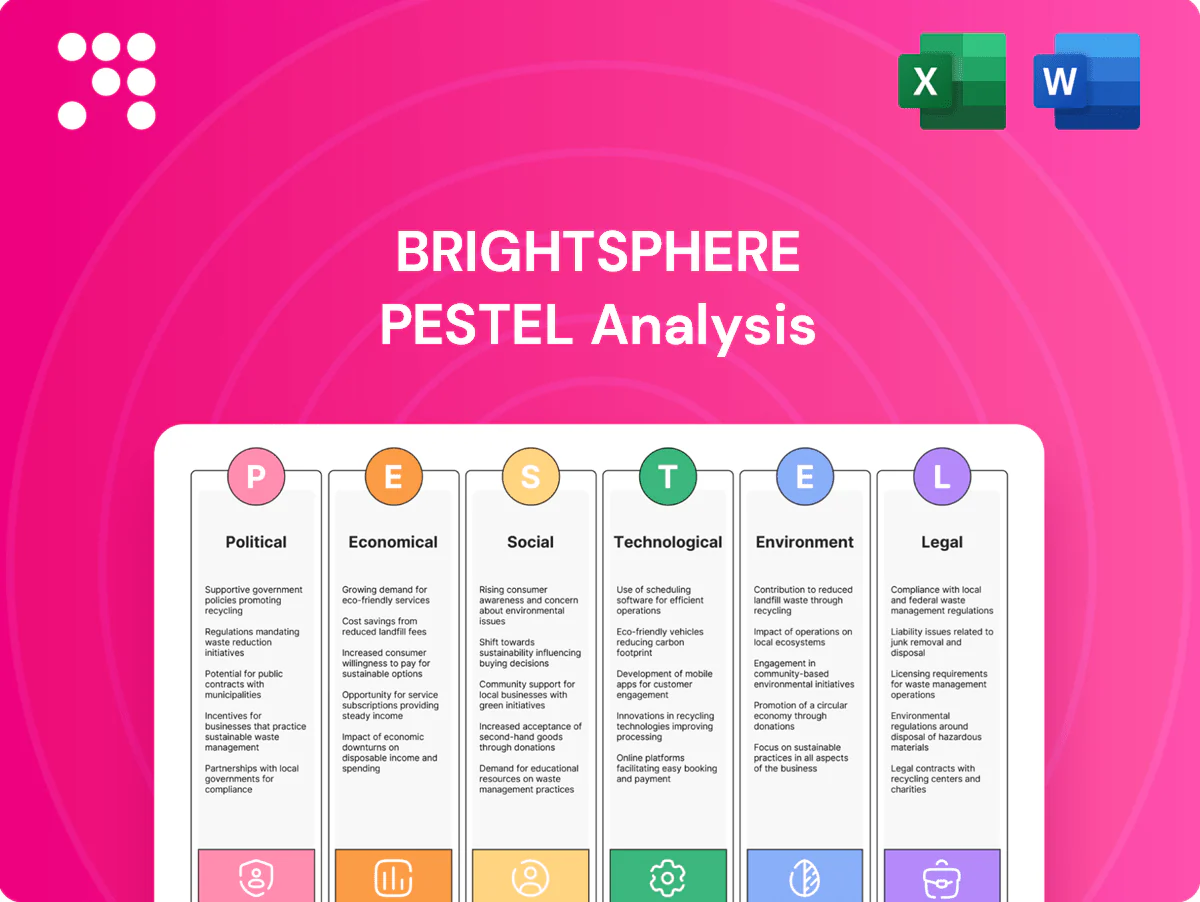
BrightSphere PESTLE Analysis

Plan Smarter. Present Sharper. Compete Stronger.
Gain a competitive edge with our targeted PESTLE analysis of BrightSphere, revealing political, economic, social, technological, legal and environmental forces shaping its future. Use these insights to spot risks and growth opportunities—buy the full report for the complete, actionable breakdown. Perfect for investors and strategists.
Political factors

Regulatory policy direction
Shifts in supervisory priorities at agencies materially influence product approvals, disclosure expectations and exam intensity, affecting firms in an industry of roughly 13,000 SEC-registered investment advisers (2024). A pro-market administration can reduce compliance burdens, while a protectionist tilt tightens rules and increases exam frequency. Multi-boutique structures require centralized policy scanning and rapid recalibration across affiliates to minimize operational disruption.
Geopolitical volatility
Conflicts, sanctions and trade disputes have disrupted global capital flows and cross-border mandates, with global FDI down 12% to about $1.02 trillion in 2023 (UNCTAD). Heightened risk premia drive client reallocations across equities, fixed income and alternatives. Boutiques must adjust exposures and hedges rapidly. Clear, proactive client communication helps mitigate redemption spikes.

Public pension funding politics
Budget debates over contribution levels and benefit reforms shape asset allocations for roughly $6.6 trillion in US public pension assets, with aggregate funded ratios near 72% (2023–24). Plans are shifting toward liability-driven investing and de-risking, shortening mandate duration and moving fee mix toward OCIO and liability-hedging mandates. Maintaining close plan sponsor relationships and offering niche LDI, inflation-hedging and private credit solutions helps retain share in constrained budgets.

Tax policy changes
Corporate tax at 21% and a top capital gains rate of 23.8% (20% plus 3.8% NIIT) materially change after-tax returns; congressional proposals to tax carried interest at ordinary rates (up to 37%) would shift investor preferences and fee economics. Fund domicile and product wrappers may need redesign to preserve net returns, while central tax expertise can help boutiques reprice and restructure offerings. Timely client education preserves flows and limits redemptions.
- Corporate rate 21%
- Top capital gains 23.8%
- Carried interest proposals up to 37%
- Revise domiciles/wrappers
- Central tax support; client education
ESG policy mandates
Government-driven ESG disclosure (EU SFDR, CSRD) and stewardship expectations shape product design and labeling; CSRD now covers ~50,000 companies and SFDR drives fund categorization. Public pensions and sovereign funds increasingly demand alignment with sustainability frameworks, supporting distribution as global sustainable assets reached $41.1 trillion in 2022. Consistent boutique-wide implementation avoids fragmentation and measurable policy adherence underpins distribution access.
- ESG disclosure: SFDR/CSRD
- Coverage: ~50,000 companies (CSRD)
- Market scale: $41.1T sustainable assets (2022)
- Priority: consistency across boutiques
- Outcome: measurable adherence = distribution access
Regulatory exams, tax shifts and geopolitics force advisers to reprice post $1.02T FDI fall
Regulatory priorities and exam intensity shape product approvals for ~13,000 SEC-registered advisers (2024), requiring centralized compliance across boutiques. Geopolitical frictions cut global FDI ~12% to $1.02T (2023), forcing rapid reallocations and client communication. US public pensions ~$6.6T with ~72% funded ratios drive LDI demand; tax rules (21% corp, 23.8% max cap gains; carried interest proposals to 37%) reshape product wrappers.
| Metric | Value |
|---|---|
| SEC-registered advisers (2024) | ~13,000 |
| Global FDI (2023) | $1.02T (-12%) |
| US public pensions | $6.6T (72% funded) |
| Sustainable assets (2022) | $41.1T |
What is included in the product
 Detailed Word Document
Explores how macro-environmental factors uniquely affect BrightSphere across Political, Economic, Social, Technological, Environmental and Legal dimensions, with each section backed by current data and trends. Designed for executives and investors, it delivers forward-looking insights and clean, report-ready formatting to inform strategy and funding decisions.

 Customizable Excel Spreadsheet
Provides a clean, visually segmented PESTLE summary that’s easily editable for local context, making it simple to drop into presentations or share across teams for faster alignment and clearer external risk discussions.
Economic factors

Interest rate cycles
Rate paths drive fixed-income returns, equity valuations and alternatives demand: US 10-year yields near 4.2% and fed funds around 5.25-5.50% (mid-2025) have pressured long-duration assets and boosted short-duration performance. Rising rates shift flows to short-duration and floating-rate strategies; declining rates would revive growth equities and long-duration bonds. Boutiques require dynamic rate-risk management and active duration hedging.
Market volatility and liquidity
Market volatility erodes alpha generation and forces wider tracking‑error tolerances as managers face more frequent drawdowns; industry stress episodes in 2024 amplified rebalancing needs. Liquidity squeezes particularly threaten alternative and small‑cap strategies given alternatives AUM reached about 17.2 trillion USD in 2023 (Preqin), increasing redemption pressure. Centralized risk monitoring enables dynamic reallocation of risk budgets, while transparent, regular client updates sustain confidence.

Business cycle and GDP trends
Economic expansion lifts risk assets and performance fees—S&P 500 climbed about 26.3% in 2023, boosting asset-manager incentive revenues. Conversely, slowdowns compress margins and shift flows to defensive mandates, as GDP growth slowed to roughly 3.0% globally in 2023 (IMF). Diversified boutiques smooth revenue cyclicality by mixing equity, fixed income and alternatives. Scenario planning aligns staffing and capacity with demand peaks and troughs.

Fee compression
Passive competition and procurement pressure—with global ETF AUM ~11.3 trillion in 2024—continue to push fees downward, though differentiated, capacity-constrained alpha strategies retain pricing power and can sustain higher margins; shared-services can cut cost-to-serve by up to 20%, while outcome-oriented products routinely command premium fees (50–200 bps).
- Passive growth: ETF AUM ~11.3T (2024)
- Shared services: cost reduction up to 20%
- Alpha strategies: pricing power
- Outcome products: premiums 50–200 bps
FX movements
Currency swings materially affect global-mandate returns and BrightSphere’s reported earnings; with global FX turnover at $7.5 trillion/day (BIS 2022) even small moves can shift monthly returns and P&L. Hedging policies must align with client benchmarks and risk appetite, multi-currency operations require robust treasury processes, and clear FX reporting prevents performance attribution disputes.
- FX turnover: $7.5 trillion/day (BIS 2022)
- Hedging aligned to client benchmark/risk
- Robust treasury for multi-currency ops
- Transparent reporting avoids attribution disputes
Regulatory exams, tax shifts and geopolitics force advisers to reprice post $1.02T FDI fall
Higher rates (US 10y ~4.2%, fed funds 5.25–5.50% mid‑2025) compress long-duration returns, boost short-duration, and force active duration hedging; ETF AUM ~11.3T (2024) and alternatives AUM ~17.2T (2023) intensify fee pressure and redemption risk. FX turnover $7.5T/day (BIS 2022) makes currency hedging essential. Shared services can cut cost-to-serve ~20%.
| Metric | Value |
|---|---|
| US 10y | ~4.2% |
| Fed funds | 5.25–5.50% |
| ETF AUM (2024) | 11.3T |
| Alternatives AUM (2023) | 17.2T |
| FX turnover | $7.5T/day |
Full Version Awaits
BrightSphere PESTLE Analysis
The BrightSphere PESTLE Analysis preview shown here is the exact document you’ll receive after purchase—fully formatted and ready to use. This is a real screenshot of the product you’re buying and will be delivered exactly as shown, with no placeholders or surprises. The layout, content, and structure visible here are exactly what you’ll download immediately after payment.

Plan Smarter. Present Sharper. Compete Stronger.
Gain a competitive edge with our targeted PESTLE analysis of BrightSphere, revealing political, economic, social, technological, legal and environmental forces shaping its future. Use these insights to spot risks and growth opportunities—buy the full report for the complete, actionable breakdown. Perfect for investors and strategists.
Political factors
Regulatory policy direction
Shifts in supervisory priorities at agencies materially influence product approvals, disclosure expectations and exam intensity, affecting firms in an industry of roughly 13,000 SEC-registered investment advisers (2024). A pro-market administration can reduce compliance burdens, while a protectionist tilt tightens rules and increases exam frequency. Multi-boutique structures require centralized policy scanning and rapid recalibration across affiliates to minimize operational disruption.
Geopolitical volatility
Conflicts, sanctions and trade disputes have disrupted global capital flows and cross-border mandates, with global FDI down 12% to about $1.02 trillion in 2023 (UNCTAD). Heightened risk premia drive client reallocations across equities, fixed income and alternatives. Boutiques must adjust exposures and hedges rapidly. Clear, proactive client communication helps mitigate redemption spikes.
Public pension funding politics
Budget debates over contribution levels and benefit reforms shape asset allocations for roughly $6.6 trillion in US public pension assets, with aggregate funded ratios near 72% (2023–24). Plans are shifting toward liability-driven investing and de-risking, shortening mandate duration and moving fee mix toward OCIO and liability-hedging mandates. Maintaining close plan sponsor relationships and offering niche LDI, inflation-hedging and private credit solutions helps retain share in constrained budgets.
Tax policy changes
Corporate tax at 21% and a top capital gains rate of 23.8% (20% plus 3.8% NIIT) materially change after-tax returns; congressional proposals to tax carried interest at ordinary rates (up to 37%) would shift investor preferences and fee economics. Fund domicile and product wrappers may need redesign to preserve net returns, while central tax expertise can help boutiques reprice and restructure offerings. Timely client education preserves flows and limits redemptions.
- Corporate rate 21%
- Top capital gains 23.8%
- Carried interest proposals up to 37%
- Revise domiciles/wrappers
- Central tax support; client education
ESG policy mandates
Government-driven ESG disclosure (EU SFDR, CSRD) and stewardship expectations shape product design and labeling; CSRD now covers ~50,000 companies and SFDR drives fund categorization. Public pensions and sovereign funds increasingly demand alignment with sustainability frameworks, supporting distribution as global sustainable assets reached $41.1 trillion in 2022. Consistent boutique-wide implementation avoids fragmentation and measurable policy adherence underpins distribution access.
- ESG disclosure: SFDR/CSRD
- Coverage: ~50,000 companies (CSRD)
- Market scale: $41.1T sustainable assets (2022)
- Priority: consistency across boutiques
- Outcome: measurable adherence = distribution access
Regulatory exams, tax shifts and geopolitics force advisers to reprice post $1.02T FDI fall
Regulatory priorities and exam intensity shape product approvals for ~13,000 SEC-registered advisers (2024), requiring centralized compliance across boutiques. Geopolitical frictions cut global FDI ~12% to $1.02T (2023), forcing rapid reallocations and client communication. US public pensions ~$6.6T with ~72% funded ratios drive LDI demand; tax rules (21% corp, 23.8% max cap gains; carried interest proposals to 37%) reshape product wrappers.
| Metric | Value |
|---|---|
| SEC-registered advisers (2024) | ~13,000 |
| Global FDI (2023) | $1.02T (-12%) |
| US public pensions | $6.6T (72% funded) |
| Sustainable assets (2022) | $41.1T |
What is included in the product
Detailed Word Document
Explores how macro-environmental factors uniquely affect BrightSphere across Political, Economic, Social, Technological, Environmental and Legal dimensions, with each section backed by current data and trends. Designed for executives and investors, it delivers forward-looking insights and clean, report-ready formatting to inform strategy and funding decisions.
Customizable Excel Spreadsheet
Provides a clean, visually segmented PESTLE summary that’s easily editable for local context, making it simple to drop into presentations or share across teams for faster alignment and clearer external risk discussions.
Economic factors
Interest rate cycles
Rate paths drive fixed-income returns, equity valuations and alternatives demand: US 10-year yields near 4.2% and fed funds around 5.25-5.50% (mid-2025) have pressured long-duration assets and boosted short-duration performance. Rising rates shift flows to short-duration and floating-rate strategies; declining rates would revive growth equities and long-duration bonds. Boutiques require dynamic rate-risk management and active duration hedging.
Market volatility and liquidity
Market volatility erodes alpha generation and forces wider tracking‑error tolerances as managers face more frequent drawdowns; industry stress episodes in 2024 amplified rebalancing needs. Liquidity squeezes particularly threaten alternative and small‑cap strategies given alternatives AUM reached about 17.2 trillion USD in 2023 (Preqin), increasing redemption pressure. Centralized risk monitoring enables dynamic reallocation of risk budgets, while transparent, regular client updates sustain confidence.
Business cycle and GDP trends
Economic expansion lifts risk assets and performance fees—S&P 500 climbed about 26.3% in 2023, boosting asset-manager incentive revenues. Conversely, slowdowns compress margins and shift flows to defensive mandates, as GDP growth slowed to roughly 3.0% globally in 2023 (IMF). Diversified boutiques smooth revenue cyclicality by mixing equity, fixed income and alternatives. Scenario planning aligns staffing and capacity with demand peaks and troughs.
Fee compression
Passive competition and procurement pressure—with global ETF AUM ~11.3 trillion in 2024—continue to push fees downward, though differentiated, capacity-constrained alpha strategies retain pricing power and can sustain higher margins; shared-services can cut cost-to-serve by up to 20%, while outcome-oriented products routinely command premium fees (50–200 bps).
- Passive growth: ETF AUM ~11.3T (2024)
- Shared services: cost reduction up to 20%
- Alpha strategies: pricing power
- Outcome products: premiums 50–200 bps
FX movements
Currency swings materially affect global-mandate returns and BrightSphere’s reported earnings; with global FX turnover at $7.5 trillion/day (BIS 2022) even small moves can shift monthly returns and P&L. Hedging policies must align with client benchmarks and risk appetite, multi-currency operations require robust treasury processes, and clear FX reporting prevents performance attribution disputes.
- FX turnover: $7.5 trillion/day (BIS 2022)
- Hedging aligned to client benchmark/risk
- Robust treasury for multi-currency ops
- Transparent reporting avoids attribution disputes
Regulatory exams, tax shifts and geopolitics force advisers to reprice post $1.02T FDI fall
Higher rates (US 10y ~4.2%, fed funds 5.25–5.50% mid‑2025) compress long-duration returns, boost short-duration, and force active duration hedging; ETF AUM ~11.3T (2024) and alternatives AUM ~17.2T (2023) intensify fee pressure and redemption risk. FX turnover $7.5T/day (BIS 2022) makes currency hedging essential. Shared services can cut cost-to-serve ~20%.
| Metric | Value |
|---|---|
| US 10y | ~4.2% |
| Fed funds | 5.25–5.50% |
| ETF AUM (2024) | 11.3T |
| Alternatives AUM (2023) | 17.2T |
| FX turnover | $7.5T/day |
Full Version Awaits
BrightSphere PESTLE Analysis
The BrightSphere PESTLE Analysis preview shown here is the exact document you’ll receive after purchase—fully formatted and ready to use. This is a real screenshot of the product you’re buying and will be delivered exactly as shown, with no placeholders or surprises. The layout, content, and structure visible here are exactly what you’ll download immediately after payment.
Original: $10.00
-65%$10.00
$3.50Description
Plan Smarter. Present Sharper. Compete Stronger.
Gain a competitive edge with our targeted PESTLE analysis of BrightSphere, revealing political, economic, social, technological, legal and environmental forces shaping its future. Use these insights to spot risks and growth opportunities—buy the full report for the complete, actionable breakdown. Perfect for investors and strategists.
Political factors
Regulatory policy direction
Shifts in supervisory priorities at agencies materially influence product approvals, disclosure expectations and exam intensity, affecting firms in an industry of roughly 13,000 SEC-registered investment advisers (2024). A pro-market administration can reduce compliance burdens, while a protectionist tilt tightens rules and increases exam frequency. Multi-boutique structures require centralized policy scanning and rapid recalibration across affiliates to minimize operational disruption.
Geopolitical volatility
Conflicts, sanctions and trade disputes have disrupted global capital flows and cross-border mandates, with global FDI down 12% to about $1.02 trillion in 2023 (UNCTAD). Heightened risk premia drive client reallocations across equities, fixed income and alternatives. Boutiques must adjust exposures and hedges rapidly. Clear, proactive client communication helps mitigate redemption spikes.
Public pension funding politics
Budget debates over contribution levels and benefit reforms shape asset allocations for roughly $6.6 trillion in US public pension assets, with aggregate funded ratios near 72% (2023–24). Plans are shifting toward liability-driven investing and de-risking, shortening mandate duration and moving fee mix toward OCIO and liability-hedging mandates. Maintaining close plan sponsor relationships and offering niche LDI, inflation-hedging and private credit solutions helps retain share in constrained budgets.
Tax policy changes
Corporate tax at 21% and a top capital gains rate of 23.8% (20% plus 3.8% NIIT) materially change after-tax returns; congressional proposals to tax carried interest at ordinary rates (up to 37%) would shift investor preferences and fee economics. Fund domicile and product wrappers may need redesign to preserve net returns, while central tax expertise can help boutiques reprice and restructure offerings. Timely client education preserves flows and limits redemptions.
- Corporate rate 21%
- Top capital gains 23.8%
- Carried interest proposals up to 37%
- Revise domiciles/wrappers
- Central tax support; client education
ESG policy mandates
Government-driven ESG disclosure (EU SFDR, CSRD) and stewardship expectations shape product design and labeling; CSRD now covers ~50,000 companies and SFDR drives fund categorization. Public pensions and sovereign funds increasingly demand alignment with sustainability frameworks, supporting distribution as global sustainable assets reached $41.1 trillion in 2022. Consistent boutique-wide implementation avoids fragmentation and measurable policy adherence underpins distribution access.
- ESG disclosure: SFDR/CSRD
- Coverage: ~50,000 companies (CSRD)
- Market scale: $41.1T sustainable assets (2022)
- Priority: consistency across boutiques
- Outcome: measurable adherence = distribution access
Regulatory exams, tax shifts and geopolitics force advisers to reprice post $1.02T FDI fall
Regulatory priorities and exam intensity shape product approvals for ~13,000 SEC-registered advisers (2024), requiring centralized compliance across boutiques. Geopolitical frictions cut global FDI ~12% to $1.02T (2023), forcing rapid reallocations and client communication. US public pensions ~$6.6T with ~72% funded ratios drive LDI demand; tax rules (21% corp, 23.8% max cap gains; carried interest proposals to 37%) reshape product wrappers.
| Metric | Value |
|---|---|
| SEC-registered advisers (2024) | ~13,000 |
| Global FDI (2023) | $1.02T (-12%) |
| US public pensions | $6.6T (72% funded) |
| Sustainable assets (2022) | $41.1T |
What is included in the product
Detailed Word Document
Explores how macro-environmental factors uniquely affect BrightSphere across Political, Economic, Social, Technological, Environmental and Legal dimensions, with each section backed by current data and trends. Designed for executives and investors, it delivers forward-looking insights and clean, report-ready formatting to inform strategy and funding decisions.
Customizable Excel Spreadsheet
Provides a clean, visually segmented PESTLE summary that’s easily editable for local context, making it simple to drop into presentations or share across teams for faster alignment and clearer external risk discussions.
Economic factors
Interest rate cycles
Rate paths drive fixed-income returns, equity valuations and alternatives demand: US 10-year yields near 4.2% and fed funds around 5.25-5.50% (mid-2025) have pressured long-duration assets and boosted short-duration performance. Rising rates shift flows to short-duration and floating-rate strategies; declining rates would revive growth equities and long-duration bonds. Boutiques require dynamic rate-risk management and active duration hedging.
Market volatility and liquidity
Market volatility erodes alpha generation and forces wider tracking‑error tolerances as managers face more frequent drawdowns; industry stress episodes in 2024 amplified rebalancing needs. Liquidity squeezes particularly threaten alternative and small‑cap strategies given alternatives AUM reached about 17.2 trillion USD in 2023 (Preqin), increasing redemption pressure. Centralized risk monitoring enables dynamic reallocation of risk budgets, while transparent, regular client updates sustain confidence.
Business cycle and GDP trends
Economic expansion lifts risk assets and performance fees—S&P 500 climbed about 26.3% in 2023, boosting asset-manager incentive revenues. Conversely, slowdowns compress margins and shift flows to defensive mandates, as GDP growth slowed to roughly 3.0% globally in 2023 (IMF). Diversified boutiques smooth revenue cyclicality by mixing equity, fixed income and alternatives. Scenario planning aligns staffing and capacity with demand peaks and troughs.
Fee compression
Passive competition and procurement pressure—with global ETF AUM ~11.3 trillion in 2024—continue to push fees downward, though differentiated, capacity-constrained alpha strategies retain pricing power and can sustain higher margins; shared-services can cut cost-to-serve by up to 20%, while outcome-oriented products routinely command premium fees (50–200 bps).
- Passive growth: ETF AUM ~11.3T (2024)
- Shared services: cost reduction up to 20%
- Alpha strategies: pricing power
- Outcome products: premiums 50–200 bps
FX movements
Currency swings materially affect global-mandate returns and BrightSphere’s reported earnings; with global FX turnover at $7.5 trillion/day (BIS 2022) even small moves can shift monthly returns and P&L. Hedging policies must align with client benchmarks and risk appetite, multi-currency operations require robust treasury processes, and clear FX reporting prevents performance attribution disputes.
- FX turnover: $7.5 trillion/day (BIS 2022)
- Hedging aligned to client benchmark/risk
- Robust treasury for multi-currency ops
- Transparent reporting avoids attribution disputes
Regulatory exams, tax shifts and geopolitics force advisers to reprice post $1.02T FDI fall
Higher rates (US 10y ~4.2%, fed funds 5.25–5.50% mid‑2025) compress long-duration returns, boost short-duration, and force active duration hedging; ETF AUM ~11.3T (2024) and alternatives AUM ~17.2T (2023) intensify fee pressure and redemption risk. FX turnover $7.5T/day (BIS 2022) makes currency hedging essential. Shared services can cut cost-to-serve ~20%.
| Metric | Value |
|---|---|
| US 10y | ~4.2% |
| Fed funds | 5.25–5.50% |
| ETF AUM (2024) | 11.3T |
| Alternatives AUM (2023) | 17.2T |
| FX turnover | $7.5T/day |
Full Version Awaits
BrightSphere PESTLE Analysis
The BrightSphere PESTLE Analysis preview shown here is the exact document you’ll receive after purchase—fully formatted and ready to use. This is a real screenshot of the product you’re buying and will be delivered exactly as shown, with no placeholders or surprises. The layout, content, and structure visible here are exactly what you’ll download immediately after payment.











