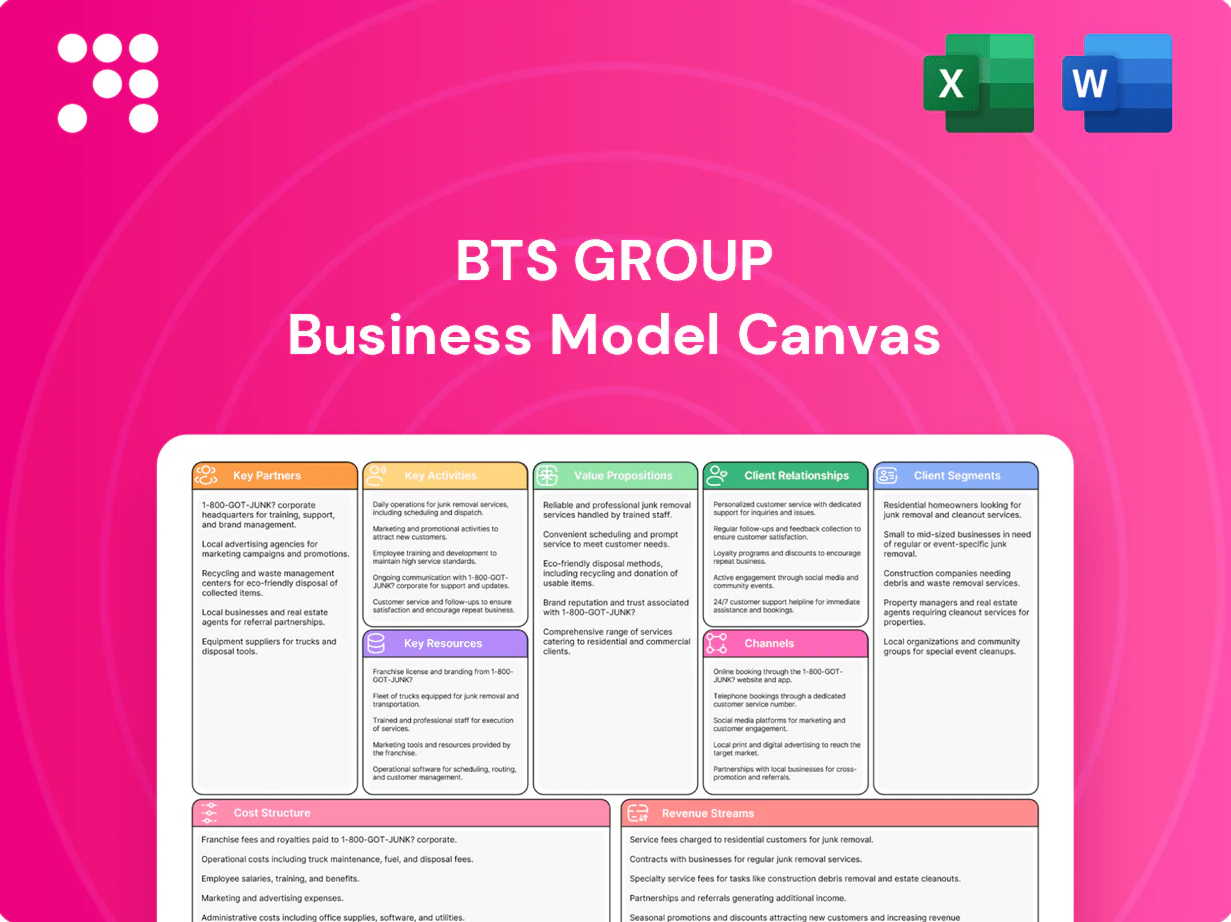
BTS Group Business Model Canvas

Business Model Canvas: Key Value Propositions, Customers and Scalable Revenue Drivers
Explore BTS Group’s strategic blueprint with this concise Business Model Canvas overview that highlights value propositions, customer segments, and revenue engines. Dive into how partnerships and capabilities drive scalable growth and competitive edge. Purchase the full, editable Canvas for a complete, section-by-section playbook to apply directly in strategy, benchmarking, or investor analysis.
Partnerships

Enterprise clients
Strategic partnerships with global enterprise clients co-create solutions tightly aligned to each client strategy, leveraging BTS presence in 35+ countries and service delivery across 60+ markets (2024). Multi-year engagements provide scale, context and enable rigorous impact measurement tied to business KPIs. Client SMEs supply real data to enrich simulations and ensure relevance. Joint governance structures accelerate adoption and measurable outcomes.
Technology platforms
Alliances with LMS, LXP, analytics and collaboration vendors enable seamless delivery across channels, tapping a global corporate learning market that surpassed $300 billion in 2024. Robust APIs and integrations support real-time data flow and personalization at scale. VR/AR and simulation engines drive experiential learning, while security-certified partners (ISO/IEC 27001, SOC 2) ensure enterprise readiness and compliance.

Academic and thought leaders
Collaboration with universities and researchers strengthens BTS evidence-based methodologies by integrating peer-reviewed insights and field trials. External experts validate leadership models and strategy frameworks, improving adoption and measurement. Co-authored content boosts credibility and reach across academic and corporate channels. In 2024 BTS engaged dozens of research partners and employed roughly 1,200 consultants to scale innovation and benchmarking.

Facilitator and contractor network
Global certified facilitators expand BTS delivery capacity and localization, aligning with a 2024 global consulting market ≈330 billion USD; specialty contractors add design, data and industry expertise; flexible staffing reduces fixed payroll, improving responsiveness and margin control; standardized quality systems ensure consistent outcomes at scale.
- Global market 2024 ≈330B USD
- Certified facilitators for local delivery
- Specialty contractors: design, data, industry
- Flexible staffing = lower fixed costs
- Quality systems maintain consistency
Consulting and channel alliances
Partnerships with consultancies and boutiques extend BTS Group market access, with partner-led deals comprising about 35% of bookings in 2024; joint pursuits integrate strategy design with execution, shortening delivery cycles. Resellers and regional partners open new geographies, while revenue-sharing models align incentives and accelerate growth.
- partner-led ≈35% bookings (2024)
- joint pursuits = faster execution
- revenue-sharing → aligned incentives
Partner-led deals: ≈35% bookings, 35+ countries
Strategic alliances with global clients (35+ countries, 60+ markets) and tech vendors drive co-created solutions tied to KPIs; partner-led deals were ≈35% of bookings in 2024. Academic and research partners (dozens engaged, ~1,200 consultants) validate methods. Certified facilitators and contractors scale delivery, improving margins amid a $300B+ corporate learning market (2024).
| Partnership | Role | 2024 metric |
|---|---|---|
| Global clients | Co-create, long-term | 35+ countries, 60+ markets |
| Tech vendors | Delivery & integrations | API/LMS/LXP, security certs |
| Research & academia | Validate methods | Dozens partners, 1,200 consultants |
| Facilitators/contractors | Local delivery | Scalable, quality systems |
What is included in the product
 Detailed Word Document
A comprehensive Business Model Canvas for BTS Group detailing customer segments, value propositions, channels, revenue streams and key resources across the 9 BMC blocks, with competitive advantage analysis, linked SWOT insights and polished narratives—ideal for investor presentations, strategic planning and validation using real-world company data.

 Customizable Excel Spreadsheet
High-level view of BTS Group's business model with editable cells, relieving the pain of scattered strategy documents by consolidating revenue streams, client segments, and value propositions into one editable page for faster decision-making.
Activities

Diagnostic and discovery
Diagnostic and discovery assesses strategic priorities, capability gaps, and behavioral barriers, noting that roughly 70% of transformations fail when these are unaddressed per McKinsey. Stakeholder interviews and rigorous data reviews shape the intervention design and target levers. Baselines are established for impact measurement and insights drive messaging and change levers.
Experience design
Builds customized simulations, playbooks and learning journeys tailored to client KPIs and cost structures, aligning scenarios to the operating model and strategic metrics. Programs blend digital, live and on-the-job elements following the 70/20/10 learning model to maximize transfer. Iterates rapidly via client feedback loops and 4-week sprint cycles to improve stickiness and measurable behavior change.

Delivery and facilitation
Run workshops, sprints and coaching at scale to enable leaders to practice decisions and trade-offs safely, simulating market and financial trade-offs in realistic scenarios.
Orchestrate peer learning and structured reflection while localizing content for culture and language across 30+ countries in 2024.
BTS, founded 1986 and listed on Nasdaq Stockholm, uses its global footprint to scale facilitation and measure impact.

Digital product development
Develop and maintain platforms, portals and content libraries that scale to enterprise needs; digital services drove ~30% of professional learning engagements in 2024. Integrate with client systems for SSO and data capture across 100+ integrations to enable measurable impact. Enhance analytics, personalization and mobile UX while ensuring security, 99.9% uptime SLAs and ISO 27001/GDPR compliance.
- Platforms and content libraries
- Client integrations (SSO, APIs)
- Analytics, personalization, mobile UX
- Security, 99.9% uptime, ISO 27001/GDPR
Measurement and change enablement
Measure behavior shifts and business KPIs tied to strategy, using dashboards that link actions to outcomes; 2024 studies report behavior-change programs commonly yield 10–20% improvements in target metrics. Provide sponsors clear ROI narratives and dashboards. Reinforce change with nudges, coaching and performance routines and course-correct interventions using evidence.
- Track: behavior → KPI
- Visualize: dashboards, ROI
- Reinforce: nudges/coaching
- Correct: evidence-led tweaks
Diagnostic discovery closes gaps causing 70% of failures; 10–20% KPI lifts
Diagnostic discovery pinpoints gaps driving 70% of transformation failures; baselines set for measurement. Designs custom simulations and blended 70/20/10 programs iterated in 4-week sprints. Scales delivery across 30+ countries (2024), with digital ~30% of engagements and measured KPI lifts of 10–20%.
| Activity | Metric | 2024 |
|---|---|---|
| Digital share | % engagements | ≈30% |
| Geographic reach | Countries | 30+ |
| KPI lift | Behavior programs | 10–20% |
Full Document Unlocks After Purchase
Business Model Canvas
The document you’re previewing is the exact BTS Group Business Model Canvas you’ll receive after purchase, not a mockup or sample. When you complete your order, you’ll instantly get the full, editable file—structured and formatted exactly as shown—for editing, presenting, or sharing. No surprises, just the real deliverable.

Business Model Canvas: Key Value Propositions, Customers and Scalable Revenue Drivers
Explore BTS Group’s strategic blueprint with this concise Business Model Canvas overview that highlights value propositions, customer segments, and revenue engines. Dive into how partnerships and capabilities drive scalable growth and competitive edge. Purchase the full, editable Canvas for a complete, section-by-section playbook to apply directly in strategy, benchmarking, or investor analysis.
Partnerships
Enterprise clients
Strategic partnerships with global enterprise clients co-create solutions tightly aligned to each client strategy, leveraging BTS presence in 35+ countries and service delivery across 60+ markets (2024). Multi-year engagements provide scale, context and enable rigorous impact measurement tied to business KPIs. Client SMEs supply real data to enrich simulations and ensure relevance. Joint governance structures accelerate adoption and measurable outcomes.
Technology platforms
Alliances with LMS, LXP, analytics and collaboration vendors enable seamless delivery across channels, tapping a global corporate learning market that surpassed $300 billion in 2024. Robust APIs and integrations support real-time data flow and personalization at scale. VR/AR and simulation engines drive experiential learning, while security-certified partners (ISO/IEC 27001, SOC 2) ensure enterprise readiness and compliance.
Academic and thought leaders
Collaboration with universities and researchers strengthens BTS evidence-based methodologies by integrating peer-reviewed insights and field trials. External experts validate leadership models and strategy frameworks, improving adoption and measurement. Co-authored content boosts credibility and reach across academic and corporate channels. In 2024 BTS engaged dozens of research partners and employed roughly 1,200 consultants to scale innovation and benchmarking.
Facilitator and contractor network
Global certified facilitators expand BTS delivery capacity and localization, aligning with a 2024 global consulting market ≈330 billion USD; specialty contractors add design, data and industry expertise; flexible staffing reduces fixed payroll, improving responsiveness and margin control; standardized quality systems ensure consistent outcomes at scale.
- Global market 2024 ≈330B USD
- Certified facilitators for local delivery
- Specialty contractors: design, data, industry
- Flexible staffing = lower fixed costs
- Quality systems maintain consistency
Consulting and channel alliances
Partnerships with consultancies and boutiques extend BTS Group market access, with partner-led deals comprising about 35% of bookings in 2024; joint pursuits integrate strategy design with execution, shortening delivery cycles. Resellers and regional partners open new geographies, while revenue-sharing models align incentives and accelerate growth.
- partner-led ≈35% bookings (2024)
- joint pursuits = faster execution
- revenue-sharing → aligned incentives
Partner-led deals: ≈35% bookings, 35+ countries
Strategic alliances with global clients (35+ countries, 60+ markets) and tech vendors drive co-created solutions tied to KPIs; partner-led deals were ≈35% of bookings in 2024. Academic and research partners (dozens engaged, ~1,200 consultants) validate methods. Certified facilitators and contractors scale delivery, improving margins amid a $300B+ corporate learning market (2024).
| Partnership | Role | 2024 metric |
|---|---|---|
| Global clients | Co-create, long-term | 35+ countries, 60+ markets |
| Tech vendors | Delivery & integrations | API/LMS/LXP, security certs |
| Research & academia | Validate methods | Dozens partners, 1,200 consultants |
| Facilitators/contractors | Local delivery | Scalable, quality systems |
What is included in the product
Detailed Word Document
A comprehensive Business Model Canvas for BTS Group detailing customer segments, value propositions, channels, revenue streams and key resources across the 9 BMC blocks, with competitive advantage analysis, linked SWOT insights and polished narratives—ideal for investor presentations, strategic planning and validation using real-world company data.
Customizable Excel Spreadsheet
High-level view of BTS Group's business model with editable cells, relieving the pain of scattered strategy documents by consolidating revenue streams, client segments, and value propositions into one editable page for faster decision-making.
Activities
Diagnostic and discovery
Diagnostic and discovery assesses strategic priorities, capability gaps, and behavioral barriers, noting that roughly 70% of transformations fail when these are unaddressed per McKinsey. Stakeholder interviews and rigorous data reviews shape the intervention design and target levers. Baselines are established for impact measurement and insights drive messaging and change levers.
Experience design
Builds customized simulations, playbooks and learning journeys tailored to client KPIs and cost structures, aligning scenarios to the operating model and strategic metrics. Programs blend digital, live and on-the-job elements following the 70/20/10 learning model to maximize transfer. Iterates rapidly via client feedback loops and 4-week sprint cycles to improve stickiness and measurable behavior change.
Delivery and facilitation
Run workshops, sprints and coaching at scale to enable leaders to practice decisions and trade-offs safely, simulating market and financial trade-offs in realistic scenarios.
Orchestrate peer learning and structured reflection while localizing content for culture and language across 30+ countries in 2024.
BTS, founded 1986 and listed on Nasdaq Stockholm, uses its global footprint to scale facilitation and measure impact.
Digital product development
Develop and maintain platforms, portals and content libraries that scale to enterprise needs; digital services drove ~30% of professional learning engagements in 2024. Integrate with client systems for SSO and data capture across 100+ integrations to enable measurable impact. Enhance analytics, personalization and mobile UX while ensuring security, 99.9% uptime SLAs and ISO 27001/GDPR compliance.
- Platforms and content libraries
- Client integrations (SSO, APIs)
- Analytics, personalization, mobile UX
- Security, 99.9% uptime, ISO 27001/GDPR
Measurement and change enablement
Measure behavior shifts and business KPIs tied to strategy, using dashboards that link actions to outcomes; 2024 studies report behavior-change programs commonly yield 10–20% improvements in target metrics. Provide sponsors clear ROI narratives and dashboards. Reinforce change with nudges, coaching and performance routines and course-correct interventions using evidence.
- Track: behavior → KPI
- Visualize: dashboards, ROI
- Reinforce: nudges/coaching
- Correct: evidence-led tweaks
Diagnostic discovery closes gaps causing 70% of failures; 10–20% KPI lifts
Diagnostic discovery pinpoints gaps driving 70% of transformation failures; baselines set for measurement. Designs custom simulations and blended 70/20/10 programs iterated in 4-week sprints. Scales delivery across 30+ countries (2024), with digital ~30% of engagements and measured KPI lifts of 10–20%.
| Activity | Metric | 2024 |
|---|---|---|
| Digital share | % engagements | ≈30% |
| Geographic reach | Countries | 30+ |
| KPI lift | Behavior programs | 10–20% |
Full Document Unlocks After Purchase
Business Model Canvas
The document you’re previewing is the exact BTS Group Business Model Canvas you’ll receive after purchase, not a mockup or sample. When you complete your order, you’ll instantly get the full, editable file—structured and formatted exactly as shown—for editing, presenting, or sharing. No surprises, just the real deliverable.
Original: $10.00
-65%$10.00
$3.50Description
Business Model Canvas: Key Value Propositions, Customers and Scalable Revenue Drivers
Explore BTS Group’s strategic blueprint with this concise Business Model Canvas overview that highlights value propositions, customer segments, and revenue engines. Dive into how partnerships and capabilities drive scalable growth and competitive edge. Purchase the full, editable Canvas for a complete, section-by-section playbook to apply directly in strategy, benchmarking, or investor analysis.
Partnerships
Enterprise clients
Strategic partnerships with global enterprise clients co-create solutions tightly aligned to each client strategy, leveraging BTS presence in 35+ countries and service delivery across 60+ markets (2024). Multi-year engagements provide scale, context and enable rigorous impact measurement tied to business KPIs. Client SMEs supply real data to enrich simulations and ensure relevance. Joint governance structures accelerate adoption and measurable outcomes.
Technology platforms
Alliances with LMS, LXP, analytics and collaboration vendors enable seamless delivery across channels, tapping a global corporate learning market that surpassed $300 billion in 2024. Robust APIs and integrations support real-time data flow and personalization at scale. VR/AR and simulation engines drive experiential learning, while security-certified partners (ISO/IEC 27001, SOC 2) ensure enterprise readiness and compliance.
Academic and thought leaders
Collaboration with universities and researchers strengthens BTS evidence-based methodologies by integrating peer-reviewed insights and field trials. External experts validate leadership models and strategy frameworks, improving adoption and measurement. Co-authored content boosts credibility and reach across academic and corporate channels. In 2024 BTS engaged dozens of research partners and employed roughly 1,200 consultants to scale innovation and benchmarking.
Facilitator and contractor network
Global certified facilitators expand BTS delivery capacity and localization, aligning with a 2024 global consulting market ≈330 billion USD; specialty contractors add design, data and industry expertise; flexible staffing reduces fixed payroll, improving responsiveness and margin control; standardized quality systems ensure consistent outcomes at scale.
- Global market 2024 ≈330B USD
- Certified facilitators for local delivery
- Specialty contractors: design, data, industry
- Flexible staffing = lower fixed costs
- Quality systems maintain consistency
Consulting and channel alliances
Partnerships with consultancies and boutiques extend BTS Group market access, with partner-led deals comprising about 35% of bookings in 2024; joint pursuits integrate strategy design with execution, shortening delivery cycles. Resellers and regional partners open new geographies, while revenue-sharing models align incentives and accelerate growth.
- partner-led ≈35% bookings (2024)
- joint pursuits = faster execution
- revenue-sharing → aligned incentives
Partner-led deals: ≈35% bookings, 35+ countries
Strategic alliances with global clients (35+ countries, 60+ markets) and tech vendors drive co-created solutions tied to KPIs; partner-led deals were ≈35% of bookings in 2024. Academic and research partners (dozens engaged, ~1,200 consultants) validate methods. Certified facilitators and contractors scale delivery, improving margins amid a $300B+ corporate learning market (2024).
| Partnership | Role | 2024 metric |
|---|---|---|
| Global clients | Co-create, long-term | 35+ countries, 60+ markets |
| Tech vendors | Delivery & integrations | API/LMS/LXP, security certs |
| Research & academia | Validate methods | Dozens partners, 1,200 consultants |
| Facilitators/contractors | Local delivery | Scalable, quality systems |
What is included in the product
Detailed Word Document
A comprehensive Business Model Canvas for BTS Group detailing customer segments, value propositions, channels, revenue streams and key resources across the 9 BMC blocks, with competitive advantage analysis, linked SWOT insights and polished narratives—ideal for investor presentations, strategic planning and validation using real-world company data.
Customizable Excel Spreadsheet
High-level view of BTS Group's business model with editable cells, relieving the pain of scattered strategy documents by consolidating revenue streams, client segments, and value propositions into one editable page for faster decision-making.
Activities
Diagnostic and discovery
Diagnostic and discovery assesses strategic priorities, capability gaps, and behavioral barriers, noting that roughly 70% of transformations fail when these are unaddressed per McKinsey. Stakeholder interviews and rigorous data reviews shape the intervention design and target levers. Baselines are established for impact measurement and insights drive messaging and change levers.
Experience design
Builds customized simulations, playbooks and learning journeys tailored to client KPIs and cost structures, aligning scenarios to the operating model and strategic metrics. Programs blend digital, live and on-the-job elements following the 70/20/10 learning model to maximize transfer. Iterates rapidly via client feedback loops and 4-week sprint cycles to improve stickiness and measurable behavior change.
Delivery and facilitation
Run workshops, sprints and coaching at scale to enable leaders to practice decisions and trade-offs safely, simulating market and financial trade-offs in realistic scenarios.
Orchestrate peer learning and structured reflection while localizing content for culture and language across 30+ countries in 2024.
BTS, founded 1986 and listed on Nasdaq Stockholm, uses its global footprint to scale facilitation and measure impact.
Digital product development
Develop and maintain platforms, portals and content libraries that scale to enterprise needs; digital services drove ~30% of professional learning engagements in 2024. Integrate with client systems for SSO and data capture across 100+ integrations to enable measurable impact. Enhance analytics, personalization and mobile UX while ensuring security, 99.9% uptime SLAs and ISO 27001/GDPR compliance.
- Platforms and content libraries
- Client integrations (SSO, APIs)
- Analytics, personalization, mobile UX
- Security, 99.9% uptime, ISO 27001/GDPR
Measurement and change enablement
Measure behavior shifts and business KPIs tied to strategy, using dashboards that link actions to outcomes; 2024 studies report behavior-change programs commonly yield 10–20% improvements in target metrics. Provide sponsors clear ROI narratives and dashboards. Reinforce change with nudges, coaching and performance routines and course-correct interventions using evidence.
- Track: behavior → KPI
- Visualize: dashboards, ROI
- Reinforce: nudges/coaching
- Correct: evidence-led tweaks
Diagnostic discovery closes gaps causing 70% of failures; 10–20% KPI lifts
Diagnostic discovery pinpoints gaps driving 70% of transformation failures; baselines set for measurement. Designs custom simulations and blended 70/20/10 programs iterated in 4-week sprints. Scales delivery across 30+ countries (2024), with digital ~30% of engagements and measured KPI lifts of 10–20%.
| Activity | Metric | 2024 |
|---|---|---|
| Digital share | % engagements | ≈30% |
| Geographic reach | Countries | 30+ |
| KPI lift | Behavior programs | 10–20% |
Full Document Unlocks After Purchase
Business Model Canvas
The document you’re previewing is the exact BTS Group Business Model Canvas you’ll receive after purchase, not a mockup or sample. When you complete your order, you’ll instantly get the full, editable file—structured and formatted exactly as shown—for editing, presenting, or sharing. No surprises, just the real deliverable.











