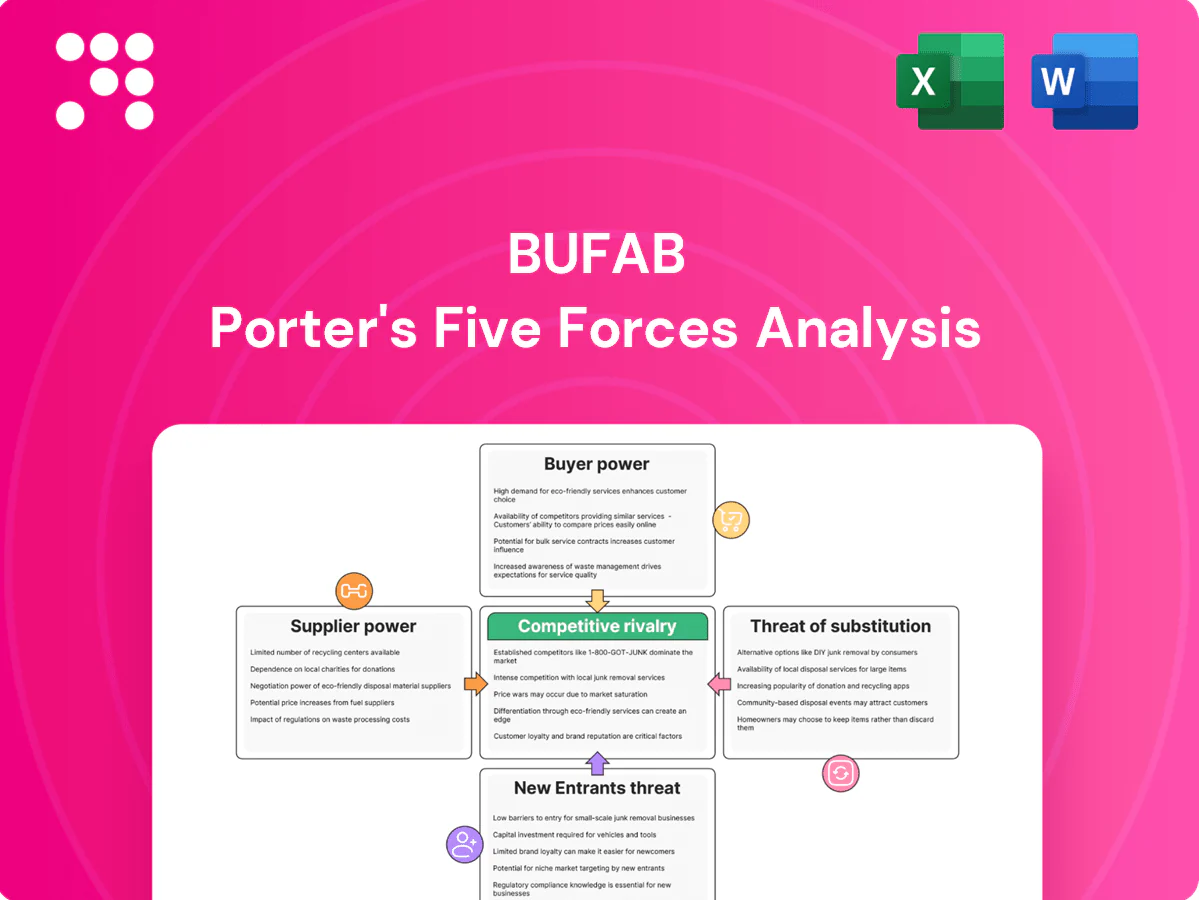
Bufab Porter's Five Forces Analysis

A Must-Have Tool for Decision-Makers
Bufab’s Porter's Five Forces snapshot highlights how supplier concentration, buyer leverage, new entrant threats and substitutes shape its margins and competitive edge. It outlines strategic levers Bufab can pull to defend market share and cost structure. Unlock the full Porter's Five Forces Analysis for force-by-force ratings, visuals and actionable implications tailored to Bufab.
Suppliers Bargaining Power

Fragmented global supplier base
Fastener manufacturing is highly fragmented across Asia, Europe and emerging markets, enabling multi-sourcing across three regions. This fragmentation dilutes individual supplier power and allows Bufab in 2024 to leverage competition among suppliers to negotiate price and terms. It lowers dependency risk but increases coordination complexity and supply‑chain management costs.
Specialized and certified parts
For safety-critical and certified fasteners, the pool of qualified suppliers is narrow, giving suppliers leverage through approvals, tooling ownership and IP; stringent lead-time and quality demands further hinder switching. Bufab counters supplier power by maintaining dual sources and structured qualification pipelines to preserve continuity and compliance.

Raw material volatility pass-through
Steel, stainless and specialty alloys drive input costs and suppliers increasingly push volatility through pricing clauses, raising short-term supplier power over distributors.
Contract mechanisms and hedging reduce peak exposure but cannot fully eliminate raw-material spikes, keeping pass-through risk elevated.
Bufab’s scale improves purchasing timing and inventory smoothing, mitigating but not removing supplier-driven cost swings.

Logistics and geopolitics
Port congestion, tariffs and regional disruptions elevate supplier bargaining power; however global container freight rates fell about 60% from 2021 peaks by 2024, easing pressure. When capacity tightens carriers allocate to larger strategic customers, but diversified lanes and nearshoring reduce that leverage. Bufab’s global footprint enables regional switching to stabilize supply.
- Port congestion -> higher supplier leverage
- 60% drop in freight rates by 2024 -> reduced pressure
- Diversified lanes/nearshoring -> dampen supplier power
Quality and compliance overhead
Fragmented suppliers; narrow certified pool raises switching costs; 60% freight fall
Supplier fragmentation across regions dilutes individual power, letting Bufab in 2024 leverage competition for price and terms. Qualified certified fastener suppliers remain narrow, raising switching costs and approval leverage. A 60% drop in global freight rates by 2024 eased logistics pressure, while steel/alloy price volatility and contractual pass-through keep supplier risk elevated.
| Metric | 2024 |
|---|---|
| Freight rate change | -60% |
| Supplier fragmentation | High |
| Certified supplier pool | Narrow |
What is included in the product
 Detailed Word Document
Provides a tailored Porter's Five Forces assessment for Bufab, uncovering competitive drivers, buyer and supplier power, substitutes and entry barriers, with industry data and strategic implications to inform pricing, profitability, and defensive or growth moves.

 Customizable Excel Spreadsheet
A single-sheet Bufab Porter's Five Forces summary that visualizes supplier, buyer, rivalry, new entrants and substitutes to pinpoint strategic pressure points and fast-track corrective actions.
Customers Bargaining Power

Large OEMs with scale
In 2024 large OEM customers aggregate significant volumes and run competitive RFQs that compress margins, with professional procurement teams driving intense price pressure. Multi-year tenders force suppliers into deeper concessions on price and service levels. Bufab counters by offering bundled inventory, logistics and quality solutions and quantifying total cost of ownership to defend margins and win consolidated contracts.
Switching costs via integration
VMI programs, kitting, EDI and line-side delivery embed Bufab into customers’ operations, creating switching costs beyond unit price and often representing over 50% of logistics/service value in OEM relationships in 2024. Re-qualification cycles and disruption risk (audit, validation, downtime) temper buyer power. Still, buyers use incumbent performance and price benchmarks to negotiate better terms.

Standardized C-parts commoditization
Many C-part SKUs are standardized—by 2024 C-parts typically represent ~40% of SKUs but only ~10% of procurement spend—heightening price transparency and enabling buyers to cross-bid among distributors for common items. Differentiation therefore shifts to reliability, fill rates and low quality-escape risk. Bufab defends margins on commoditized lines via service KPIs, sustaining fill rates above 90% and tight quality controls.

Demand cyclicality
Industrial cycles and inventory corrections can abruptly cut buyers volumes, prompting customers in downturns to demand price reductions and extended payment terms; volume-linked rebate schemes further amplify this pressure on margins.
Bufab’s diversified end-markets — spanning automotive, industrial, electronics and construction — mitigates the impact of concentrated swings by smoothing demand across sectors.
- Demand cyclicality: abrupt volume drops in downturns
- Buyer leverage: price cuts and extended terms pressure margins
- Rebates: volume-linked discounts amplify cost exposure
- Diversification: multi-end-market exposure reduces concentration risk
TCO and consolidation plays
Procurement teams push supplier consolidation to cut total cost of ownership, with 2024 industry surveys targeting 15–25% TCO reductions; they bargain for broader baskets and integrated services, lowering price per unit while shifting more spend to fewer suppliers. Bufab stands to expand wallet share and revenue per customer if it wins consolidation mandates.
- 2024 TCO targets: 15–25%
- Broader baskets → lower unit price, higher wallet share
- Bufab upside: expanded revenue if appointed consolidator
OEM RFQs push 15-25% TCO cuts; VMI & kitting create >50% switching costs
In 2024 large OEM RFQs and multi-year tenders compress margins as procurement seeks 15–25% TCO cuts. VMI, kitting, EDI and line-side delivery create switching costs worth over 50% of logistics/service value, supporting Bufab’s >90% fill rates. C-parts remain ~40% of SKUs but ~10% of spend, raising price transparency and consolidation pressure.
| Metric | 2024 Value |
|---|---|
| TCO targets | 15–25% |
| C-parts (% SKUs) | ~40% |
| C-parts (% spend) | ~10% |
| Service value: switching costs | >50% |
| Bufab fill rate | >90% |
Same Document Delivered
Bufab Porter's Five Forces Analysis
This preview shows the exact Bufab Porter's Five Forces Analysis you'll receive immediately after purchase—no placeholders or samples. The document displayed is fully formatted, professionally written, and ready for download and use the moment you buy. You're looking at the final deliverable with actionable insights on industry competitive pressures.

A Must-Have Tool for Decision-Makers
Bufab’s Porter's Five Forces snapshot highlights how supplier concentration, buyer leverage, new entrant threats and substitutes shape its margins and competitive edge. It outlines strategic levers Bufab can pull to defend market share and cost structure. Unlock the full Porter's Five Forces Analysis for force-by-force ratings, visuals and actionable implications tailored to Bufab.
Suppliers Bargaining Power
Fragmented global supplier base
Fastener manufacturing is highly fragmented across Asia, Europe and emerging markets, enabling multi-sourcing across three regions. This fragmentation dilutes individual supplier power and allows Bufab in 2024 to leverage competition among suppliers to negotiate price and terms. It lowers dependency risk but increases coordination complexity and supply‑chain management costs.
Specialized and certified parts
For safety-critical and certified fasteners, the pool of qualified suppliers is narrow, giving suppliers leverage through approvals, tooling ownership and IP; stringent lead-time and quality demands further hinder switching. Bufab counters supplier power by maintaining dual sources and structured qualification pipelines to preserve continuity and compliance.
Raw material volatility pass-through
Steel, stainless and specialty alloys drive input costs and suppliers increasingly push volatility through pricing clauses, raising short-term supplier power over distributors.
Contract mechanisms and hedging reduce peak exposure but cannot fully eliminate raw-material spikes, keeping pass-through risk elevated.
Bufab’s scale improves purchasing timing and inventory smoothing, mitigating but not removing supplier-driven cost swings.
Logistics and geopolitics
Port congestion, tariffs and regional disruptions elevate supplier bargaining power; however global container freight rates fell about 60% from 2021 peaks by 2024, easing pressure. When capacity tightens carriers allocate to larger strategic customers, but diversified lanes and nearshoring reduce that leverage. Bufab’s global footprint enables regional switching to stabilize supply.
- Port congestion -> higher supplier leverage
- 60% drop in freight rates by 2024 -> reduced pressure
- Diversified lanes/nearshoring -> dampen supplier power
Quality and compliance overhead
Fragmented suppliers; narrow certified pool raises switching costs; 60% freight fall
Supplier fragmentation across regions dilutes individual power, letting Bufab in 2024 leverage competition for price and terms. Qualified certified fastener suppliers remain narrow, raising switching costs and approval leverage. A 60% drop in global freight rates by 2024 eased logistics pressure, while steel/alloy price volatility and contractual pass-through keep supplier risk elevated.
| Metric | 2024 |
|---|---|
| Freight rate change | -60% |
| Supplier fragmentation | High |
| Certified supplier pool | Narrow |
What is included in the product
Detailed Word Document
Provides a tailored Porter's Five Forces assessment for Bufab, uncovering competitive drivers, buyer and supplier power, substitutes and entry barriers, with industry data and strategic implications to inform pricing, profitability, and defensive or growth moves.
Customizable Excel Spreadsheet
A single-sheet Bufab Porter's Five Forces summary that visualizes supplier, buyer, rivalry, new entrants and substitutes to pinpoint strategic pressure points and fast-track corrective actions.
Customers Bargaining Power
Large OEMs with scale
In 2024 large OEM customers aggregate significant volumes and run competitive RFQs that compress margins, with professional procurement teams driving intense price pressure. Multi-year tenders force suppliers into deeper concessions on price and service levels. Bufab counters by offering bundled inventory, logistics and quality solutions and quantifying total cost of ownership to defend margins and win consolidated contracts.
Switching costs via integration
VMI programs, kitting, EDI and line-side delivery embed Bufab into customers’ operations, creating switching costs beyond unit price and often representing over 50% of logistics/service value in OEM relationships in 2024. Re-qualification cycles and disruption risk (audit, validation, downtime) temper buyer power. Still, buyers use incumbent performance and price benchmarks to negotiate better terms.
Standardized C-parts commoditization
Many C-part SKUs are standardized—by 2024 C-parts typically represent ~40% of SKUs but only ~10% of procurement spend—heightening price transparency and enabling buyers to cross-bid among distributors for common items. Differentiation therefore shifts to reliability, fill rates and low quality-escape risk. Bufab defends margins on commoditized lines via service KPIs, sustaining fill rates above 90% and tight quality controls.
Demand cyclicality
Industrial cycles and inventory corrections can abruptly cut buyers volumes, prompting customers in downturns to demand price reductions and extended payment terms; volume-linked rebate schemes further amplify this pressure on margins.
Bufab’s diversified end-markets — spanning automotive, industrial, electronics and construction — mitigates the impact of concentrated swings by smoothing demand across sectors.
- Demand cyclicality: abrupt volume drops in downturns
- Buyer leverage: price cuts and extended terms pressure margins
- Rebates: volume-linked discounts amplify cost exposure
- Diversification: multi-end-market exposure reduces concentration risk
TCO and consolidation plays
Procurement teams push supplier consolidation to cut total cost of ownership, with 2024 industry surveys targeting 15–25% TCO reductions; they bargain for broader baskets and integrated services, lowering price per unit while shifting more spend to fewer suppliers. Bufab stands to expand wallet share and revenue per customer if it wins consolidation mandates.
- 2024 TCO targets: 15–25%
- Broader baskets → lower unit price, higher wallet share
- Bufab upside: expanded revenue if appointed consolidator
OEM RFQs push 15-25% TCO cuts; VMI & kitting create >50% switching costs
In 2024 large OEM RFQs and multi-year tenders compress margins as procurement seeks 15–25% TCO cuts. VMI, kitting, EDI and line-side delivery create switching costs worth over 50% of logistics/service value, supporting Bufab’s >90% fill rates. C-parts remain ~40% of SKUs but ~10% of spend, raising price transparency and consolidation pressure.
| Metric | 2024 Value |
|---|---|
| TCO targets | 15–25% |
| C-parts (% SKUs) | ~40% |
| C-parts (% spend) | ~10% |
| Service value: switching costs | >50% |
| Bufab fill rate | >90% |
Same Document Delivered
Bufab Porter's Five Forces Analysis
This preview shows the exact Bufab Porter's Five Forces Analysis you'll receive immediately after purchase—no placeholders or samples. The document displayed is fully formatted, professionally written, and ready for download and use the moment you buy. You're looking at the final deliverable with actionable insights on industry competitive pressures.
Description
A Must-Have Tool for Decision-Makers
Bufab’s Porter's Five Forces snapshot highlights how supplier concentration, buyer leverage, new entrant threats and substitutes shape its margins and competitive edge. It outlines strategic levers Bufab can pull to defend market share and cost structure. Unlock the full Porter's Five Forces Analysis for force-by-force ratings, visuals and actionable implications tailored to Bufab.
Suppliers Bargaining Power
Fragmented global supplier base
Fastener manufacturing is highly fragmented across Asia, Europe and emerging markets, enabling multi-sourcing across three regions. This fragmentation dilutes individual supplier power and allows Bufab in 2024 to leverage competition among suppliers to negotiate price and terms. It lowers dependency risk but increases coordination complexity and supply‑chain management costs.
Specialized and certified parts
For safety-critical and certified fasteners, the pool of qualified suppliers is narrow, giving suppliers leverage through approvals, tooling ownership and IP; stringent lead-time and quality demands further hinder switching. Bufab counters supplier power by maintaining dual sources and structured qualification pipelines to preserve continuity and compliance.
Raw material volatility pass-through
Steel, stainless and specialty alloys drive input costs and suppliers increasingly push volatility through pricing clauses, raising short-term supplier power over distributors.
Contract mechanisms and hedging reduce peak exposure but cannot fully eliminate raw-material spikes, keeping pass-through risk elevated.
Bufab’s scale improves purchasing timing and inventory smoothing, mitigating but not removing supplier-driven cost swings.
Logistics and geopolitics
Port congestion, tariffs and regional disruptions elevate supplier bargaining power; however global container freight rates fell about 60% from 2021 peaks by 2024, easing pressure. When capacity tightens carriers allocate to larger strategic customers, but diversified lanes and nearshoring reduce that leverage. Bufab’s global footprint enables regional switching to stabilize supply.
- Port congestion -> higher supplier leverage
- 60% drop in freight rates by 2024 -> reduced pressure
- Diversified lanes/nearshoring -> dampen supplier power
Quality and compliance overhead
Fragmented suppliers; narrow certified pool raises switching costs; 60% freight fall
Supplier fragmentation across regions dilutes individual power, letting Bufab in 2024 leverage competition for price and terms. Qualified certified fastener suppliers remain narrow, raising switching costs and approval leverage. A 60% drop in global freight rates by 2024 eased logistics pressure, while steel/alloy price volatility and contractual pass-through keep supplier risk elevated.
| Metric | 2024 |
|---|---|
| Freight rate change | -60% |
| Supplier fragmentation | High |
| Certified supplier pool | Narrow |
What is included in the product
Detailed Word Document
Provides a tailored Porter's Five Forces assessment for Bufab, uncovering competitive drivers, buyer and supplier power, substitutes and entry barriers, with industry data and strategic implications to inform pricing, profitability, and defensive or growth moves.
Customizable Excel Spreadsheet
A single-sheet Bufab Porter's Five Forces summary that visualizes supplier, buyer, rivalry, new entrants and substitutes to pinpoint strategic pressure points and fast-track corrective actions.
Customers Bargaining Power
Large OEMs with scale
In 2024 large OEM customers aggregate significant volumes and run competitive RFQs that compress margins, with professional procurement teams driving intense price pressure. Multi-year tenders force suppliers into deeper concessions on price and service levels. Bufab counters by offering bundled inventory, logistics and quality solutions and quantifying total cost of ownership to defend margins and win consolidated contracts.
Switching costs via integration
VMI programs, kitting, EDI and line-side delivery embed Bufab into customers’ operations, creating switching costs beyond unit price and often representing over 50% of logistics/service value in OEM relationships in 2024. Re-qualification cycles and disruption risk (audit, validation, downtime) temper buyer power. Still, buyers use incumbent performance and price benchmarks to negotiate better terms.
Standardized C-parts commoditization
Many C-part SKUs are standardized—by 2024 C-parts typically represent ~40% of SKUs but only ~10% of procurement spend—heightening price transparency and enabling buyers to cross-bid among distributors for common items. Differentiation therefore shifts to reliability, fill rates and low quality-escape risk. Bufab defends margins on commoditized lines via service KPIs, sustaining fill rates above 90% and tight quality controls.
Demand cyclicality
Industrial cycles and inventory corrections can abruptly cut buyers volumes, prompting customers in downturns to demand price reductions and extended payment terms; volume-linked rebate schemes further amplify this pressure on margins.
Bufab’s diversified end-markets — spanning automotive, industrial, electronics and construction — mitigates the impact of concentrated swings by smoothing demand across sectors.
- Demand cyclicality: abrupt volume drops in downturns
- Buyer leverage: price cuts and extended terms pressure margins
- Rebates: volume-linked discounts amplify cost exposure
- Diversification: multi-end-market exposure reduces concentration risk
TCO and consolidation plays
Procurement teams push supplier consolidation to cut total cost of ownership, with 2024 industry surveys targeting 15–25% TCO reductions; they bargain for broader baskets and integrated services, lowering price per unit while shifting more spend to fewer suppliers. Bufab stands to expand wallet share and revenue per customer if it wins consolidation mandates.
- 2024 TCO targets: 15–25%
- Broader baskets → lower unit price, higher wallet share
- Bufab upside: expanded revenue if appointed consolidator
OEM RFQs push 15-25% TCO cuts; VMI & kitting create >50% switching costs
In 2024 large OEM RFQs and multi-year tenders compress margins as procurement seeks 15–25% TCO cuts. VMI, kitting, EDI and line-side delivery create switching costs worth over 50% of logistics/service value, supporting Bufab’s >90% fill rates. C-parts remain ~40% of SKUs but ~10% of spend, raising price transparency and consolidation pressure.
| Metric | 2024 Value |
|---|---|
| TCO targets | 15–25% |
| C-parts (% SKUs) | ~40% |
| C-parts (% spend) | ~10% |
| Service value: switching costs | >50% |
| Bufab fill rate | >90% |
Same Document Delivered
Bufab Porter's Five Forces Analysis
This preview shows the exact Bufab Porter's Five Forces Analysis you'll receive immediately after purchase—no placeholders or samples. The document displayed is fully formatted, professionally written, and ready for download and use the moment you buy. You're looking at the final deliverable with actionable insights on industry competitive pressures.











