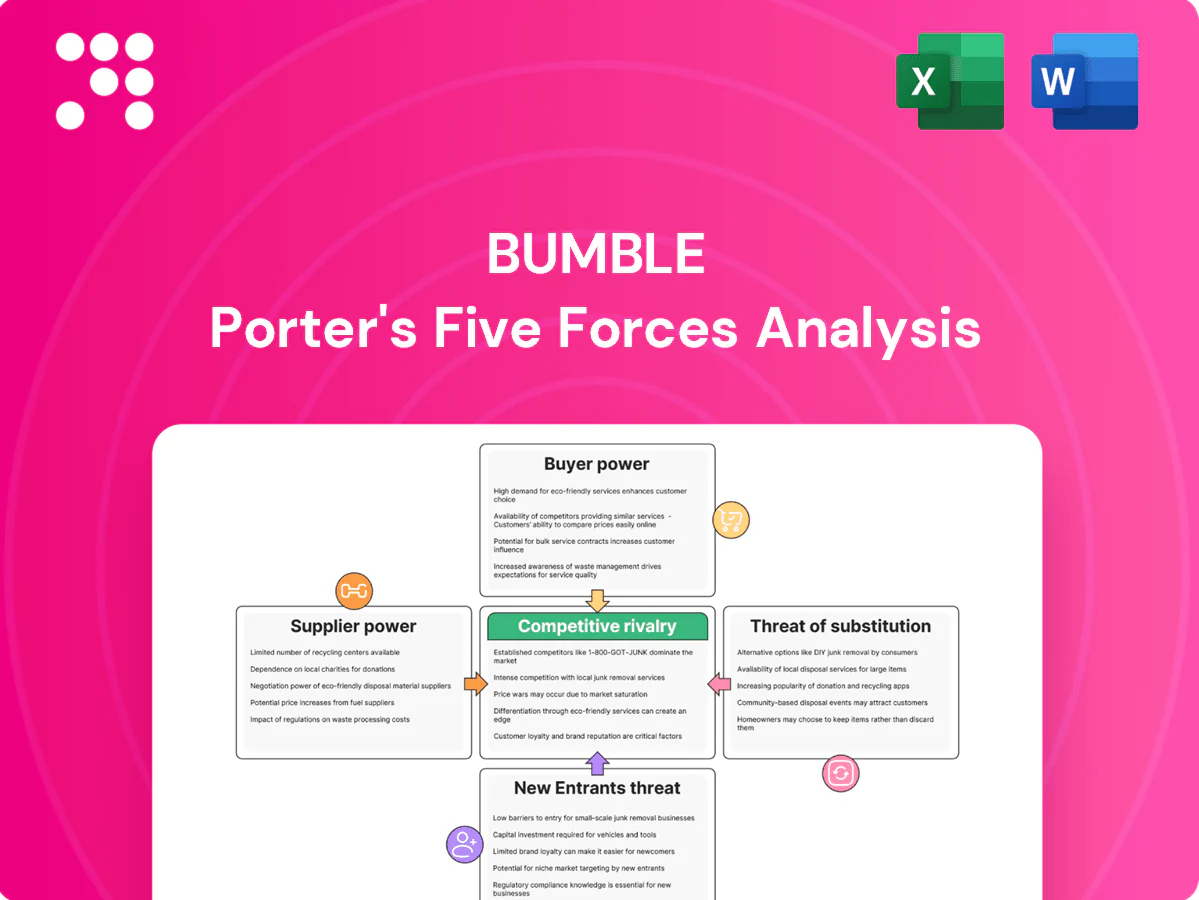
Bumble Porter's Five Forces Analysis

Go Beyond the Preview—Access the Full Strategic Report
Bumble faces intense network-driven competition, rising substitute platforms, and shifting buyer preferences that shape its pricing and growth potential; this snapshot highlights core pressures but skips force-by-force ratings. The full Porter's Five Forces Analysis breaks down supplier influence, entrant threats, and competitive rivalry with data-driven visuals and strategic implications. Unlock the complete report to inform investment or strategy with consultant-grade insights ready for presentation.
Suppliers Bargaining Power

App store gatekeepers
Apple and Google, which together control over 90% of mobile app distribution, dictate fees (commonly 30% or reduced 15% rates for eligible subscriptions), in-app payment rules, and platform policies that shape feature design. Policy shifts—such as changes to tracking or payment rules—can directly alter monetization and pricing flexibility. A suspension or dispute with either store would materially curtail Bumble’s reach. Negotiating leverage is constrained by this duopoly.
Cloud and infrastructure
Dependence on major cloud vendors concentrates risk: AWS, Microsoft Azure and Google Cloud held about 66% of the cloud infra market in 2024 (Synergy Research), so price hikes or outages can squeeze Bumble’s margins and uptime. Multi-cloud, edge and CDN strategies (Cloudflare/Akamai) reduce but do not remove exposure. Large scale commitments can win double-digit discounts yet increase vendor lock-in.

Payment processors
Payment processors and anti-fraud tools materially affect authorization rates, chargebacks and Bumble’s net take-rate, with processors’ fees typically ranging 1.3–3.5% plus $0.10–$0.30 per transaction and chargeback exposure usually kept under 1%. Regional partners are required for local methods, adding switching friction and tens of extra integrations. Fee structures and regulatory compliance raise pricing, and consolidation among processors increases supplier power.

Safety, trust, and data tools
Third-party identity verification, photo screening, AI moderation and analytics vendors are core to Bumble’s safety stack; vendor accuracy directly affects user retention and legal exposure, with the identity-verification market valued at about $15.6B in 2024. Certifications (SOC 2, GDPR) and specialized models raise switching costs, and in-house build-outs can cut costs but not fully eliminate vendor dependency.
Talent and ad inventory
Specialized engineering, ML, and trust & safety talent remain scarce—LinkedIn 2024 Emerging Jobs Report showed AI and trust roles grew ~35% YoY—giving labor markets meaningful bargaining power; employer brand and retention programs cut churn but do not eliminate premium wages. Advertising inventory concentration on large platforms (global digital ad spend >$500B in 2024) tightens UA pacing, while social auction dynamics can spike CAC as programmatic CPMs rose ~15% YoY in 2024.
- Talent scarcity: AI/trust roles +35% (LinkedIn 2024)
- Ad inventory: global digital ad spend >$500B (2024)
- Auction impact: programmatic CPMs ~+15% YoY (2024)
App stores >90% control; cloud 66% share; payments, ID vendors and +35% AI hiring squeeze margins
Apple and Google control >90% of app distribution, setting fees and rules that limit Bumble’s pricing flexibility and pose material delisting risk. Cloud concentration (66% market share) and payment processor fees (1.3–3.5% + $0.10–$0.30) squeeze margins. ID/moderation vendors ($15.6B market) and scarce AI/trust talent (+35% YoY) raise switching costs and wage pressure.
| Supplier | 2024 metric |
|---|---|
| App stores | >90% share |
| Cloud | 66% share (Synergy) |
| Payments | 1.3–3.5% + $0.10–$0.30 |
| ID/moderation | $15.6B market |
| Talent | +35% AI/trust roles |
What is included in the product
 Detailed Word Document
Tailored Porter’s Five Forces for Bumble uncovering key competitive drivers, buyer/supplier influence, entry barriers and substitute threats, with strategic insights on market positioning and disruption risks.

 Customizable Excel Spreadsheet
Clear, one-sheet Porter's Five Forces for Bumble that highlights competitive pain points and relief strategies in a single view—customize force intensities, swap in current data, and export a radar chart ready for decks to speed strategic decisions.
Customers Bargaining Power

Low switching costs
As of 2024, low switching costs let users multi-home across dating apps with minimal friction, increasing price sensitivity and forcing frequent promos and free trials to win users. Churn remains common when match quality or UX disappoints, and feature parity across rivals erodes differentiation. Conversion and retention increasingly rely on short-term offers and personalization.
Freemium expectations
Freemium expectations concentrate monetization in a small premium cohort, and buyers can downgrade quickly if benefits are unclear. Paywalls must show immediate, tangible utility; industry conversion rates in 2024 were roughly 3–7%, so small shifts hit revenue materially. Pricing tests risk backlash amplified on social media, driving rapid churn and negative visibility.

Network effects nuance
Large active pools reduce buyer power by improving match quality; Bumble's ecosystem supported roughly 30 million monthly active users in 2024, which cushions individual bargaining. Local density and segment fit drive perceived value more than global scale, so thin cohorts still give users leverage. If liquidity wanes in a cohort, users exert power by exiting or reducing spend. Cross-brand portfolios (dating and networking verticals) help rebalance liquidity across cohorts and geographies.

Advertisers and partners
Advertisers and partners exert moderate to high bargaining power over Bumble: while ads are smaller than subscription revenue, advertisers insist on brand-safe environments and greater measurement transparency after recent privacy-driven tracking changes. Large buyers can negotiate rates and placements, and ad budgets reallocate quickly if campaigns underperform, pressuring CPMs and inventory control.
- Brand safety: high
- Transparency demands: elevated post-privacy
- Large advertisers: strong negotiating leverage
- Spend shifts: rapid on underperformance
Global/regional diversity
Users in different geographies show widely varied ARPPU and payment behaviors; 2024 industry data indicate North America drives the largest share of dating app revenue while emerging markets record materially lower ARPPU and higher promo reliance. Emerging-market users are more price-sensitive and promo-driven, reducing buyer switching costs. Cultural norms shape feature adoption and willingness to pay; poor localization increases buyer leverage.
- Regional ARPPU gap: North America vs emerging markets
- Promo-driven demand in 2024
- Culture affects monetization
- Localization quality alters bargaining power
Low switching costs and thin cohorts make small conversion shifts and CPMs decisive
Low switching costs and feature parity raise user price sensitivity; 2024 conversion rates ran ~3–7%, making small shifts material. Bumble's ~30M MAU in 2024 cushions bargaining but thin cohorts increase leverage. Advertisers demand brand safety and measurement, exerting strong CPM pressure.
| Metric | 2024 |
|---|---|
| MAU | ~30M |
| Conversion rate | 3–7% |
| NA revenue share | ~45% |
Preview Before You Purchase
Bumble Porter's Five Forces Analysis
This preview shows the exact Porter’s Five Forces analysis of Bumble you'll receive after purchase—complete, professionally formatted, and ready to download. It covers threat of new entrants, bargaining power of suppliers and buyers, rivalry among competitors, and threat of substitutes with tailored insights and scoring. No placeholders or samples—this is the final deliverable available instantly.

Go Beyond the Preview—Access the Full Strategic Report
Bumble faces intense network-driven competition, rising substitute platforms, and shifting buyer preferences that shape its pricing and growth potential; this snapshot highlights core pressures but skips force-by-force ratings. The full Porter's Five Forces Analysis breaks down supplier influence, entrant threats, and competitive rivalry with data-driven visuals and strategic implications. Unlock the complete report to inform investment or strategy with consultant-grade insights ready for presentation.
Suppliers Bargaining Power
App store gatekeepers
Apple and Google, which together control over 90% of mobile app distribution, dictate fees (commonly 30% or reduced 15% rates for eligible subscriptions), in-app payment rules, and platform policies that shape feature design. Policy shifts—such as changes to tracking or payment rules—can directly alter monetization and pricing flexibility. A suspension or dispute with either store would materially curtail Bumble’s reach. Negotiating leverage is constrained by this duopoly.
Cloud and infrastructure
Dependence on major cloud vendors concentrates risk: AWS, Microsoft Azure and Google Cloud held about 66% of the cloud infra market in 2024 (Synergy Research), so price hikes or outages can squeeze Bumble’s margins and uptime. Multi-cloud, edge and CDN strategies (Cloudflare/Akamai) reduce but do not remove exposure. Large scale commitments can win double-digit discounts yet increase vendor lock-in.
Payment processors
Payment processors and anti-fraud tools materially affect authorization rates, chargebacks and Bumble’s net take-rate, with processors’ fees typically ranging 1.3–3.5% plus $0.10–$0.30 per transaction and chargeback exposure usually kept under 1%. Regional partners are required for local methods, adding switching friction and tens of extra integrations. Fee structures and regulatory compliance raise pricing, and consolidation among processors increases supplier power.
Safety, trust, and data tools
Third-party identity verification, photo screening, AI moderation and analytics vendors are core to Bumble’s safety stack; vendor accuracy directly affects user retention and legal exposure, with the identity-verification market valued at about $15.6B in 2024. Certifications (SOC 2, GDPR) and specialized models raise switching costs, and in-house build-outs can cut costs but not fully eliminate vendor dependency.
Talent and ad inventory
Specialized engineering, ML, and trust & safety talent remain scarce—LinkedIn 2024 Emerging Jobs Report showed AI and trust roles grew ~35% YoY—giving labor markets meaningful bargaining power; employer brand and retention programs cut churn but do not eliminate premium wages. Advertising inventory concentration on large platforms (global digital ad spend >$500B in 2024) tightens UA pacing, while social auction dynamics can spike CAC as programmatic CPMs rose ~15% YoY in 2024.
- Talent scarcity: AI/trust roles +35% (LinkedIn 2024)
- Ad inventory: global digital ad spend >$500B (2024)
- Auction impact: programmatic CPMs ~+15% YoY (2024)
App stores >90% control; cloud 66% share; payments, ID vendors and +35% AI hiring squeeze margins
Apple and Google control >90% of app distribution, setting fees and rules that limit Bumble’s pricing flexibility and pose material delisting risk. Cloud concentration (66% market share) and payment processor fees (1.3–3.5% + $0.10–$0.30) squeeze margins. ID/moderation vendors ($15.6B market) and scarce AI/trust talent (+35% YoY) raise switching costs and wage pressure.
| Supplier | 2024 metric |
|---|---|
| App stores | >90% share |
| Cloud | 66% share (Synergy) |
| Payments | 1.3–3.5% + $0.10–$0.30 |
| ID/moderation | $15.6B market |
| Talent | +35% AI/trust roles |
What is included in the product
Detailed Word Document
Tailored Porter’s Five Forces for Bumble uncovering key competitive drivers, buyer/supplier influence, entry barriers and substitute threats, with strategic insights on market positioning and disruption risks.
Customizable Excel Spreadsheet
Clear, one-sheet Porter's Five Forces for Bumble that highlights competitive pain points and relief strategies in a single view—customize force intensities, swap in current data, and export a radar chart ready for decks to speed strategic decisions.
Customers Bargaining Power
Low switching costs
As of 2024, low switching costs let users multi-home across dating apps with minimal friction, increasing price sensitivity and forcing frequent promos and free trials to win users. Churn remains common when match quality or UX disappoints, and feature parity across rivals erodes differentiation. Conversion and retention increasingly rely on short-term offers and personalization.
Freemium expectations
Freemium expectations concentrate monetization in a small premium cohort, and buyers can downgrade quickly if benefits are unclear. Paywalls must show immediate, tangible utility; industry conversion rates in 2024 were roughly 3–7%, so small shifts hit revenue materially. Pricing tests risk backlash amplified on social media, driving rapid churn and negative visibility.
Network effects nuance
Large active pools reduce buyer power by improving match quality; Bumble's ecosystem supported roughly 30 million monthly active users in 2024, which cushions individual bargaining. Local density and segment fit drive perceived value more than global scale, so thin cohorts still give users leverage. If liquidity wanes in a cohort, users exert power by exiting or reducing spend. Cross-brand portfolios (dating and networking verticals) help rebalance liquidity across cohorts and geographies.
Advertisers and partners
Advertisers and partners exert moderate to high bargaining power over Bumble: while ads are smaller than subscription revenue, advertisers insist on brand-safe environments and greater measurement transparency after recent privacy-driven tracking changes. Large buyers can negotiate rates and placements, and ad budgets reallocate quickly if campaigns underperform, pressuring CPMs and inventory control.
- Brand safety: high
- Transparency demands: elevated post-privacy
- Large advertisers: strong negotiating leverage
- Spend shifts: rapid on underperformance
Global/regional diversity
Users in different geographies show widely varied ARPPU and payment behaviors; 2024 industry data indicate North America drives the largest share of dating app revenue while emerging markets record materially lower ARPPU and higher promo reliance. Emerging-market users are more price-sensitive and promo-driven, reducing buyer switching costs. Cultural norms shape feature adoption and willingness to pay; poor localization increases buyer leverage.
- Regional ARPPU gap: North America vs emerging markets
- Promo-driven demand in 2024
- Culture affects monetization
- Localization quality alters bargaining power
Low switching costs and thin cohorts make small conversion shifts and CPMs decisive
Low switching costs and feature parity raise user price sensitivity; 2024 conversion rates ran ~3–7%, making small shifts material. Bumble's ~30M MAU in 2024 cushions bargaining but thin cohorts increase leverage. Advertisers demand brand safety and measurement, exerting strong CPM pressure.
| Metric | 2024 |
|---|---|
| MAU | ~30M |
| Conversion rate | 3–7% |
| NA revenue share | ~45% |
Preview Before You Purchase
Bumble Porter's Five Forces Analysis
This preview shows the exact Porter’s Five Forces analysis of Bumble you'll receive after purchase—complete, professionally formatted, and ready to download. It covers threat of new entrants, bargaining power of suppliers and buyers, rivalry among competitors, and threat of substitutes with tailored insights and scoring. No placeholders or samples—this is the final deliverable available instantly.
Original: $10.00
-65%$10.00
$3.50Description
Go Beyond the Preview—Access the Full Strategic Report
Bumble faces intense network-driven competition, rising substitute platforms, and shifting buyer preferences that shape its pricing and growth potential; this snapshot highlights core pressures but skips force-by-force ratings. The full Porter's Five Forces Analysis breaks down supplier influence, entrant threats, and competitive rivalry with data-driven visuals and strategic implications. Unlock the complete report to inform investment or strategy with consultant-grade insights ready for presentation.
Suppliers Bargaining Power
App store gatekeepers
Apple and Google, which together control over 90% of mobile app distribution, dictate fees (commonly 30% or reduced 15% rates for eligible subscriptions), in-app payment rules, and platform policies that shape feature design. Policy shifts—such as changes to tracking or payment rules—can directly alter monetization and pricing flexibility. A suspension or dispute with either store would materially curtail Bumble’s reach. Negotiating leverage is constrained by this duopoly.
Cloud and infrastructure
Dependence on major cloud vendors concentrates risk: AWS, Microsoft Azure and Google Cloud held about 66% of the cloud infra market in 2024 (Synergy Research), so price hikes or outages can squeeze Bumble’s margins and uptime. Multi-cloud, edge and CDN strategies (Cloudflare/Akamai) reduce but do not remove exposure. Large scale commitments can win double-digit discounts yet increase vendor lock-in.
Payment processors
Payment processors and anti-fraud tools materially affect authorization rates, chargebacks and Bumble’s net take-rate, with processors’ fees typically ranging 1.3–3.5% plus $0.10–$0.30 per transaction and chargeback exposure usually kept under 1%. Regional partners are required for local methods, adding switching friction and tens of extra integrations. Fee structures and regulatory compliance raise pricing, and consolidation among processors increases supplier power.
Safety, trust, and data tools
Third-party identity verification, photo screening, AI moderation and analytics vendors are core to Bumble’s safety stack; vendor accuracy directly affects user retention and legal exposure, with the identity-verification market valued at about $15.6B in 2024. Certifications (SOC 2, GDPR) and specialized models raise switching costs, and in-house build-outs can cut costs but not fully eliminate vendor dependency.
Talent and ad inventory
Specialized engineering, ML, and trust & safety talent remain scarce—LinkedIn 2024 Emerging Jobs Report showed AI and trust roles grew ~35% YoY—giving labor markets meaningful bargaining power; employer brand and retention programs cut churn but do not eliminate premium wages. Advertising inventory concentration on large platforms (global digital ad spend >$500B in 2024) tightens UA pacing, while social auction dynamics can spike CAC as programmatic CPMs rose ~15% YoY in 2024.
- Talent scarcity: AI/trust roles +35% (LinkedIn 2024)
- Ad inventory: global digital ad spend >$500B (2024)
- Auction impact: programmatic CPMs ~+15% YoY (2024)
App stores >90% control; cloud 66% share; payments, ID vendors and +35% AI hiring squeeze margins
Apple and Google control >90% of app distribution, setting fees and rules that limit Bumble’s pricing flexibility and pose material delisting risk. Cloud concentration (66% market share) and payment processor fees (1.3–3.5% + $0.10–$0.30) squeeze margins. ID/moderation vendors ($15.6B market) and scarce AI/trust talent (+35% YoY) raise switching costs and wage pressure.
| Supplier | 2024 metric |
|---|---|
| App stores | >90% share |
| Cloud | 66% share (Synergy) |
| Payments | 1.3–3.5% + $0.10–$0.30 |
| ID/moderation | $15.6B market |
| Talent | +35% AI/trust roles |
What is included in the product
Detailed Word Document
Tailored Porter’s Five Forces for Bumble uncovering key competitive drivers, buyer/supplier influence, entry barriers and substitute threats, with strategic insights on market positioning and disruption risks.
Customizable Excel Spreadsheet
Clear, one-sheet Porter's Five Forces for Bumble that highlights competitive pain points and relief strategies in a single view—customize force intensities, swap in current data, and export a radar chart ready for decks to speed strategic decisions.
Customers Bargaining Power
Low switching costs
As of 2024, low switching costs let users multi-home across dating apps with minimal friction, increasing price sensitivity and forcing frequent promos and free trials to win users. Churn remains common when match quality or UX disappoints, and feature parity across rivals erodes differentiation. Conversion and retention increasingly rely on short-term offers and personalization.
Freemium expectations
Freemium expectations concentrate monetization in a small premium cohort, and buyers can downgrade quickly if benefits are unclear. Paywalls must show immediate, tangible utility; industry conversion rates in 2024 were roughly 3–7%, so small shifts hit revenue materially. Pricing tests risk backlash amplified on social media, driving rapid churn and negative visibility.
Network effects nuance
Large active pools reduce buyer power by improving match quality; Bumble's ecosystem supported roughly 30 million monthly active users in 2024, which cushions individual bargaining. Local density and segment fit drive perceived value more than global scale, so thin cohorts still give users leverage. If liquidity wanes in a cohort, users exert power by exiting or reducing spend. Cross-brand portfolios (dating and networking verticals) help rebalance liquidity across cohorts and geographies.
Advertisers and partners
Advertisers and partners exert moderate to high bargaining power over Bumble: while ads are smaller than subscription revenue, advertisers insist on brand-safe environments and greater measurement transparency after recent privacy-driven tracking changes. Large buyers can negotiate rates and placements, and ad budgets reallocate quickly if campaigns underperform, pressuring CPMs and inventory control.
- Brand safety: high
- Transparency demands: elevated post-privacy
- Large advertisers: strong negotiating leverage
- Spend shifts: rapid on underperformance
Global/regional diversity
Users in different geographies show widely varied ARPPU and payment behaviors; 2024 industry data indicate North America drives the largest share of dating app revenue while emerging markets record materially lower ARPPU and higher promo reliance. Emerging-market users are more price-sensitive and promo-driven, reducing buyer switching costs. Cultural norms shape feature adoption and willingness to pay; poor localization increases buyer leverage.
- Regional ARPPU gap: North America vs emerging markets
- Promo-driven demand in 2024
- Culture affects monetization
- Localization quality alters bargaining power
Low switching costs and thin cohorts make small conversion shifts and CPMs decisive
Low switching costs and feature parity raise user price sensitivity; 2024 conversion rates ran ~3–7%, making small shifts material. Bumble's ~30M MAU in 2024 cushions bargaining but thin cohorts increase leverage. Advertisers demand brand safety and measurement, exerting strong CPM pressure.
| Metric | 2024 |
|---|---|
| MAU | ~30M |
| Conversion rate | 3–7% |
| NA revenue share | ~45% |
Preview Before You Purchase
Bumble Porter's Five Forces Analysis
This preview shows the exact Porter’s Five Forces analysis of Bumble you'll receive after purchase—complete, professionally formatted, and ready to download. It covers threat of new entrants, bargaining power of suppliers and buyers, rivalry among competitors, and threat of substitutes with tailored insights and scoring. No placeholders or samples—this is the final deliverable available instantly.











