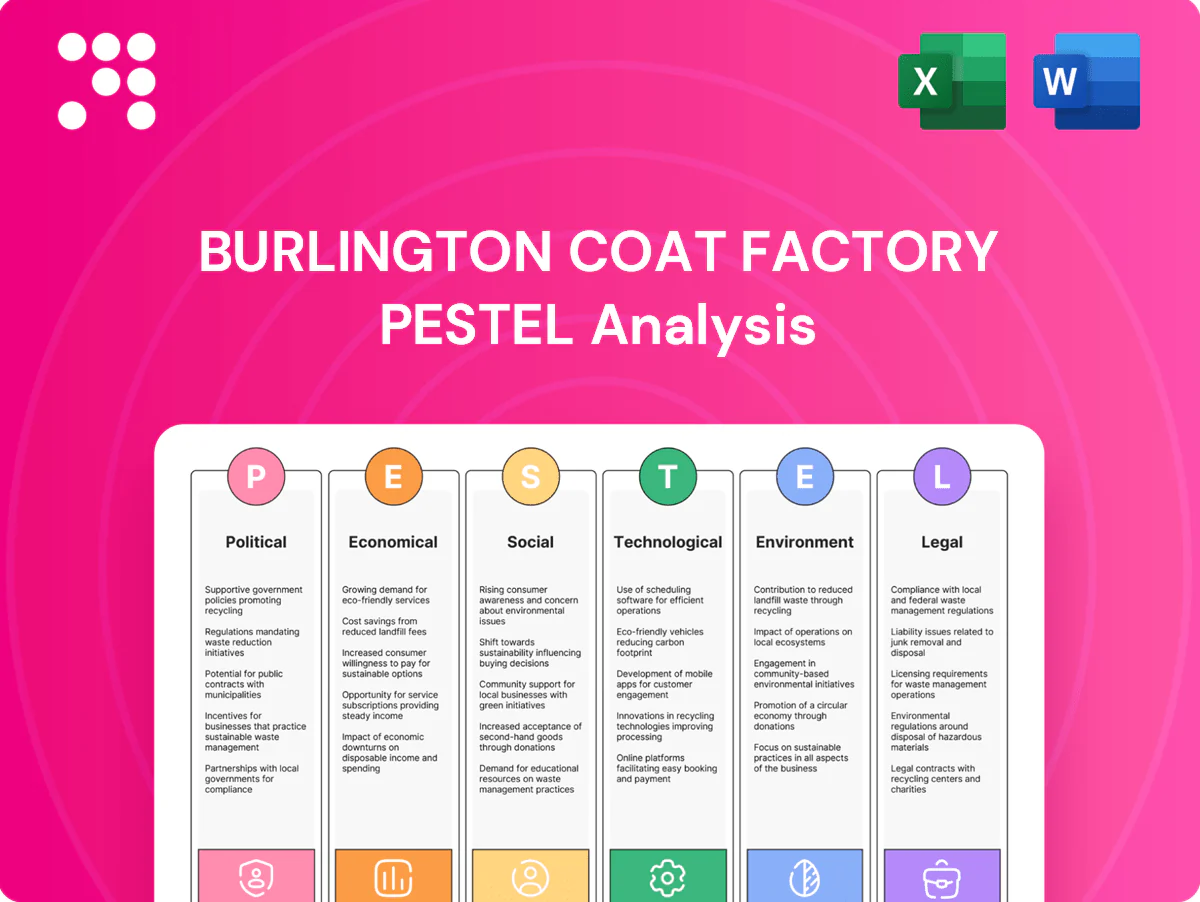
Burlington Coat Factory PESTLE Analysis

Your Shortcut to Market Insight Starts Here
Uncover how political shifts, economic pressures, social trends, and technological advances are reshaping Burlington Coat Factory’s strategy and risks. Our concise PESTLE highlights critical external drivers and their implications for growth and resilience. Ready-made and actionable, the full analysis delivers the granular insights you need—download the complete report now.
Political factors

Trade policy and tariffs
Many of Burlington Stores’ apparel and home-goods purchases are imported, so shifts in trade policy—notably Section 301 China tariffs of up to 25%—directly raise COGS and limit pricing flexibility. New country-of-origin rules or tariff changes can re-route sourcing and disrupt inventory flow across the retailer’s 1,000+ stores. Proactive vendor diversification and nearshoring reduce exposure but tend to compress off-price margins.
Minimum wage and labor policy
State and local minimums — federal floor unchanged at $7.25 while California is $15.50, New York $15.00 and Seattle about $18.69 — push store and DC payroll, squeezing Burlington’s low-price model and raising operating costs by roughly 8–10% in comparable retail peers. Tip, scheduling and overtime rules reduce seasonal labor flexibility and raise peak staffing costs. Scenario planning and investments in labor-productivity tech (scheduling AI, handheld RMAs) can offset wage inflation.

Permitting, zoning, and local incentives
Store openings for Burlington depend on municipal approvals, local incentives and redevelopment policies; the chain operated over 1,000 stores nationwide as of 2024, so permitting timelines materially affect growth pace. Favorable zoning and incentive packages accelerate off-mall expansion into value centers, while restrictive ordinances and historic-district rules can delay projects—permits commonly add 6–12 months to development timelines. Site selection must weigh these political timelines against market potential and lease economics.

Transportation infrastructure and fuel policy
Public investment under the 2021 Infrastructure Investment and Jobs Act, including roughly $110 billion for roads and bridges, and targeted port/rail grants, directly affects freight reliability and Burlington Coat Factory lead times; weaker networks raise late-season delivery risk. Federal fuel tax remains 18.4 cents/gal, and tightening emissions rules increase carrier costs that are typically passed to retailers.
- IIJA $110B roads/bridges
- Fed gas tax 18.4¢/gal
- Stronger infrastructure lowers markdown risk
Geopolitical supply chain risk
Geopolitical supply chain risk: trade disputes, sanctions, or regional instability can abruptly disrupt opportunistic buying for Burlington, with over 50% of U.S. apparel imports sourced from Asia (2023) increasing exposure to tariff and port shocks.
Political shocks can surge closeout availability but complicate air/sea logistics and lead times; Burlington’s multi-country vendor network and flexible PO terms preserve agility and mitigate stockouts.
- Exposure: >50% apparel imports from Asia (2023)
- Mitigation: multi-country sourcing
- Policy risk: tariffs/sanctions raise landed costs
Off-price chains face >50% Asian imports, tariffs to 25% and ~8–10% higher payroll
Burlington’s heavy import mix (over 50% apparel from Asia in 2023) and exposure to Section 301 tariffs (up to 25%) raise landed costs and compress off-price margins. State/local minimum wages (CA $15.50, NY $15.00, Seattle $18.69) and labor rules increase payroll ~8–10% versus peers. Infrastructure funding (IIJA ~$110B) and federal gas tax 18.4¢/gal affect freight reliability and markdown risk.
| Metric | Value |
|---|---|
| Stores (2024) | 1,000+ |
| Apparel imports from Asia (2023) | >50% |
| Section 301 tariffs | Up to 25% |
| IIJA roads/bridges | $110B |
| Fed gas tax | 18.4¢/gal |
What is included in the product
 Detailed Word Document
Explores how Political, Economic, Social, Technological, Environmental and Legal forces uniquely affect Burlington Coat Factory (Burlington Stores), with data-backed trends and sector-specific examples to identify risks, opportunities and strategic responses for executives, investors and consultants.

 Customizable Excel Spreadsheet
A concise, visually segmented Burlington Coat Factory PESTLE summary that distills external risks and opportunities for quick reference, editable for local context and ready to drop into presentations or share across teams.
Economic factors

Consumer spending and confidence
Off-price model shields Burlington as budgets tighten; Burlington reported net sales of $9.01 billion for fiscal 2024, reflecting resilient demand for discounted apparel and home goods. Severe downturns still compress store traffic and AURs, with U.S. Consumer Confidence around 102 in mid-2024 driving smaller baskets and a shift to essentials. Agile promotions and localized assortments let Burlington capture value-seeking demand and protect margins.
Inflation and input costs
Merchandise, freight, and wage inflation compress Burlingtons gross margin as US CPI averaged about 3.4% in 2024 and average hourly earnings rose roughly 4% year-over-year, raising bought-in costs and store labor expense. Elevated inflation has increased branded overstock in market, enabling Burlington to procure discounted freight-forward and clearance inventory more aggressively. Consequently, price architecture and packaway timing are margin-critical tactical levers.

Interest rates and real estate
Higher policy rates (federal funds ~5.25–5.50% in 2024) raise borrowing, occupancy and buildout costs, slowing retail expansion and raising cap-ex hurdles for Burlington. Softer US retail markets (national retail vacancy ~5.2% in 2024, CBRE) create attractive power-center lease pricing. Burlington, with roughly 1,000 stores, emphasizes capital discipline and low-double-digit net openings tied to payback thresholds.

Unemployment and labor availability
- Labor tightness: wage pressure, higher turnover
- Unemployment ~3.7% (mid‑2025) expands candidates
- Wage growth ~4% YoY increases payroll costs
- Need flexible, region-specific staffing models
FX and global sourcing economics
Currency swings, with the US dollar index near 104–105 in mid‑2025, alter vendor pricing and landed costs across Asia and Europe, meaning Burlington's ~1,000‑store sourcing footprint faces variable import costs; a strong dollar has lowered reported import expenses but complicated vendor renegotiations and local currency pass‑through. Hedging programs and a diversified country mix have been used to reduce gross‑margin volatility against FX shocks while protecting roughly $9.7bn annual net sales.
- FX index: DXY ~104–105 (mid‑2025)
- Scale: ~1,000 stores
- Sales reference: ~$9.7bn annual net sales
- Mitigation: hedging + multi‑country sourcing stabilizes margins
Off-price chains face >50% Asian imports, tariffs to 25% and ~8–10% higher payroll
Off-price positioning kept Burlington resilient with fiscal 2024 net sales of $9.01bn while consumers shifted to essentials amid US Consumer Confidence ~102 (mid‑2024). Inflation (CPI ~3.4% in 2024) and wage growth (~4% YoY) compressed margins but increased discounted inventory supply. Higher policy rates (fed funds 5.25–5.50% in 2024) raised capex/lease costs even as retail vacancy (~5.2% 2024) enabled cheaper power‑center leasing.
| Metric | Value |
|---|---|
| Fiscal 2024 sales | $9.01bn |
| Store count | ~1,000 |
| US CPI 2024 | 3.4% |
| Fed funds 2024 | 5.25–5.50% |
| Unemployment mid‑2025 | 3.7% |
| DXY mid‑2025 | 104–105 |
Full Version Awaits
Burlington Coat Factory PESTLE Analysis
The Burlington Coat Factory PESTLE Analysis below is the exact, final document you’ll receive after purchase—fully formatted and ready to use. It outlines political, economic, social, technological, legal, and environmental factors specific to Burlington, with clear insights and actionable implications. No placeholders or teasers—this is the real file you’ll download immediately after checkout.

Your Shortcut to Market Insight Starts Here
Uncover how political shifts, economic pressures, social trends, and technological advances are reshaping Burlington Coat Factory’s strategy and risks. Our concise PESTLE highlights critical external drivers and their implications for growth and resilience. Ready-made and actionable, the full analysis delivers the granular insights you need—download the complete report now.
Political factors
Trade policy and tariffs
Many of Burlington Stores’ apparel and home-goods purchases are imported, so shifts in trade policy—notably Section 301 China tariffs of up to 25%—directly raise COGS and limit pricing flexibility. New country-of-origin rules or tariff changes can re-route sourcing and disrupt inventory flow across the retailer’s 1,000+ stores. Proactive vendor diversification and nearshoring reduce exposure but tend to compress off-price margins.
Minimum wage and labor policy
State and local minimums — federal floor unchanged at $7.25 while California is $15.50, New York $15.00 and Seattle about $18.69 — push store and DC payroll, squeezing Burlington’s low-price model and raising operating costs by roughly 8–10% in comparable retail peers. Tip, scheduling and overtime rules reduce seasonal labor flexibility and raise peak staffing costs. Scenario planning and investments in labor-productivity tech (scheduling AI, handheld RMAs) can offset wage inflation.
Permitting, zoning, and local incentives
Store openings for Burlington depend on municipal approvals, local incentives and redevelopment policies; the chain operated over 1,000 stores nationwide as of 2024, so permitting timelines materially affect growth pace. Favorable zoning and incentive packages accelerate off-mall expansion into value centers, while restrictive ordinances and historic-district rules can delay projects—permits commonly add 6–12 months to development timelines. Site selection must weigh these political timelines against market potential and lease economics.
Transportation infrastructure and fuel policy
Public investment under the 2021 Infrastructure Investment and Jobs Act, including roughly $110 billion for roads and bridges, and targeted port/rail grants, directly affects freight reliability and Burlington Coat Factory lead times; weaker networks raise late-season delivery risk. Federal fuel tax remains 18.4 cents/gal, and tightening emissions rules increase carrier costs that are typically passed to retailers.
- IIJA $110B roads/bridges
- Fed gas tax 18.4¢/gal
- Stronger infrastructure lowers markdown risk
Geopolitical supply chain risk
Geopolitical supply chain risk: trade disputes, sanctions, or regional instability can abruptly disrupt opportunistic buying for Burlington, with over 50% of U.S. apparel imports sourced from Asia (2023) increasing exposure to tariff and port shocks.
Political shocks can surge closeout availability but complicate air/sea logistics and lead times; Burlington’s multi-country vendor network and flexible PO terms preserve agility and mitigate stockouts.
- Exposure: >50% apparel imports from Asia (2023)
- Mitigation: multi-country sourcing
- Policy risk: tariffs/sanctions raise landed costs
Off-price chains face >50% Asian imports, tariffs to 25% and ~8–10% higher payroll
Burlington’s heavy import mix (over 50% apparel from Asia in 2023) and exposure to Section 301 tariffs (up to 25%) raise landed costs and compress off-price margins. State/local minimum wages (CA $15.50, NY $15.00, Seattle $18.69) and labor rules increase payroll ~8–10% versus peers. Infrastructure funding (IIJA ~$110B) and federal gas tax 18.4¢/gal affect freight reliability and markdown risk.
| Metric | Value |
|---|---|
| Stores (2024) | 1,000+ |
| Apparel imports from Asia (2023) | >50% |
| Section 301 tariffs | Up to 25% |
| IIJA roads/bridges | $110B |
| Fed gas tax | 18.4¢/gal |
What is included in the product
Detailed Word Document
Explores how Political, Economic, Social, Technological, Environmental and Legal forces uniquely affect Burlington Coat Factory (Burlington Stores), with data-backed trends and sector-specific examples to identify risks, opportunities and strategic responses for executives, investors and consultants.
Customizable Excel Spreadsheet
A concise, visually segmented Burlington Coat Factory PESTLE summary that distills external risks and opportunities for quick reference, editable for local context and ready to drop into presentations or share across teams.
Economic factors
Consumer spending and confidence
Off-price model shields Burlington as budgets tighten; Burlington reported net sales of $9.01 billion for fiscal 2024, reflecting resilient demand for discounted apparel and home goods. Severe downturns still compress store traffic and AURs, with U.S. Consumer Confidence around 102 in mid-2024 driving smaller baskets and a shift to essentials. Agile promotions and localized assortments let Burlington capture value-seeking demand and protect margins.
Inflation and input costs
Merchandise, freight, and wage inflation compress Burlingtons gross margin as US CPI averaged about 3.4% in 2024 and average hourly earnings rose roughly 4% year-over-year, raising bought-in costs and store labor expense. Elevated inflation has increased branded overstock in market, enabling Burlington to procure discounted freight-forward and clearance inventory more aggressively. Consequently, price architecture and packaway timing are margin-critical tactical levers.
Interest rates and real estate
Higher policy rates (federal funds ~5.25–5.50% in 2024) raise borrowing, occupancy and buildout costs, slowing retail expansion and raising cap-ex hurdles for Burlington. Softer US retail markets (national retail vacancy ~5.2% in 2024, CBRE) create attractive power-center lease pricing. Burlington, with roughly 1,000 stores, emphasizes capital discipline and low-double-digit net openings tied to payback thresholds.
Unemployment and labor availability
- Labor tightness: wage pressure, higher turnover
- Unemployment ~3.7% (mid‑2025) expands candidates
- Wage growth ~4% YoY increases payroll costs
- Need flexible, region-specific staffing models
FX and global sourcing economics
Currency swings, with the US dollar index near 104–105 in mid‑2025, alter vendor pricing and landed costs across Asia and Europe, meaning Burlington's ~1,000‑store sourcing footprint faces variable import costs; a strong dollar has lowered reported import expenses but complicated vendor renegotiations and local currency pass‑through. Hedging programs and a diversified country mix have been used to reduce gross‑margin volatility against FX shocks while protecting roughly $9.7bn annual net sales.
- FX index: DXY ~104–105 (mid‑2025)
- Scale: ~1,000 stores
- Sales reference: ~$9.7bn annual net sales
- Mitigation: hedging + multi‑country sourcing stabilizes margins
Off-price chains face >50% Asian imports, tariffs to 25% and ~8–10% higher payroll
Off-price positioning kept Burlington resilient with fiscal 2024 net sales of $9.01bn while consumers shifted to essentials amid US Consumer Confidence ~102 (mid‑2024). Inflation (CPI ~3.4% in 2024) and wage growth (~4% YoY) compressed margins but increased discounted inventory supply. Higher policy rates (fed funds 5.25–5.50% in 2024) raised capex/lease costs even as retail vacancy (~5.2% 2024) enabled cheaper power‑center leasing.
| Metric | Value |
|---|---|
| Fiscal 2024 sales | $9.01bn |
| Store count | ~1,000 |
| US CPI 2024 | 3.4% |
| Fed funds 2024 | 5.25–5.50% |
| Unemployment mid‑2025 | 3.7% |
| DXY mid‑2025 | 104–105 |
Full Version Awaits
Burlington Coat Factory PESTLE Analysis
The Burlington Coat Factory PESTLE Analysis below is the exact, final document you’ll receive after purchase—fully formatted and ready to use. It outlines political, economic, social, technological, legal, and environmental factors specific to Burlington, with clear insights and actionable implications. No placeholders or teasers—this is the real file you’ll download immediately after checkout.
Original: $10.00
-65%$10.00
$3.50Description
Your Shortcut to Market Insight Starts Here
Uncover how political shifts, economic pressures, social trends, and technological advances are reshaping Burlington Coat Factory’s strategy and risks. Our concise PESTLE highlights critical external drivers and their implications for growth and resilience. Ready-made and actionable, the full analysis delivers the granular insights you need—download the complete report now.
Political factors
Trade policy and tariffs
Many of Burlington Stores’ apparel and home-goods purchases are imported, so shifts in trade policy—notably Section 301 China tariffs of up to 25%—directly raise COGS and limit pricing flexibility. New country-of-origin rules or tariff changes can re-route sourcing and disrupt inventory flow across the retailer’s 1,000+ stores. Proactive vendor diversification and nearshoring reduce exposure but tend to compress off-price margins.
Minimum wage and labor policy
State and local minimums — federal floor unchanged at $7.25 while California is $15.50, New York $15.00 and Seattle about $18.69 — push store and DC payroll, squeezing Burlington’s low-price model and raising operating costs by roughly 8–10% in comparable retail peers. Tip, scheduling and overtime rules reduce seasonal labor flexibility and raise peak staffing costs. Scenario planning and investments in labor-productivity tech (scheduling AI, handheld RMAs) can offset wage inflation.
Permitting, zoning, and local incentives
Store openings for Burlington depend on municipal approvals, local incentives and redevelopment policies; the chain operated over 1,000 stores nationwide as of 2024, so permitting timelines materially affect growth pace. Favorable zoning and incentive packages accelerate off-mall expansion into value centers, while restrictive ordinances and historic-district rules can delay projects—permits commonly add 6–12 months to development timelines. Site selection must weigh these political timelines against market potential and lease economics.
Transportation infrastructure and fuel policy
Public investment under the 2021 Infrastructure Investment and Jobs Act, including roughly $110 billion for roads and bridges, and targeted port/rail grants, directly affects freight reliability and Burlington Coat Factory lead times; weaker networks raise late-season delivery risk. Federal fuel tax remains 18.4 cents/gal, and tightening emissions rules increase carrier costs that are typically passed to retailers.
- IIJA $110B roads/bridges
- Fed gas tax 18.4¢/gal
- Stronger infrastructure lowers markdown risk
Geopolitical supply chain risk
Geopolitical supply chain risk: trade disputes, sanctions, or regional instability can abruptly disrupt opportunistic buying for Burlington, with over 50% of U.S. apparel imports sourced from Asia (2023) increasing exposure to tariff and port shocks.
Political shocks can surge closeout availability but complicate air/sea logistics and lead times; Burlington’s multi-country vendor network and flexible PO terms preserve agility and mitigate stockouts.
- Exposure: >50% apparel imports from Asia (2023)
- Mitigation: multi-country sourcing
- Policy risk: tariffs/sanctions raise landed costs
Off-price chains face >50% Asian imports, tariffs to 25% and ~8–10% higher payroll
Burlington’s heavy import mix (over 50% apparel from Asia in 2023) and exposure to Section 301 tariffs (up to 25%) raise landed costs and compress off-price margins. State/local minimum wages (CA $15.50, NY $15.00, Seattle $18.69) and labor rules increase payroll ~8–10% versus peers. Infrastructure funding (IIJA ~$110B) and federal gas tax 18.4¢/gal affect freight reliability and markdown risk.
| Metric | Value |
|---|---|
| Stores (2024) | 1,000+ |
| Apparel imports from Asia (2023) | >50% |
| Section 301 tariffs | Up to 25% |
| IIJA roads/bridges | $110B |
| Fed gas tax | 18.4¢/gal |
What is included in the product
Detailed Word Document
Explores how Political, Economic, Social, Technological, Environmental and Legal forces uniquely affect Burlington Coat Factory (Burlington Stores), with data-backed trends and sector-specific examples to identify risks, opportunities and strategic responses for executives, investors and consultants.
Customizable Excel Spreadsheet
A concise, visually segmented Burlington Coat Factory PESTLE summary that distills external risks and opportunities for quick reference, editable for local context and ready to drop into presentations or share across teams.
Economic factors
Consumer spending and confidence
Off-price model shields Burlington as budgets tighten; Burlington reported net sales of $9.01 billion for fiscal 2024, reflecting resilient demand for discounted apparel and home goods. Severe downturns still compress store traffic and AURs, with U.S. Consumer Confidence around 102 in mid-2024 driving smaller baskets and a shift to essentials. Agile promotions and localized assortments let Burlington capture value-seeking demand and protect margins.
Inflation and input costs
Merchandise, freight, and wage inflation compress Burlingtons gross margin as US CPI averaged about 3.4% in 2024 and average hourly earnings rose roughly 4% year-over-year, raising bought-in costs and store labor expense. Elevated inflation has increased branded overstock in market, enabling Burlington to procure discounted freight-forward and clearance inventory more aggressively. Consequently, price architecture and packaway timing are margin-critical tactical levers.
Interest rates and real estate
Higher policy rates (federal funds ~5.25–5.50% in 2024) raise borrowing, occupancy and buildout costs, slowing retail expansion and raising cap-ex hurdles for Burlington. Softer US retail markets (national retail vacancy ~5.2% in 2024, CBRE) create attractive power-center lease pricing. Burlington, with roughly 1,000 stores, emphasizes capital discipline and low-double-digit net openings tied to payback thresholds.
Unemployment and labor availability
- Labor tightness: wage pressure, higher turnover
- Unemployment ~3.7% (mid‑2025) expands candidates
- Wage growth ~4% YoY increases payroll costs
- Need flexible, region-specific staffing models
FX and global sourcing economics
Currency swings, with the US dollar index near 104–105 in mid‑2025, alter vendor pricing and landed costs across Asia and Europe, meaning Burlington's ~1,000‑store sourcing footprint faces variable import costs; a strong dollar has lowered reported import expenses but complicated vendor renegotiations and local currency pass‑through. Hedging programs and a diversified country mix have been used to reduce gross‑margin volatility against FX shocks while protecting roughly $9.7bn annual net sales.
- FX index: DXY ~104–105 (mid‑2025)
- Scale: ~1,000 stores
- Sales reference: ~$9.7bn annual net sales
- Mitigation: hedging + multi‑country sourcing stabilizes margins
Off-price chains face >50% Asian imports, tariffs to 25% and ~8–10% higher payroll
Off-price positioning kept Burlington resilient with fiscal 2024 net sales of $9.01bn while consumers shifted to essentials amid US Consumer Confidence ~102 (mid‑2024). Inflation (CPI ~3.4% in 2024) and wage growth (~4% YoY) compressed margins but increased discounted inventory supply. Higher policy rates (fed funds 5.25–5.50% in 2024) raised capex/lease costs even as retail vacancy (~5.2% 2024) enabled cheaper power‑center leasing.
| Metric | Value |
|---|---|
| Fiscal 2024 sales | $9.01bn |
| Store count | ~1,000 |
| US CPI 2024 | 3.4% |
| Fed funds 2024 | 5.25–5.50% |
| Unemployment mid‑2025 | 3.7% |
| DXY mid‑2025 | 104–105 |
Full Version Awaits
Burlington Coat Factory PESTLE Analysis
The Burlington Coat Factory PESTLE Analysis below is the exact, final document you’ll receive after purchase—fully formatted and ready to use. It outlines political, economic, social, technological, legal, and environmental factors specific to Burlington, with clear insights and actionable implications. No placeholders or teasers—this is the real file you’ll download immediately after checkout.











