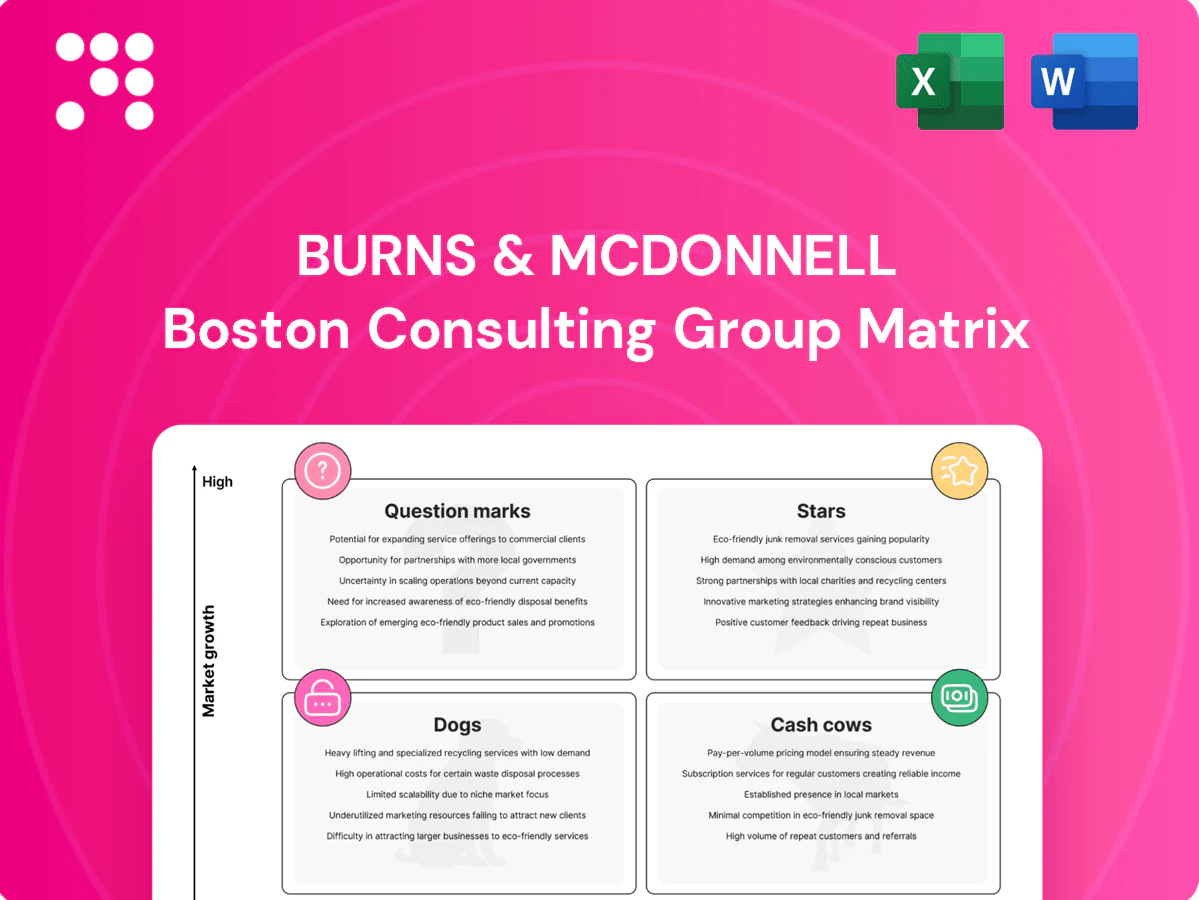
Burns & McDonnell Boston Consulting Group Matrix

Unlock Strategic Clarity
Curious where Burns & McDonnell’s portfolio really sits—Stars, Cash Cows, Dogs or Question Marks? This snapshot teases the story; the full BCG Matrix gives quadrant-by-quadrant placements, data-driven recommendations, and a clear playbook for where to invest or divest. Buy the complete report for a polished Word analysis plus an editable Excel summary you can present or act on today.
Stars

Grid modernization & T&D EPC
Utilities are directing sustained high-growth spend into grid modernization and T&D, driven by multi-year programs often sized in the low- to mid-hundreds of millions, and Burns & McDonnell, an employee-owned integrated EPC, holds a strong share on those shortlists. Large, complex programs keep the flywheel spinning and the brand visible across portfolios. Projects are cash-hungry but defensible given scale, safety record, and schedule performance. Continued investment is required to cement leadership as grids are rebuilt.
Renewables & grid-scale storage delivery
Wind, solar and batteries added about 515 GW globally in 2023 (IEA 2024) and owners increasingly seek single‑throat‑to‑choke EPC partners; Burns & McDonnell’s design‑through‑commissioning model aligns with that demand. Margins track execution risk, soaking capital but paying back through higher volume and repeat work. US interconnection queues exceed 1,000 GW (FERC 2024), so stay on the front foot with long‑lead procurement, storage integration and queue management.

Mission‑critical/data centers
Mission‑critical/data centers are a Stars sector as exploding demand and speed‑to‑market pressure—with hyperscalers driving roughly 60–70% of new build demand in 2024—create a repeat‑buyer sweet spot. Burns & McDonnell holds high share with clients valuing certainty over lowest bid; projects consume cash during ramp but secure premium, recurring pipelines. Double down on regional delivery hubs and vetted subs to keep cycle times tight and margins protected.

Aviation & transportation programs
Airports and DOT programs are mid-cycle to hot as 2024 BIL-driven spending from the 2021 Bipartisan Infrastructure Law (total package $1.2 trillion) continues; delivery is consolidating to proven primes. Burns & McDonnell’s integrated design, PM/CM and commissioning wins multi-year roles and anchors program delivery. Heavy coordination burn enforces strict cash-flow behavior—money in, money out—so maintain owner visibility and pre-position ahead of funding waves.
- 2024: BIL (2021) $1.2 trillion ongoing
- Program type: multi-year PM/CM + commissioning
- Delivery pattern: consolidation to proven primes
- Cash behavior: strict money-in/money-out
- Action: keep owner visibility; pre-position before funding waves
Environmental permitting tied to capital programs
Permitting bundled to major capital programs is accelerating, with approvals typically adding 6–36 months to schedules and programs reporting >60% win rates when design‑build is planned, favoring integrated teams and creating pull‑through into EPC work.
This approach is resource intensive but strategic: it unlocks downstream EPC value, so keep talent benches deep and maintain active regulator relationships to sustain win rates and schedule certainty.
- Permitting delay: 6–36 months
- Reported win rate with design‑build: >60%
- Strategy: preserves EPC pull‑through
- Action: deepen talent benches; warm regulator ties
Pre-position for grid programs, secure renewables long-lead, scale regional data hubs
Utilities: multi-year grid/T&D programs in low‑mid hundreds $M; maintain shortlist share. Renewables: 515 GW added in 2023 (IEA 2024); US interconnection >1,000 GW (FERC 2024). Data centers: hyperscalers ~60–70% new build demand in 2024; scale, safety and delivery win repeat premium work.
| Sector | 2024 metric | Action |
|---|---|---|
| Grid | hundreds $M programs | pre‑position, bench depth |
| Renewables | 515 GW (2023) | long‑lead procure |
| Data | 60–70% hyperscaler | regional hubs |
What is included in the product
 Detailed Word Document
BCG Matrix for Burns & McDonnell: maps Stars, Cash Cows, Question Marks and Dogs with clear investment and divestment guidance.

 Customizable Excel Spreadsheet
One-page BCG Matrix placing Burns & McDonnell units in quadrants for instant strategic clarity
Cash Cows

Utility program management (capital portfolios)
Mature, recurring, sticky utility program management yields high-share, long-standing utility clients delivering predictable fees and utilization; U.S. utility capital expenditures are forecast near 100 billion in 2024, underpinning steady demand. Growth is low-single-digit, but cash conversion is strong and enables cross-sell into design and construction. Maintain process excellence and digital dashboards; avoid over-investment to protect margins.
Water/wastewater engineering for municipalities
Water/wastewater engineering for municipalities is a cash cow: predictable annual RFP cadence from capital improvement plans and strong incumbency in service territories drive steady fees and backlog. Margins are solid—typically 12–18%—when scope control and standards/BIM libraries are enforced. Not hyper-growth but reliable staffing and revenue; invest in templates and BIM libraries to cut delivery costs 15–25% and sustain cash generation.

Commissioning & start‑up services
Commissioning & start-up services act as natural follow-ons to in-house EPC and simple add-ons for third-party EPCs, delivering high-repeat engagements with industry repeat rates above 60% in 2024 and strong cash conversion. Low BD cost per win and steady margins support robust free cash flow, while growth is modest (industry CAGR ~5% through 2028). Utilization often exceeds 85%, so standardize playbooks and keep senior leads billable to maximize yield.

Environmental compliance & monitoring (O&M phase)
Environmental compliance and monitoring during O&M is a steady cash cow: regulatory work rarely spikes but persists, supported by the EPA FY2024 enacted budget of 11.5 billion which sustains enforcement and permitting activity; sticky accounts and predictable schedules drive high-margin cash generation, enabling upsells of small studies and renewals with minimal selling cost.
- Lean teams: automate reporting to cut cost
- High retention: predictable recurring revenue
- Upsell: low-cost add-ons raise ARPU
- Bank margin: prioritize renewals and efficiency
Industrial facilities retrofit/expansion design
Industrial facilities retrofit/expansion design sits in Cash Cows for Burns & McDonnell: brownfield upgrades persist when new builds slow, and the firm’s constructability edge delivers superior schedule reliability. Growth is moderate, cash conversion strong; maintain core client rosters and avoid speculative pursuits. Burns & McDonnell is employee-owned and operates in 50+ countries with over 11,000 staff (2024).
- Tag: steady demand
- Tag: schedule reliability advantage
- Tag: moderate growth
- Tag: high cash conversion
- Tag: client retention focus
Mature utility programs = recurring fees, strong cash conversion; water margins 12–18%
Mature utility program mgmt, water/wastewater, commissioning, environmental O&M and brownfield industrial work generate high-share, recurring fees, strong cash conversion and margins (water margins 12–18%); U.S. utility capex ~100B (2024), EPA budget 11.5B (FY2024), Burns & McDonnell ~11,000 staff (2024).
| Metric | 2024 |
|---|---|
| US utility capex | $100B |
| EPA budget | $11.5B |
| Staff | ~11,000 |
| Water margins | 12–18% |
Preview = Final Product
Burns & McDonnell BCG Matrix
The Burns & McDonnell BCG Matrix you're previewing is the exact file you'll receive after purchase. No watermarks, no placeholders—just the fully formatted, analysis-ready report. It’s been crafted for clarity and immediate use in strategy sessions or investor decks. Buy once, download instantly, and start presenting—no surprises.

Unlock Strategic Clarity
Curious where Burns & McDonnell’s portfolio really sits—Stars, Cash Cows, Dogs or Question Marks? This snapshot teases the story; the full BCG Matrix gives quadrant-by-quadrant placements, data-driven recommendations, and a clear playbook for where to invest or divest. Buy the complete report for a polished Word analysis plus an editable Excel summary you can present or act on today.
Stars
Grid modernization & T&D EPC
Utilities are directing sustained high-growth spend into grid modernization and T&D, driven by multi-year programs often sized in the low- to mid-hundreds of millions, and Burns & McDonnell, an employee-owned integrated EPC, holds a strong share on those shortlists. Large, complex programs keep the flywheel spinning and the brand visible across portfolios. Projects are cash-hungry but defensible given scale, safety record, and schedule performance. Continued investment is required to cement leadership as grids are rebuilt.
Renewables & grid-scale storage delivery
Wind, solar and batteries added about 515 GW globally in 2023 (IEA 2024) and owners increasingly seek single‑throat‑to‑choke EPC partners; Burns & McDonnell’s design‑through‑commissioning model aligns with that demand. Margins track execution risk, soaking capital but paying back through higher volume and repeat work. US interconnection queues exceed 1,000 GW (FERC 2024), so stay on the front foot with long‑lead procurement, storage integration and queue management.
Mission‑critical/data centers
Mission‑critical/data centers are a Stars sector as exploding demand and speed‑to‑market pressure—with hyperscalers driving roughly 60–70% of new build demand in 2024—create a repeat‑buyer sweet spot. Burns & McDonnell holds high share with clients valuing certainty over lowest bid; projects consume cash during ramp but secure premium, recurring pipelines. Double down on regional delivery hubs and vetted subs to keep cycle times tight and margins protected.
Aviation & transportation programs
Airports and DOT programs are mid-cycle to hot as 2024 BIL-driven spending from the 2021 Bipartisan Infrastructure Law (total package $1.2 trillion) continues; delivery is consolidating to proven primes. Burns & McDonnell’s integrated design, PM/CM and commissioning wins multi-year roles and anchors program delivery. Heavy coordination burn enforces strict cash-flow behavior—money in, money out—so maintain owner visibility and pre-position ahead of funding waves.
- 2024: BIL (2021) $1.2 trillion ongoing
- Program type: multi-year PM/CM + commissioning
- Delivery pattern: consolidation to proven primes
- Cash behavior: strict money-in/money-out
- Action: keep owner visibility; pre-position before funding waves
Environmental permitting tied to capital programs
Permitting bundled to major capital programs is accelerating, with approvals typically adding 6–36 months to schedules and programs reporting >60% win rates when design‑build is planned, favoring integrated teams and creating pull‑through into EPC work.
This approach is resource intensive but strategic: it unlocks downstream EPC value, so keep talent benches deep and maintain active regulator relationships to sustain win rates and schedule certainty.
- Permitting delay: 6–36 months
- Reported win rate with design‑build: >60%
- Strategy: preserves EPC pull‑through
- Action: deepen talent benches; warm regulator ties
Pre-position for grid programs, secure renewables long-lead, scale regional data hubs
Utilities: multi-year grid/T&D programs in low‑mid hundreds $M; maintain shortlist share. Renewables: 515 GW added in 2023 (IEA 2024); US interconnection >1,000 GW (FERC 2024). Data centers: hyperscalers ~60–70% new build demand in 2024; scale, safety and delivery win repeat premium work.
| Sector | 2024 metric | Action |
|---|---|---|
| Grid | hundreds $M programs | pre‑position, bench depth |
| Renewables | 515 GW (2023) | long‑lead procure |
| Data | 60–70% hyperscaler | regional hubs |
What is included in the product
Detailed Word Document
BCG Matrix for Burns & McDonnell: maps Stars, Cash Cows, Question Marks and Dogs with clear investment and divestment guidance.
Customizable Excel Spreadsheet
One-page BCG Matrix placing Burns & McDonnell units in quadrants for instant strategic clarity
Cash Cows
Utility program management (capital portfolios)
Mature, recurring, sticky utility program management yields high-share, long-standing utility clients delivering predictable fees and utilization; U.S. utility capital expenditures are forecast near 100 billion in 2024, underpinning steady demand. Growth is low-single-digit, but cash conversion is strong and enables cross-sell into design and construction. Maintain process excellence and digital dashboards; avoid over-investment to protect margins.
Water/wastewater engineering for municipalities
Water/wastewater engineering for municipalities is a cash cow: predictable annual RFP cadence from capital improvement plans and strong incumbency in service territories drive steady fees and backlog. Margins are solid—typically 12–18%—when scope control and standards/BIM libraries are enforced. Not hyper-growth but reliable staffing and revenue; invest in templates and BIM libraries to cut delivery costs 15–25% and sustain cash generation.
Commissioning & start‑up services
Commissioning & start-up services act as natural follow-ons to in-house EPC and simple add-ons for third-party EPCs, delivering high-repeat engagements with industry repeat rates above 60% in 2024 and strong cash conversion. Low BD cost per win and steady margins support robust free cash flow, while growth is modest (industry CAGR ~5% through 2028). Utilization often exceeds 85%, so standardize playbooks and keep senior leads billable to maximize yield.
Environmental compliance & monitoring (O&M phase)
Environmental compliance and monitoring during O&M is a steady cash cow: regulatory work rarely spikes but persists, supported by the EPA FY2024 enacted budget of 11.5 billion which sustains enforcement and permitting activity; sticky accounts and predictable schedules drive high-margin cash generation, enabling upsells of small studies and renewals with minimal selling cost.
- Lean teams: automate reporting to cut cost
- High retention: predictable recurring revenue
- Upsell: low-cost add-ons raise ARPU
- Bank margin: prioritize renewals and efficiency
Industrial facilities retrofit/expansion design
Industrial facilities retrofit/expansion design sits in Cash Cows for Burns & McDonnell: brownfield upgrades persist when new builds slow, and the firm’s constructability edge delivers superior schedule reliability. Growth is moderate, cash conversion strong; maintain core client rosters and avoid speculative pursuits. Burns & McDonnell is employee-owned and operates in 50+ countries with over 11,000 staff (2024).
- Tag: steady demand
- Tag: schedule reliability advantage
- Tag: moderate growth
- Tag: high cash conversion
- Tag: client retention focus
Mature utility programs = recurring fees, strong cash conversion; water margins 12–18%
Mature utility program mgmt, water/wastewater, commissioning, environmental O&M and brownfield industrial work generate high-share, recurring fees, strong cash conversion and margins (water margins 12–18%); U.S. utility capex ~100B (2024), EPA budget 11.5B (FY2024), Burns & McDonnell ~11,000 staff (2024).
| Metric | 2024 |
|---|---|
| US utility capex | $100B |
| EPA budget | $11.5B |
| Staff | ~11,000 |
| Water margins | 12–18% |
Preview = Final Product
Burns & McDonnell BCG Matrix
The Burns & McDonnell BCG Matrix you're previewing is the exact file you'll receive after purchase. No watermarks, no placeholders—just the fully formatted, analysis-ready report. It’s been crafted for clarity and immediate use in strategy sessions or investor decks. Buy once, download instantly, and start presenting—no surprises.
Description
Unlock Strategic Clarity
Curious where Burns & McDonnell’s portfolio really sits—Stars, Cash Cows, Dogs or Question Marks? This snapshot teases the story; the full BCG Matrix gives quadrant-by-quadrant placements, data-driven recommendations, and a clear playbook for where to invest or divest. Buy the complete report for a polished Word analysis plus an editable Excel summary you can present or act on today.
Stars
Grid modernization & T&D EPC
Utilities are directing sustained high-growth spend into grid modernization and T&D, driven by multi-year programs often sized in the low- to mid-hundreds of millions, and Burns & McDonnell, an employee-owned integrated EPC, holds a strong share on those shortlists. Large, complex programs keep the flywheel spinning and the brand visible across portfolios. Projects are cash-hungry but defensible given scale, safety record, and schedule performance. Continued investment is required to cement leadership as grids are rebuilt.
Renewables & grid-scale storage delivery
Wind, solar and batteries added about 515 GW globally in 2023 (IEA 2024) and owners increasingly seek single‑throat‑to‑choke EPC partners; Burns & McDonnell’s design‑through‑commissioning model aligns with that demand. Margins track execution risk, soaking capital but paying back through higher volume and repeat work. US interconnection queues exceed 1,000 GW (FERC 2024), so stay on the front foot with long‑lead procurement, storage integration and queue management.
Mission‑critical/data centers
Mission‑critical/data centers are a Stars sector as exploding demand and speed‑to‑market pressure—with hyperscalers driving roughly 60–70% of new build demand in 2024—create a repeat‑buyer sweet spot. Burns & McDonnell holds high share with clients valuing certainty over lowest bid; projects consume cash during ramp but secure premium, recurring pipelines. Double down on regional delivery hubs and vetted subs to keep cycle times tight and margins protected.
Aviation & transportation programs
Airports and DOT programs are mid-cycle to hot as 2024 BIL-driven spending from the 2021 Bipartisan Infrastructure Law (total package $1.2 trillion) continues; delivery is consolidating to proven primes. Burns & McDonnell’s integrated design, PM/CM and commissioning wins multi-year roles and anchors program delivery. Heavy coordination burn enforces strict cash-flow behavior—money in, money out—so maintain owner visibility and pre-position ahead of funding waves.
- 2024: BIL (2021) $1.2 trillion ongoing
- Program type: multi-year PM/CM + commissioning
- Delivery pattern: consolidation to proven primes
- Cash behavior: strict money-in/money-out
- Action: keep owner visibility; pre-position before funding waves
Environmental permitting tied to capital programs
Permitting bundled to major capital programs is accelerating, with approvals typically adding 6–36 months to schedules and programs reporting >60% win rates when design‑build is planned, favoring integrated teams and creating pull‑through into EPC work.
This approach is resource intensive but strategic: it unlocks downstream EPC value, so keep talent benches deep and maintain active regulator relationships to sustain win rates and schedule certainty.
- Permitting delay: 6–36 months
- Reported win rate with design‑build: >60%
- Strategy: preserves EPC pull‑through
- Action: deepen talent benches; warm regulator ties
Pre-position for grid programs, secure renewables long-lead, scale regional data hubs
Utilities: multi-year grid/T&D programs in low‑mid hundreds $M; maintain shortlist share. Renewables: 515 GW added in 2023 (IEA 2024); US interconnection >1,000 GW (FERC 2024). Data centers: hyperscalers ~60–70% new build demand in 2024; scale, safety and delivery win repeat premium work.
| Sector | 2024 metric | Action |
|---|---|---|
| Grid | hundreds $M programs | pre‑position, bench depth |
| Renewables | 515 GW (2023) | long‑lead procure |
| Data | 60–70% hyperscaler | regional hubs |
What is included in the product
Detailed Word Document
BCG Matrix for Burns & McDonnell: maps Stars, Cash Cows, Question Marks and Dogs with clear investment and divestment guidance.
Customizable Excel Spreadsheet
One-page BCG Matrix placing Burns & McDonnell units in quadrants for instant strategic clarity
Cash Cows
Utility program management (capital portfolios)
Mature, recurring, sticky utility program management yields high-share, long-standing utility clients delivering predictable fees and utilization; U.S. utility capital expenditures are forecast near 100 billion in 2024, underpinning steady demand. Growth is low-single-digit, but cash conversion is strong and enables cross-sell into design and construction. Maintain process excellence and digital dashboards; avoid over-investment to protect margins.
Water/wastewater engineering for municipalities
Water/wastewater engineering for municipalities is a cash cow: predictable annual RFP cadence from capital improvement plans and strong incumbency in service territories drive steady fees and backlog. Margins are solid—typically 12–18%—when scope control and standards/BIM libraries are enforced. Not hyper-growth but reliable staffing and revenue; invest in templates and BIM libraries to cut delivery costs 15–25% and sustain cash generation.
Commissioning & start‑up services
Commissioning & start-up services act as natural follow-ons to in-house EPC and simple add-ons for third-party EPCs, delivering high-repeat engagements with industry repeat rates above 60% in 2024 and strong cash conversion. Low BD cost per win and steady margins support robust free cash flow, while growth is modest (industry CAGR ~5% through 2028). Utilization often exceeds 85%, so standardize playbooks and keep senior leads billable to maximize yield.
Environmental compliance & monitoring (O&M phase)
Environmental compliance and monitoring during O&M is a steady cash cow: regulatory work rarely spikes but persists, supported by the EPA FY2024 enacted budget of 11.5 billion which sustains enforcement and permitting activity; sticky accounts and predictable schedules drive high-margin cash generation, enabling upsells of small studies and renewals with minimal selling cost.
- Lean teams: automate reporting to cut cost
- High retention: predictable recurring revenue
- Upsell: low-cost add-ons raise ARPU
- Bank margin: prioritize renewals and efficiency
Industrial facilities retrofit/expansion design
Industrial facilities retrofit/expansion design sits in Cash Cows for Burns & McDonnell: brownfield upgrades persist when new builds slow, and the firm’s constructability edge delivers superior schedule reliability. Growth is moderate, cash conversion strong; maintain core client rosters and avoid speculative pursuits. Burns & McDonnell is employee-owned and operates in 50+ countries with over 11,000 staff (2024).
- Tag: steady demand
- Tag: schedule reliability advantage
- Tag: moderate growth
- Tag: high cash conversion
- Tag: client retention focus
Mature utility programs = recurring fees, strong cash conversion; water margins 12–18%
Mature utility program mgmt, water/wastewater, commissioning, environmental O&M and brownfield industrial work generate high-share, recurring fees, strong cash conversion and margins (water margins 12–18%); U.S. utility capex ~100B (2024), EPA budget 11.5B (FY2024), Burns & McDonnell ~11,000 staff (2024).
| Metric | 2024 |
|---|---|
| US utility capex | $100B |
| EPA budget | $11.5B |
| Staff | ~11,000 |
| Water margins | 12–18% |
Preview = Final Product
Burns & McDonnell BCG Matrix
The Burns & McDonnell BCG Matrix you're previewing is the exact file you'll receive after purchase. No watermarks, no placeholders—just the fully formatted, analysis-ready report. It’s been crafted for clarity and immediate use in strategy sessions or investor decks. Buy once, download instantly, and start presenting—no surprises.











