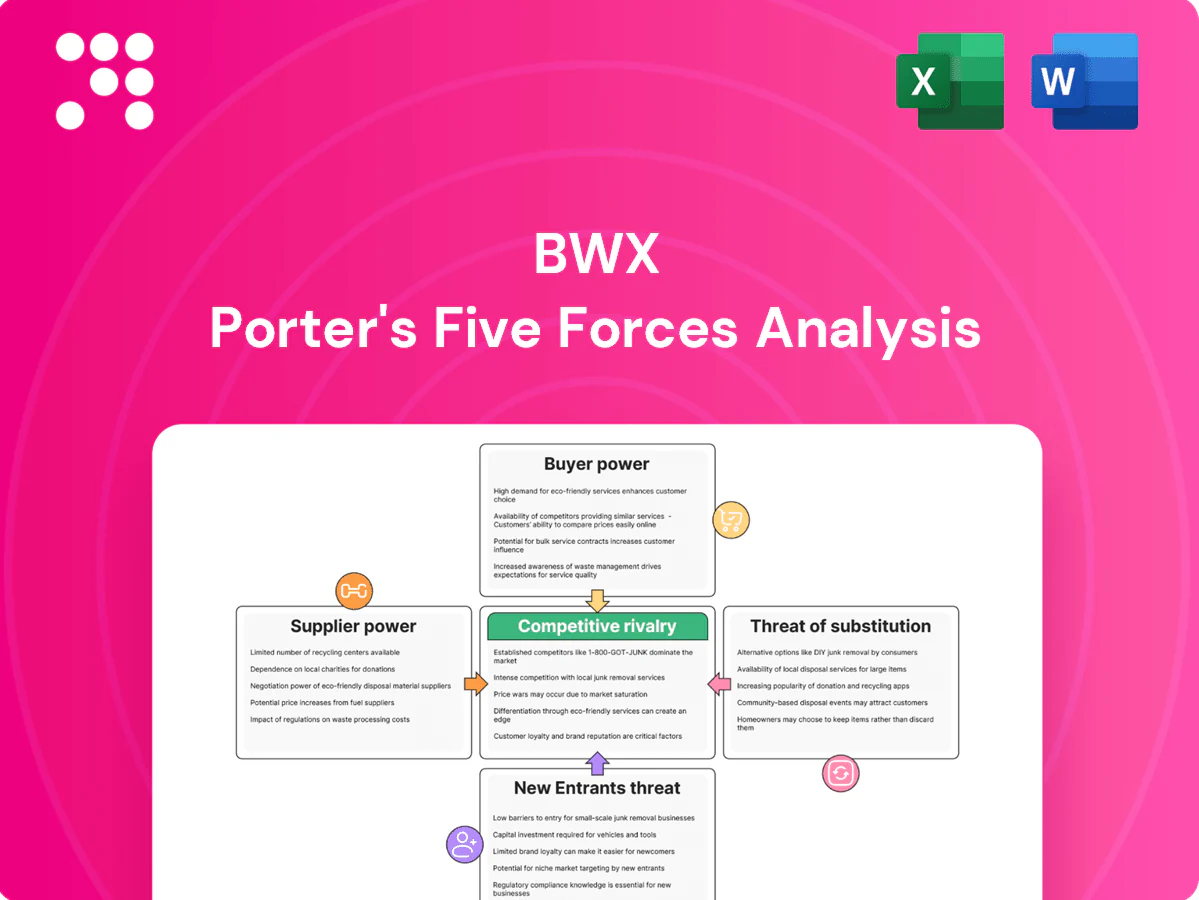
BWX Porter's Five Forces Analysis

Go Beyond the Preview—Access the Full Strategic Report
BWX operates in a capital-intensive niche where supplier concentration and regulatory scrutiny raise barriers, while buyer power and substitute threats remain moderate; competitive rivalry hinges on technological edge and scale. This brief snapshot only scratches the surface. Unlock the full Porter's Five Forces Analysis to explore BWX’s competitive dynamics, market pressures, and strategic advantages in detail.
Suppliers Bargaining Power

Certified botanical inputs scarcity
Certified botanical inputs such as organic essential oils, plant extracts and fair-trade botanicals are concentrated among few suppliers, with industry estimates in 2024 indicating top suppliers control roughly 50-70% of certified volumes, increasing BWX dependence and bargaining risk. Crop yield variability and climate shocks have driven price volatility—annual supply swings of 10-30% are reported—while ethically sourced inputs often carry 6–12 month lead times that constrain production planning. BWX may need multi-sourcing, longer inventory buffers and strategic contracts to mitigate disruption risks.
Packaging and sustainable materials
Recyclable materials, PCR plastics, glass and eco-inks come from specialized vendors with significant pricing power as sustainability specs shrink the supplier pool and reduce switching options. Global resin and freight volatility — container rates fell from ~USD 10,000/FEU in 2021 to below USD 2,000/FEU by 2024 — can cascade into margin pressure. Strategic multi-year agreements and design-to-cost programs can partially offset supplier leverage.

Contract manufacturing and capacity
Certain SKUs or geographies depend on third-party manufacturers with GMP and clean-beauty capabilities, concentrating supply. Capacity constraints during demand spikes raise supplier bargaining power and risk premium on lead times. Transitioning formulas between facilities requires regulatory validation and stability testing, which is costly and time-consuming, while co-development can align incentives but increases partner lock-in.

Certification and compliance services
Certifiers for organic, cruelty-free, and vegan labels function as quasi-suppliers of market access, with their standards and audit schedules able to delay launches and add fixed certification costs; in 2024 certified-organic skincare sales exceeded $10B globally, intensifying demand for recognized seals. Limited recognized alternatives elevates certifier leverage, so building internal compliance expertise helps negotiate timelines and requirements.
Currency and geopolitical exposure
Inputs sourced globally expose BWX to FX swings that suppliers can pass through; sanitary, phytosanitary and trade measures periodically disrupt niche botanicals, prompting suppliers to demand prepayments and tightening working capital. Hedging and regionalizing supply chains mitigate this bargaining asymmetry.
- FX passthrough
- SPS/trade disruption
- Prepayment risk
- Hedging/regionalization
Certified suppliers control 50–70%, driving 10–30% annual supply swings
Certified botanical suppliers control ~50–70% of certified volumes in 2024, raising BWX dependence and bargaining risk. Crop volatility drives 10–30% annual supply swings and 6–12 month lead times, pressuring margins. Packaging and certifiers narrow the supplier pool; multi-sourcing, hedging and strategic contracts are needed to mitigate FX, freight and prepayment exposure.
| Metric | 2024 |
|---|---|
| Certified supplier share | 50–70% |
| Supply volatility | 10–30% |
| Lead times | 6–12 months |
| Organic skincare sales | $10B+ |
What is included in the product
 Detailed Word Document
Comprehensive Porter's Five Forces assessment of BWX that uncovers competitive intensity, buyer and supplier leverage, threat of new entrants and substitutes, and identifies disruptive forces and market entry barriers to guide strategic positioning and value preservation.

 Customizable Excel Spreadsheet
Compact, editable BWX Porter's Five Forces summary—translate complex competitive pressures into clear scores and visuals for faster, board-ready strategy decisions.
Customers Bargaining Power

Consolidated retail channels
Consolidated retail channels—supermarkets, pharmacies and beauty chains—control shelf access and contract terms, with the top three US grocery retailers (Walmart, Kroger, Costco) accounting for roughly 36% of grocery sales in 2024, concentrating negotiating leverage. Listing fees, promotional funding and liberal returns shift margin to retailers; category data from these chains enables hard price and placement negotiations. BWX's expansion into DTC, which captured roughly 18% of beauty/channel sales in 2024, reduces retailer leverage.
Highly informed consumers
Ingredient-savvy shoppers compare formulations and certifications online, aided by 2024 global internet penetration of about 66% (ITU) and 5.16 billion social media users (DataReportal 2024). Reviews and influencers accelerate switching when perceived value is unclear, pressuring conversion and retention. Transparency demands force pricing discipline and claims substantiation. Strong brand trust supported by clinical efficacy data can reduce price sensitivity.

Private label competition
Retailers’ private labels, which accounted for about 18.6% of US grocery sales in 2024 per IRI, replicate branded claims at lower prices, raising the risk of buyers switching away from branded SKUs.
Brands face higher trade spend expectations to defend facings and maintain shelf placement.
Stronger differentiation via IP, provenance, and clinical evidence reduces substitution and preserves pricing power.

E-commerce platforms’ terms
E-commerce platforms impose referral and fulfillment fees (typically 10–15% on major marketplaces in 2024), control shopper data and algorithmic visibility, and enforce price parity that compresses cross-channel margins; high return rates (US online returns ~18–20% in 2023–24, higher in fashion) further raise cost-to-serve. Direct sites and subscription models can improve unit economics, often boosting gross margins by ~5–10% while restoring first-party data and lifetime value control.
- Marketplace fees: 10–15% (2024)
- Returns: ~18–20% online (2023–24)
- Parity policy: margin compression across channels
- Direct/subscriptions: +5–10% gross margin, regain data
Demand for sustainability proof
Buyers demand traceability, lifecycle impact data and ethical sourcing verification; 2024 surveys show about 70% of consumers factor sustainability into purchases, raising risk of delistings or consumer backlash if claims lack evidence. Compliance costs are often unrecoverable in pricing, squeezing margins. Robust ESG reporting converts this demand into a selling point and price premium.
- Traceability required
- ~70% factor sustainability (2024)
- Delisting/backlash risk
- Compliance costs pressure margins
- ESG reporting = competitive advantage
Top grocers ~36% share and 10–15% fees shift power to buyers
Concentrated retail channels (top three US grocers ~36% of grocery sales 2024) and marketplace fees (10–15% 2024) give buyers strong leverage, driving listing fees, promo funding and parity demands. DTC (≈18% beauty/channel sales 2024) and subscription models (+5–10% gross margin) partially restore brand power. Private labels (~18.6% US grocery 2024), high online returns (≈18–20% 2023–24) and ~70% sustainability preference (2024) intensify price and compliance pressure.
| Metric | 2023–24 Value |
|---|---|
| Top 3 grocers share | ~36% |
| DTC beauty share | ~18% |
| Marketplace fees | 10–15% |
| Online returns | 18–20% |
| Private label share | ~18.6% |
| Consumers factoring sustainability | ~70% |
| Direct/subscription margin uplift | +5–10% |
Preview Before You Purchase
BWX Porter's Five Forces Analysis
This preview shows the exact BWX Porter’s Five Forces analysis you'll receive immediately after purchase—no surprises, no placeholders. The file is fully formatted and ready for use the moment you buy, covering competitive rivalry, supplier and buyer power, threats of entry and substitutes, and strategic implications. You’ll get instant access to this final document upon payment.

Go Beyond the Preview—Access the Full Strategic Report
BWX operates in a capital-intensive niche where supplier concentration and regulatory scrutiny raise barriers, while buyer power and substitute threats remain moderate; competitive rivalry hinges on technological edge and scale. This brief snapshot only scratches the surface. Unlock the full Porter's Five Forces Analysis to explore BWX’s competitive dynamics, market pressures, and strategic advantages in detail.
Suppliers Bargaining Power
Certified botanical inputs scarcity
Certified botanical inputs such as organic essential oils, plant extracts and fair-trade botanicals are concentrated among few suppliers, with industry estimates in 2024 indicating top suppliers control roughly 50-70% of certified volumes, increasing BWX dependence and bargaining risk. Crop yield variability and climate shocks have driven price volatility—annual supply swings of 10-30% are reported—while ethically sourced inputs often carry 6–12 month lead times that constrain production planning. BWX may need multi-sourcing, longer inventory buffers and strategic contracts to mitigate disruption risks.
Packaging and sustainable materials
Recyclable materials, PCR plastics, glass and eco-inks come from specialized vendors with significant pricing power as sustainability specs shrink the supplier pool and reduce switching options. Global resin and freight volatility — container rates fell from ~USD 10,000/FEU in 2021 to below USD 2,000/FEU by 2024 — can cascade into margin pressure. Strategic multi-year agreements and design-to-cost programs can partially offset supplier leverage.
Contract manufacturing and capacity
Certain SKUs or geographies depend on third-party manufacturers with GMP and clean-beauty capabilities, concentrating supply. Capacity constraints during demand spikes raise supplier bargaining power and risk premium on lead times. Transitioning formulas between facilities requires regulatory validation and stability testing, which is costly and time-consuming, while co-development can align incentives but increases partner lock-in.
Certification and compliance services
Certifiers for organic, cruelty-free, and vegan labels function as quasi-suppliers of market access, with their standards and audit schedules able to delay launches and add fixed certification costs; in 2024 certified-organic skincare sales exceeded $10B globally, intensifying demand for recognized seals. Limited recognized alternatives elevates certifier leverage, so building internal compliance expertise helps negotiate timelines and requirements.
Currency and geopolitical exposure
Inputs sourced globally expose BWX to FX swings that suppliers can pass through; sanitary, phytosanitary and trade measures periodically disrupt niche botanicals, prompting suppliers to demand prepayments and tightening working capital. Hedging and regionalizing supply chains mitigate this bargaining asymmetry.
- FX passthrough
- SPS/trade disruption
- Prepayment risk
- Hedging/regionalization
Certified suppliers control 50–70%, driving 10–30% annual supply swings
Certified botanical suppliers control ~50–70% of certified volumes in 2024, raising BWX dependence and bargaining risk. Crop volatility drives 10–30% annual supply swings and 6–12 month lead times, pressuring margins. Packaging and certifiers narrow the supplier pool; multi-sourcing, hedging and strategic contracts are needed to mitigate FX, freight and prepayment exposure.
| Metric | 2024 |
|---|---|
| Certified supplier share | 50–70% |
| Supply volatility | 10–30% |
| Lead times | 6–12 months |
| Organic skincare sales | $10B+ |
What is included in the product
Detailed Word Document
Comprehensive Porter's Five Forces assessment of BWX that uncovers competitive intensity, buyer and supplier leverage, threat of new entrants and substitutes, and identifies disruptive forces and market entry barriers to guide strategic positioning and value preservation.
Customizable Excel Spreadsheet
Compact, editable BWX Porter's Five Forces summary—translate complex competitive pressures into clear scores and visuals for faster, board-ready strategy decisions.
Customers Bargaining Power
Consolidated retail channels
Consolidated retail channels—supermarkets, pharmacies and beauty chains—control shelf access and contract terms, with the top three US grocery retailers (Walmart, Kroger, Costco) accounting for roughly 36% of grocery sales in 2024, concentrating negotiating leverage. Listing fees, promotional funding and liberal returns shift margin to retailers; category data from these chains enables hard price and placement negotiations. BWX's expansion into DTC, which captured roughly 18% of beauty/channel sales in 2024, reduces retailer leverage.
Highly informed consumers
Ingredient-savvy shoppers compare formulations and certifications online, aided by 2024 global internet penetration of about 66% (ITU) and 5.16 billion social media users (DataReportal 2024). Reviews and influencers accelerate switching when perceived value is unclear, pressuring conversion and retention. Transparency demands force pricing discipline and claims substantiation. Strong brand trust supported by clinical efficacy data can reduce price sensitivity.
Private label competition
Retailers’ private labels, which accounted for about 18.6% of US grocery sales in 2024 per IRI, replicate branded claims at lower prices, raising the risk of buyers switching away from branded SKUs.
Brands face higher trade spend expectations to defend facings and maintain shelf placement.
Stronger differentiation via IP, provenance, and clinical evidence reduces substitution and preserves pricing power.
E-commerce platforms’ terms
E-commerce platforms impose referral and fulfillment fees (typically 10–15% on major marketplaces in 2024), control shopper data and algorithmic visibility, and enforce price parity that compresses cross-channel margins; high return rates (US online returns ~18–20% in 2023–24, higher in fashion) further raise cost-to-serve. Direct sites and subscription models can improve unit economics, often boosting gross margins by ~5–10% while restoring first-party data and lifetime value control.
- Marketplace fees: 10–15% (2024)
- Returns: ~18–20% online (2023–24)
- Parity policy: margin compression across channels
- Direct/subscriptions: +5–10% gross margin, regain data
Demand for sustainability proof
Buyers demand traceability, lifecycle impact data and ethical sourcing verification; 2024 surveys show about 70% of consumers factor sustainability into purchases, raising risk of delistings or consumer backlash if claims lack evidence. Compliance costs are often unrecoverable in pricing, squeezing margins. Robust ESG reporting converts this demand into a selling point and price premium.
- Traceability required
- ~70% factor sustainability (2024)
- Delisting/backlash risk
- Compliance costs pressure margins
- ESG reporting = competitive advantage
Top grocers ~36% share and 10–15% fees shift power to buyers
Concentrated retail channels (top three US grocers ~36% of grocery sales 2024) and marketplace fees (10–15% 2024) give buyers strong leverage, driving listing fees, promo funding and parity demands. DTC (≈18% beauty/channel sales 2024) and subscription models (+5–10% gross margin) partially restore brand power. Private labels (~18.6% US grocery 2024), high online returns (≈18–20% 2023–24) and ~70% sustainability preference (2024) intensify price and compliance pressure.
| Metric | 2023–24 Value |
|---|---|
| Top 3 grocers share | ~36% |
| DTC beauty share | ~18% |
| Marketplace fees | 10–15% |
| Online returns | 18–20% |
| Private label share | ~18.6% |
| Consumers factoring sustainability | ~70% |
| Direct/subscription margin uplift | +5–10% |
Preview Before You Purchase
BWX Porter's Five Forces Analysis
This preview shows the exact BWX Porter’s Five Forces analysis you'll receive immediately after purchase—no surprises, no placeholders. The file is fully formatted and ready for use the moment you buy, covering competitive rivalry, supplier and buyer power, threats of entry and substitutes, and strategic implications. You’ll get instant access to this final document upon payment.
Original: $10.00
-65%$10.00
$3.50Description
Go Beyond the Preview—Access the Full Strategic Report
BWX operates in a capital-intensive niche where supplier concentration and regulatory scrutiny raise barriers, while buyer power and substitute threats remain moderate; competitive rivalry hinges on technological edge and scale. This brief snapshot only scratches the surface. Unlock the full Porter's Five Forces Analysis to explore BWX’s competitive dynamics, market pressures, and strategic advantages in detail.
Suppliers Bargaining Power
Certified botanical inputs scarcity
Certified botanical inputs such as organic essential oils, plant extracts and fair-trade botanicals are concentrated among few suppliers, with industry estimates in 2024 indicating top suppliers control roughly 50-70% of certified volumes, increasing BWX dependence and bargaining risk. Crop yield variability and climate shocks have driven price volatility—annual supply swings of 10-30% are reported—while ethically sourced inputs often carry 6–12 month lead times that constrain production planning. BWX may need multi-sourcing, longer inventory buffers and strategic contracts to mitigate disruption risks.
Packaging and sustainable materials
Recyclable materials, PCR plastics, glass and eco-inks come from specialized vendors with significant pricing power as sustainability specs shrink the supplier pool and reduce switching options. Global resin and freight volatility — container rates fell from ~USD 10,000/FEU in 2021 to below USD 2,000/FEU by 2024 — can cascade into margin pressure. Strategic multi-year agreements and design-to-cost programs can partially offset supplier leverage.
Contract manufacturing and capacity
Certain SKUs or geographies depend on third-party manufacturers with GMP and clean-beauty capabilities, concentrating supply. Capacity constraints during demand spikes raise supplier bargaining power and risk premium on lead times. Transitioning formulas between facilities requires regulatory validation and stability testing, which is costly and time-consuming, while co-development can align incentives but increases partner lock-in.
Certification and compliance services
Certifiers for organic, cruelty-free, and vegan labels function as quasi-suppliers of market access, with their standards and audit schedules able to delay launches and add fixed certification costs; in 2024 certified-organic skincare sales exceeded $10B globally, intensifying demand for recognized seals. Limited recognized alternatives elevates certifier leverage, so building internal compliance expertise helps negotiate timelines and requirements.
Currency and geopolitical exposure
Inputs sourced globally expose BWX to FX swings that suppliers can pass through; sanitary, phytosanitary and trade measures periodically disrupt niche botanicals, prompting suppliers to demand prepayments and tightening working capital. Hedging and regionalizing supply chains mitigate this bargaining asymmetry.
- FX passthrough
- SPS/trade disruption
- Prepayment risk
- Hedging/regionalization
Certified suppliers control 50–70%, driving 10–30% annual supply swings
Certified botanical suppliers control ~50–70% of certified volumes in 2024, raising BWX dependence and bargaining risk. Crop volatility drives 10–30% annual supply swings and 6–12 month lead times, pressuring margins. Packaging and certifiers narrow the supplier pool; multi-sourcing, hedging and strategic contracts are needed to mitigate FX, freight and prepayment exposure.
| Metric | 2024 |
|---|---|
| Certified supplier share | 50–70% |
| Supply volatility | 10–30% |
| Lead times | 6–12 months |
| Organic skincare sales | $10B+ |
What is included in the product
Detailed Word Document
Comprehensive Porter's Five Forces assessment of BWX that uncovers competitive intensity, buyer and supplier leverage, threat of new entrants and substitutes, and identifies disruptive forces and market entry barriers to guide strategic positioning and value preservation.
Customizable Excel Spreadsheet
Compact, editable BWX Porter's Five Forces summary—translate complex competitive pressures into clear scores and visuals for faster, board-ready strategy decisions.
Customers Bargaining Power
Consolidated retail channels
Consolidated retail channels—supermarkets, pharmacies and beauty chains—control shelf access and contract terms, with the top three US grocery retailers (Walmart, Kroger, Costco) accounting for roughly 36% of grocery sales in 2024, concentrating negotiating leverage. Listing fees, promotional funding and liberal returns shift margin to retailers; category data from these chains enables hard price and placement negotiations. BWX's expansion into DTC, which captured roughly 18% of beauty/channel sales in 2024, reduces retailer leverage.
Highly informed consumers
Ingredient-savvy shoppers compare formulations and certifications online, aided by 2024 global internet penetration of about 66% (ITU) and 5.16 billion social media users (DataReportal 2024). Reviews and influencers accelerate switching when perceived value is unclear, pressuring conversion and retention. Transparency demands force pricing discipline and claims substantiation. Strong brand trust supported by clinical efficacy data can reduce price sensitivity.
Private label competition
Retailers’ private labels, which accounted for about 18.6% of US grocery sales in 2024 per IRI, replicate branded claims at lower prices, raising the risk of buyers switching away from branded SKUs.
Brands face higher trade spend expectations to defend facings and maintain shelf placement.
Stronger differentiation via IP, provenance, and clinical evidence reduces substitution and preserves pricing power.
E-commerce platforms’ terms
E-commerce platforms impose referral and fulfillment fees (typically 10–15% on major marketplaces in 2024), control shopper data and algorithmic visibility, and enforce price parity that compresses cross-channel margins; high return rates (US online returns ~18–20% in 2023–24, higher in fashion) further raise cost-to-serve. Direct sites and subscription models can improve unit economics, often boosting gross margins by ~5–10% while restoring first-party data and lifetime value control.
- Marketplace fees: 10–15% (2024)
- Returns: ~18–20% online (2023–24)
- Parity policy: margin compression across channels
- Direct/subscriptions: +5–10% gross margin, regain data
Demand for sustainability proof
Buyers demand traceability, lifecycle impact data and ethical sourcing verification; 2024 surveys show about 70% of consumers factor sustainability into purchases, raising risk of delistings or consumer backlash if claims lack evidence. Compliance costs are often unrecoverable in pricing, squeezing margins. Robust ESG reporting converts this demand into a selling point and price premium.
- Traceability required
- ~70% factor sustainability (2024)
- Delisting/backlash risk
- Compliance costs pressure margins
- ESG reporting = competitive advantage
Top grocers ~36% share and 10–15% fees shift power to buyers
Concentrated retail channels (top three US grocers ~36% of grocery sales 2024) and marketplace fees (10–15% 2024) give buyers strong leverage, driving listing fees, promo funding and parity demands. DTC (≈18% beauty/channel sales 2024) and subscription models (+5–10% gross margin) partially restore brand power. Private labels (~18.6% US grocery 2024), high online returns (≈18–20% 2023–24) and ~70% sustainability preference (2024) intensify price and compliance pressure.
| Metric | 2023–24 Value |
|---|---|
| Top 3 grocers share | ~36% |
| DTC beauty share | ~18% |
| Marketplace fees | 10–15% |
| Online returns | 18–20% |
| Private label share | ~18.6% |
| Consumers factoring sustainability | ~70% |
| Direct/subscription margin uplift | +5–10% |
Preview Before You Purchase
BWX Porter's Five Forces Analysis
This preview shows the exact BWX Porter’s Five Forces analysis you'll receive immediately after purchase—no surprises, no placeholders. The file is fully formatted and ready for use the moment you buy, covering competitive rivalry, supplier and buyer power, threats of entry and substitutes, and strategic implications. You’ll get instant access to this final document upon payment.











