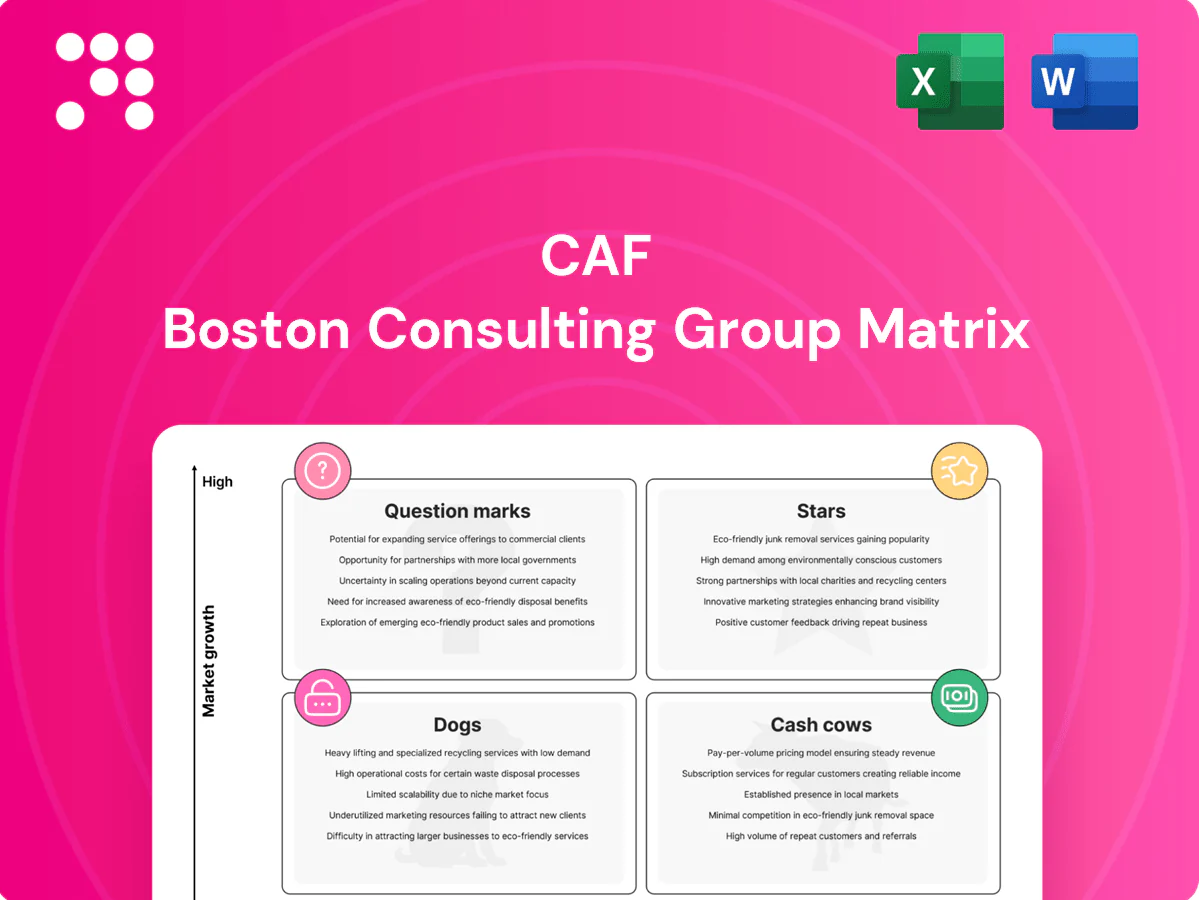
CAF Boston Consulting Group Matrix

Visual. Strategic. Downloadable.
Curious where this company’s products land—Stars, Cash Cows, Dogs, or Question Marks? This preview scratches the surface; buy the full BCG Matrix for quadrant-by-quadrant placements, data-backed recommendations, and a clear roadmap for capital allocation. Get the polished Word report plus an Excel summary and skip the hours of research—strategic clarity, ready to present.
Stars

Turnkey metros in fast-growing cities
In high-market-growth metros CAF secures full-line packages in select regions, turning Stars that command promotional, engineering and ramp cash; CAF reported roughly €2.6bn revenue and an order backlog near €6.5bn in 2023. These programs lead the book and, if market share is maintained, mature into stable annuities. The play: keep investing, defend delivery excellence, and scale fast.
Urbos tram platform in expansion markets
Urbos holds a strong share in light rail as cities continue new-line buildouts; orders land large but require multi-million euro capex, localization investments and extended working capital. Right now cash-in roughly equals cash-out, a classic Star profile. Maintain aggressive bidding and maximize platform reuse and standardization to convert scale into higher margins and a future Cash Cow.

Regional EMUs for commuter growth corridors
Urban sprawl and a modal shift to rail—with global urbanization above 55% per UN data—keep regional EMUs in high demand. CAF competes on lower lifecycle cost and modular platforms, winning high-visibility fleet contracts across Europe. Growth is strong, forcing upfront cash for tooling and launches that pressures margins. Maintain reliability and the installed EMU base converts into recurring, self-funding service and retrofit revenue.

CBTC/ETCS signaling tied to rolling stock
CBTC/ETCS signaling tied to rolling stock is a Star for CAF as digital train control scales rapidly and CAF increasingly wins bundled vehicle-plus-signaling packages; market penetration in targeted tenders is rising while deliveries remain capital- and talent-intensive. Revenues can grow quickly from these integrated contracts, with margins maturing later as productization and references accumulate. Continued investment in product platforms and reference projects is required to lock leadership and convert share gains into sustainable profitability.
- High growth: rising share in targeted tenders
- Capital/talent intensity: high upfront investment
- Revenue profile: fast top-line growth, delayed margin expansion
- Strategy: productize, secure references, scale delivery
International turnkey projects in Latin America & MEA
Pipeline is buoyant and CAF is a recognizable prime; 2024 order backlog ~€5.2bn with >€1bn in LATAM/MEA turnkey awards. Projects are large, complex and cash-hungry in early phases, and market growth plus visible 2024 wins position this as a Star today. Double down on tightened risk controls and working-capital strategies to convert delivery into long-run dominance.
- Star: buoyant pipeline, strong 2024 backlog
- Risk: capital intensity early; require cash buffers
- Action: strengthen contract risk, performance bonds, KPIs
Rolling stock: convert €5.2bn backlog to service annuities
CAF Stars (rolling stock, Urbos, EMUs, CBTC/ETCS) drive fast top-line growth but demand high upfront capex and working capital; 2023 revenue ~€2.6bn and 2024 backlog ~€5.2bn with >€1bn in LATAM/MEA. Continue investing, productize platforms, tighten contract risk and convert scale into service annuities.
| Metric | Value |
|---|---|
| 2023 Revenue | €2.6bn |
| 2024 Backlog | €5.2bn |
| LATAM/MEA Awards 2024 | >€1bn |
What is included in the product
 Detailed Word Document
CAF BCG Matrix: quadrant-by-quadrant review with investment guidance, risks, and trend context to prioritize units.

 Customizable Excel Spreadsheet
One-page CAF BCG Matrix that clarifies priorities, easing analysis paralysis for faster decisions
Cash Cows

Long-term maintenance & availability contracts
Long-term maintenance and availability contracts are a mature, high-share base delivering predictable cash flow, with renewal rates typically above 80-90% and gross margins often in the 40-60% range. Low market growth is offset by uptime SLAs (commonly 99.9%) and renewal/uptime bonuses that keep margins healthy. Promotion needs are modest; execution quality and retention drive value. Milk the installed base and invest in tooling to boost throughput and lower cost per ticket.
Spare parts and lifecycle services
Spare parts and lifecycle services leverage CAF’s large installed fleet and order backlog >€6bn (FY2023), guaranteeing steady spares demand. Market growth is low while CAF holds high share and strong gross-margin mix, with rail aftermarket gross margins typically >30%. Cash inflows from services reliably exceed outflows, funding capex and dividends. Optimizing inventory turns and dynamic pricing can widen the cash funnel further.

Fleet overhauls and midlife refurbishments
Fleet overhauls and midlife refurbishments are recurring, pan‑European programs with stable demand where CAF leverages platform know‑how to secure long contracts; CAF reported €3.7bn revenue in 2023 with services representing roughly 20% of group turnover. Minimal promotion, high shop utilization (around 90%) and solid aftermarket margins make this a cash cow. Adding automation and digital diagnostics can boost throughput and squeeze more cash per slot.

Core components (bogies, doors, traction spares)
Core components (bogies, doors, traction spares) are cash cows for CAF, holding a high share across CAF platforms and partner fleets and delivering repeatable specs and dependable returns in 2024. The market is mature, investments are incremental and focused on lifecycle upgrades, while SKU standardization and frame agreements keep unit economics stable.
- High share across fleets
- Mature, repeatable demand
- Incremental capex only
- Standardize SKUs, lock frame agreements
EU replacement trams/metros on proven platforms
Replacement cycles in EU trams/metros favor incumbents with strong references; CAF in 2024 leverages proven platforms to secure repeat orders, with EU replacement demand estimated at c.€3–4bn p.a. and modest market growth (~2–3% CAGR).
Market share is high on proven platforms, margins are tidy (order-level EBITDA typically mid-single digits to low double-digits), sales and engineering costs lower than turnkey new lines, so strategy is maintain position and quietly harvest.
- High share: strong reference fleets across EU
- Growth: modest ~2–3% CAGR (2024 outlook)
- Demand: ~€3–4bn p.a. replacement market (2024)
- Margins: mid-single to low-double-digit EBITDA on rolling stock
- Go-to-market: low sales cost vs new turnkey lines
Aftermarket cash engine — backlog >€6bn; revenue €3.7bn; margins >30%
CAF cash cows—maintenance, spares, midlife overhauls and core components—deliver predictable high-share cash flow: backlog >€6bn (FY2023), group revenue €3.7bn (2023) with services ~20%, aftermarket margins typically >30%, and EU replacement market ~€3–4bn p.a. (2024) with ~2–3% CAGR; focus on retention, SKU standardization and throughput improvements to harvest cash.
| Metric | Value |
|---|---|
| Backlog (FY2023) | €>6bn |
| Revenue (2023) | €3.7bn |
| Services % | ~20% |
| Aftermarket margin | >30% |
| EU replacement | €3–4bn p.a. |
What You’re Viewing Is Included
CAF BCG Matrix
The file you're previewing is the final CAF BCG Matrix report you'll receive after purchase. No watermarks or demo content — just a fully formatted, strategy-ready matrix tailored for portfolio analysis. Once bought, the same editable document is yours to download, present, or print immediately. Clear, precise, and production-ready.

Visual. Strategic. Downloadable.
Curious where this company’s products land—Stars, Cash Cows, Dogs, or Question Marks? This preview scratches the surface; buy the full BCG Matrix for quadrant-by-quadrant placements, data-backed recommendations, and a clear roadmap for capital allocation. Get the polished Word report plus an Excel summary and skip the hours of research—strategic clarity, ready to present.
Stars
Turnkey metros in fast-growing cities
In high-market-growth metros CAF secures full-line packages in select regions, turning Stars that command promotional, engineering and ramp cash; CAF reported roughly €2.6bn revenue and an order backlog near €6.5bn in 2023. These programs lead the book and, if market share is maintained, mature into stable annuities. The play: keep investing, defend delivery excellence, and scale fast.
Urbos tram platform in expansion markets
Urbos holds a strong share in light rail as cities continue new-line buildouts; orders land large but require multi-million euro capex, localization investments and extended working capital. Right now cash-in roughly equals cash-out, a classic Star profile. Maintain aggressive bidding and maximize platform reuse and standardization to convert scale into higher margins and a future Cash Cow.
Regional EMUs for commuter growth corridors
Urban sprawl and a modal shift to rail—with global urbanization above 55% per UN data—keep regional EMUs in high demand. CAF competes on lower lifecycle cost and modular platforms, winning high-visibility fleet contracts across Europe. Growth is strong, forcing upfront cash for tooling and launches that pressures margins. Maintain reliability and the installed EMU base converts into recurring, self-funding service and retrofit revenue.
CBTC/ETCS signaling tied to rolling stock
CBTC/ETCS signaling tied to rolling stock is a Star for CAF as digital train control scales rapidly and CAF increasingly wins bundled vehicle-plus-signaling packages; market penetration in targeted tenders is rising while deliveries remain capital- and talent-intensive. Revenues can grow quickly from these integrated contracts, with margins maturing later as productization and references accumulate. Continued investment in product platforms and reference projects is required to lock leadership and convert share gains into sustainable profitability.
- High growth: rising share in targeted tenders
- Capital/talent intensity: high upfront investment
- Revenue profile: fast top-line growth, delayed margin expansion
- Strategy: productize, secure references, scale delivery
International turnkey projects in Latin America & MEA
Pipeline is buoyant and CAF is a recognizable prime; 2024 order backlog ~€5.2bn with >€1bn in LATAM/MEA turnkey awards. Projects are large, complex and cash-hungry in early phases, and market growth plus visible 2024 wins position this as a Star today. Double down on tightened risk controls and working-capital strategies to convert delivery into long-run dominance.
- Star: buoyant pipeline, strong 2024 backlog
- Risk: capital intensity early; require cash buffers
- Action: strengthen contract risk, performance bonds, KPIs
Rolling stock: convert €5.2bn backlog to service annuities
CAF Stars (rolling stock, Urbos, EMUs, CBTC/ETCS) drive fast top-line growth but demand high upfront capex and working capital; 2023 revenue ~€2.6bn and 2024 backlog ~€5.2bn with >€1bn in LATAM/MEA. Continue investing, productize platforms, tighten contract risk and convert scale into service annuities.
| Metric | Value |
|---|---|
| 2023 Revenue | €2.6bn |
| 2024 Backlog | €5.2bn |
| LATAM/MEA Awards 2024 | >€1bn |
What is included in the product
Detailed Word Document
CAF BCG Matrix: quadrant-by-quadrant review with investment guidance, risks, and trend context to prioritize units.
Customizable Excel Spreadsheet
One-page CAF BCG Matrix that clarifies priorities, easing analysis paralysis for faster decisions
Cash Cows
Long-term maintenance & availability contracts
Long-term maintenance and availability contracts are a mature, high-share base delivering predictable cash flow, with renewal rates typically above 80-90% and gross margins often in the 40-60% range. Low market growth is offset by uptime SLAs (commonly 99.9%) and renewal/uptime bonuses that keep margins healthy. Promotion needs are modest; execution quality and retention drive value. Milk the installed base and invest in tooling to boost throughput and lower cost per ticket.
Spare parts and lifecycle services
Spare parts and lifecycle services leverage CAF’s large installed fleet and order backlog >€6bn (FY2023), guaranteeing steady spares demand. Market growth is low while CAF holds high share and strong gross-margin mix, with rail aftermarket gross margins typically >30%. Cash inflows from services reliably exceed outflows, funding capex and dividends. Optimizing inventory turns and dynamic pricing can widen the cash funnel further.
Fleet overhauls and midlife refurbishments
Fleet overhauls and midlife refurbishments are recurring, pan‑European programs with stable demand where CAF leverages platform know‑how to secure long contracts; CAF reported €3.7bn revenue in 2023 with services representing roughly 20% of group turnover. Minimal promotion, high shop utilization (around 90%) and solid aftermarket margins make this a cash cow. Adding automation and digital diagnostics can boost throughput and squeeze more cash per slot.
Core components (bogies, doors, traction spares)
Core components (bogies, doors, traction spares) are cash cows for CAF, holding a high share across CAF platforms and partner fleets and delivering repeatable specs and dependable returns in 2024. The market is mature, investments are incremental and focused on lifecycle upgrades, while SKU standardization and frame agreements keep unit economics stable.
- High share across fleets
- Mature, repeatable demand
- Incremental capex only
- Standardize SKUs, lock frame agreements
EU replacement trams/metros on proven platforms
Replacement cycles in EU trams/metros favor incumbents with strong references; CAF in 2024 leverages proven platforms to secure repeat orders, with EU replacement demand estimated at c.€3–4bn p.a. and modest market growth (~2–3% CAGR).
Market share is high on proven platforms, margins are tidy (order-level EBITDA typically mid-single digits to low double-digits), sales and engineering costs lower than turnkey new lines, so strategy is maintain position and quietly harvest.
- High share: strong reference fleets across EU
- Growth: modest ~2–3% CAGR (2024 outlook)
- Demand: ~€3–4bn p.a. replacement market (2024)
- Margins: mid-single to low-double-digit EBITDA on rolling stock
- Go-to-market: low sales cost vs new turnkey lines
Aftermarket cash engine — backlog >€6bn; revenue €3.7bn; margins >30%
CAF cash cows—maintenance, spares, midlife overhauls and core components—deliver predictable high-share cash flow: backlog >€6bn (FY2023), group revenue €3.7bn (2023) with services ~20%, aftermarket margins typically >30%, and EU replacement market ~€3–4bn p.a. (2024) with ~2–3% CAGR; focus on retention, SKU standardization and throughput improvements to harvest cash.
| Metric | Value |
|---|---|
| Backlog (FY2023) | €>6bn |
| Revenue (2023) | €3.7bn |
| Services % | ~20% |
| Aftermarket margin | >30% |
| EU replacement | €3–4bn p.a. |
What You’re Viewing Is Included
CAF BCG Matrix
The file you're previewing is the final CAF BCG Matrix report you'll receive after purchase. No watermarks or demo content — just a fully formatted, strategy-ready matrix tailored for portfolio analysis. Once bought, the same editable document is yours to download, present, or print immediately. Clear, precise, and production-ready.
Original: $10.00
-65%$10.00
$3.50Description
Visual. Strategic. Downloadable.
Curious where this company’s products land—Stars, Cash Cows, Dogs, or Question Marks? This preview scratches the surface; buy the full BCG Matrix for quadrant-by-quadrant placements, data-backed recommendations, and a clear roadmap for capital allocation. Get the polished Word report plus an Excel summary and skip the hours of research—strategic clarity, ready to present.
Stars
Turnkey metros in fast-growing cities
In high-market-growth metros CAF secures full-line packages in select regions, turning Stars that command promotional, engineering and ramp cash; CAF reported roughly €2.6bn revenue and an order backlog near €6.5bn in 2023. These programs lead the book and, if market share is maintained, mature into stable annuities. The play: keep investing, defend delivery excellence, and scale fast.
Urbos tram platform in expansion markets
Urbos holds a strong share in light rail as cities continue new-line buildouts; orders land large but require multi-million euro capex, localization investments and extended working capital. Right now cash-in roughly equals cash-out, a classic Star profile. Maintain aggressive bidding and maximize platform reuse and standardization to convert scale into higher margins and a future Cash Cow.
Regional EMUs for commuter growth corridors
Urban sprawl and a modal shift to rail—with global urbanization above 55% per UN data—keep regional EMUs in high demand. CAF competes on lower lifecycle cost and modular platforms, winning high-visibility fleet contracts across Europe. Growth is strong, forcing upfront cash for tooling and launches that pressures margins. Maintain reliability and the installed EMU base converts into recurring, self-funding service and retrofit revenue.
CBTC/ETCS signaling tied to rolling stock
CBTC/ETCS signaling tied to rolling stock is a Star for CAF as digital train control scales rapidly and CAF increasingly wins bundled vehicle-plus-signaling packages; market penetration in targeted tenders is rising while deliveries remain capital- and talent-intensive. Revenues can grow quickly from these integrated contracts, with margins maturing later as productization and references accumulate. Continued investment in product platforms and reference projects is required to lock leadership and convert share gains into sustainable profitability.
- High growth: rising share in targeted tenders
- Capital/talent intensity: high upfront investment
- Revenue profile: fast top-line growth, delayed margin expansion
- Strategy: productize, secure references, scale delivery
International turnkey projects in Latin America & MEA
Pipeline is buoyant and CAF is a recognizable prime; 2024 order backlog ~€5.2bn with >€1bn in LATAM/MEA turnkey awards. Projects are large, complex and cash-hungry in early phases, and market growth plus visible 2024 wins position this as a Star today. Double down on tightened risk controls and working-capital strategies to convert delivery into long-run dominance.
- Star: buoyant pipeline, strong 2024 backlog
- Risk: capital intensity early; require cash buffers
- Action: strengthen contract risk, performance bonds, KPIs
Rolling stock: convert €5.2bn backlog to service annuities
CAF Stars (rolling stock, Urbos, EMUs, CBTC/ETCS) drive fast top-line growth but demand high upfront capex and working capital; 2023 revenue ~€2.6bn and 2024 backlog ~€5.2bn with >€1bn in LATAM/MEA. Continue investing, productize platforms, tighten contract risk and convert scale into service annuities.
| Metric | Value |
|---|---|
| 2023 Revenue | €2.6bn |
| 2024 Backlog | €5.2bn |
| LATAM/MEA Awards 2024 | >€1bn |
What is included in the product
Detailed Word Document
CAF BCG Matrix: quadrant-by-quadrant review with investment guidance, risks, and trend context to prioritize units.
Customizable Excel Spreadsheet
One-page CAF BCG Matrix that clarifies priorities, easing analysis paralysis for faster decisions
Cash Cows
Long-term maintenance & availability contracts
Long-term maintenance and availability contracts are a mature, high-share base delivering predictable cash flow, with renewal rates typically above 80-90% and gross margins often in the 40-60% range. Low market growth is offset by uptime SLAs (commonly 99.9%) and renewal/uptime bonuses that keep margins healthy. Promotion needs are modest; execution quality and retention drive value. Milk the installed base and invest in tooling to boost throughput and lower cost per ticket.
Spare parts and lifecycle services
Spare parts and lifecycle services leverage CAF’s large installed fleet and order backlog >€6bn (FY2023), guaranteeing steady spares demand. Market growth is low while CAF holds high share and strong gross-margin mix, with rail aftermarket gross margins typically >30%. Cash inflows from services reliably exceed outflows, funding capex and dividends. Optimizing inventory turns and dynamic pricing can widen the cash funnel further.
Fleet overhauls and midlife refurbishments
Fleet overhauls and midlife refurbishments are recurring, pan‑European programs with stable demand where CAF leverages platform know‑how to secure long contracts; CAF reported €3.7bn revenue in 2023 with services representing roughly 20% of group turnover. Minimal promotion, high shop utilization (around 90%) and solid aftermarket margins make this a cash cow. Adding automation and digital diagnostics can boost throughput and squeeze more cash per slot.
Core components (bogies, doors, traction spares)
Core components (bogies, doors, traction spares) are cash cows for CAF, holding a high share across CAF platforms and partner fleets and delivering repeatable specs and dependable returns in 2024. The market is mature, investments are incremental and focused on lifecycle upgrades, while SKU standardization and frame agreements keep unit economics stable.
- High share across fleets
- Mature, repeatable demand
- Incremental capex only
- Standardize SKUs, lock frame agreements
EU replacement trams/metros on proven platforms
Replacement cycles in EU trams/metros favor incumbents with strong references; CAF in 2024 leverages proven platforms to secure repeat orders, with EU replacement demand estimated at c.€3–4bn p.a. and modest market growth (~2–3% CAGR).
Market share is high on proven platforms, margins are tidy (order-level EBITDA typically mid-single digits to low double-digits), sales and engineering costs lower than turnkey new lines, so strategy is maintain position and quietly harvest.
- High share: strong reference fleets across EU
- Growth: modest ~2–3% CAGR (2024 outlook)
- Demand: ~€3–4bn p.a. replacement market (2024)
- Margins: mid-single to low-double-digit EBITDA on rolling stock
- Go-to-market: low sales cost vs new turnkey lines
Aftermarket cash engine — backlog >€6bn; revenue €3.7bn; margins >30%
CAF cash cows—maintenance, spares, midlife overhauls and core components—deliver predictable high-share cash flow: backlog >€6bn (FY2023), group revenue €3.7bn (2023) with services ~20%, aftermarket margins typically >30%, and EU replacement market ~€3–4bn p.a. (2024) with ~2–3% CAGR; focus on retention, SKU standardization and throughput improvements to harvest cash.
| Metric | Value |
|---|---|
| Backlog (FY2023) | €>6bn |
| Revenue (2023) | €3.7bn |
| Services % | ~20% |
| Aftermarket margin | >30% |
| EU replacement | €3–4bn p.a. |
What You’re Viewing Is Included
CAF BCG Matrix
The file you're previewing is the final CAF BCG Matrix report you'll receive after purchase. No watermarks or demo content — just a fully formatted, strategy-ready matrix tailored for portfolio analysis. Once bought, the same editable document is yours to download, present, or print immediately. Clear, precise, and production-ready.











