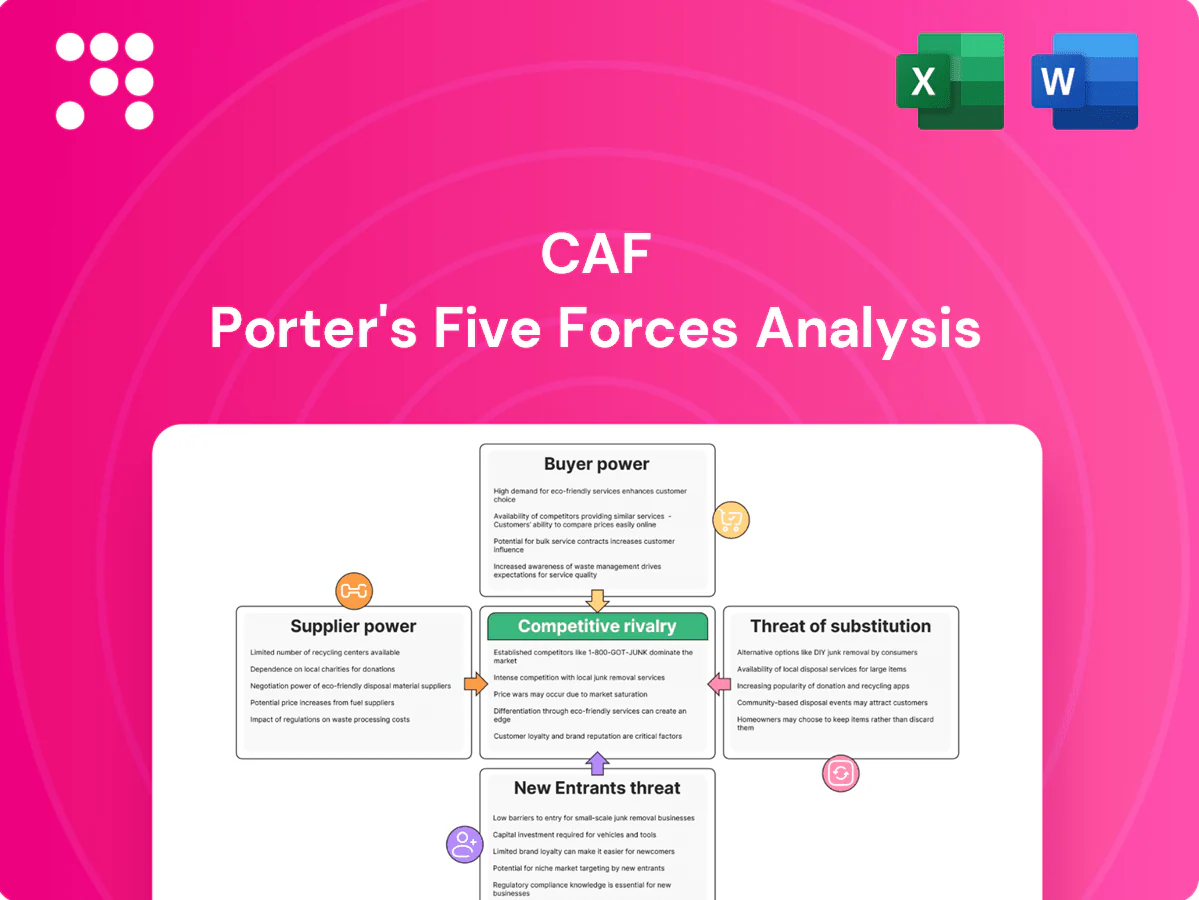
CAF Porter's Five Forces Analysis

From Overview to Strategy Blueprint
This snapshot outlines CAF's Porter's Five Forces—buyer/supplier power, competitive rivalry, threat of new entrants and substitutes—and highlights key pressures shaping margins and growth. The full report quantifies each force, adds visuals and scenario implications, and pinpoints strategic responses. Unlock the complete analysis to inform investment or strategic decisions.
Suppliers Bargaining Power

Concentrated critical components
CAF relies on specialized suppliers for traction systems, bogies, braking and signaling electronics concentrated among global firms such as Siemens, Alstom, Knorr‑Bremse and Wabtec, which elevates supplier leverage on price and delivery terms. Lead times often exceed 12 months, increasing dependency risk. CAF mitigates via dual‑sourcing and selective in‑house capability development. Rigorous qualification and safety standards further limit switching options.
Raw materials volatility
Steel (~850 USD/ton in 2024), aluminum (~2,300 USD/ton) and copper (~10,000 USD/ton) and composite inputs drive CAF’s costs and are subject to commodity swings that allow suppliers to pass through price rises, squeezing margins on fixed-price contracts. CAF mitigates exposure via hedges and indexation clauses tied to metal benchmarks. Long lead times and tight quality specs limit rapid supplier substitution, sustaining supplier bargaining power.

Semiconductor and software dependence
Modern rolling stock relies on semiconductors, power electronics and embedded software, and 2024 industry lead times often exceed 20 weeks, creating cyclical shortages. Tier-2 and Tier-3 electronic suppliers can become bottlenecks, delaying projects by months. CAF holds buffer inventories (typically 3–6 months) and redesigns around available parts when feasible. Cybersecurity requirements and software licensing add ongoing supplier leverage and recurring costs to fleet contracts.

Certification and switching costs
Suppliers face rigorous rail safety and interoperability certifications that typically take 6–18 months and raise onboarding costs materially; requalification after integration can run into multi-million-euro programmes, creating high switching costs for CAF and strengthening incumbent suppliers’ bargaining power. Long-term framework agreements covering up to ~60–70% of procurement spend partially rebalance terms and reduce spot-price exposure in 2024.
- Certification time: 6–18 months
- Requalification: multi-million-euro impact
- Switching costs: high lock-in
- Framework coverage: ~60–70% (2024)
Geopolitical and logistics risk
Supplier concentration, >12m lead times and commodity spikes elevate pass-through risk
Supplier concentration (Siemens, Alstom, Knorr‑Bremse, Wabtec) and long lead times (>12 months; semiconductors ~20 weeks) give high leverage, compounded by certification-driven switching costs (6–18 months). Commodity pressure (steel 850 USD/t, Al 2,300 USD/t, Cu 10,000 USD/t) and sea‑dependent logistics raise pass‑through risk; framework coverage (~60–70%) and hedges partially mitigate.
| Metric | 2024 | Impact |
|---|---|---|
| Supplier concentration | Top 4 | High |
| Steel | 850 USD/t | Margin pressure |
| Lead time (traction) | >12 months | Dependency |
| Semiconductor LT | ~20 weeks | Bottleneck |
| Framework coverage | 60–70% | Risk reduction |
What is included in the product
 Detailed Word Document
Comprehensive Porter's Five Forces analysis tailored to CAF, assessing competitive rivalry, supplier and buyer power, entry barriers, and substitute threats to reveal strategic levers, emerging disruptions, and implications for pricing, profitability, and market positioning; fully editable for inclusion in investor reports, strategy decks, or academic projects.

 Customizable Excel Spreadsheet
Fast, actionable Porter's Five Forces for CAF that reduces analysis time—customize pressure levels, swap in your data, and export a clean one-sheet for decks or dashboards without macros or coding.
Customers Bargaining Power

Few, large institutional buyers
National operators and city authorities consolidate purchases into large tenders, concentrating demand and giving buyers strong leverage over price and technical specifications. CAF must bid aggressively and tailor rolling-stock packages per tender, often offering lifecycle services and financing to win contracts. Proven delivery, references and safety records act as strict gatekeepers when awarding multi-year, high-value procurements.
Lifecycle cost focus
Buyers now prioritize total cost of ownership over 20–30 year horizons, with energy and maintenance typically accounting for roughly 70–80% of lifecycle costs; fleet energy upgrades can cut consumption by up to 30% versus legacy stock. This shifts negotiations from capex to performance guarantees and strict availability SLAs. CAF must offer service contracts and warranties with clear availability targets and penalties—commonly 1–3% of contract value—boosting buyer leverage.

Customization and compliance demands
Operators demand bespoke configurations and strict standards (ETCS, CBTC, accessibility), driving CAF engineering effort and raising project risk; CAF reported a 2024 order backlog above €4bn, concentrating customization pressure. Buyers leverage detailed specs to differentiate bids and accelerate delivery timelines, increasing penalty exposure. Modular platform strategies have reduced scope creep and cut integration hours by an estimated 15–20% on recent contracts.

Financing and local content clauses
Many 2024 rail tenders mandate financing packages, offsets or local manufacturing, enabling buyers to push favorable payment terms and 20–40% localization requirements; CAF addresses this by partnering with financiers and establishing local assembly lines to comply. These clauses increase cost and complexity, strengthening buyer bargaining power and pressuring margins.
- 2024: common local content 20–40%
- CAF response: financier partnerships, local assembly
- Effect: higher compliance cost, stronger buyer leverage
Transparent tendering and re-bids
Transparent public procurement (OECD estimates public procurement at about 12% of GDP) enforces open scoring and formal challenges, letting buyers cancel or re-run tenders to improve terms. CAF faces acute price pressure and must keep bids competitive, often accepting low single-digit margins. Post-award change orders are tightly controlled, limiting margin recovery.
- Transparent scoring: enables challenges and re-bids
- Buyer leverage: tenders can be canceled/rerun to drive prices down
- CAF impact: competitive bids, compressed margins (low single digits)
- Change orders: restricted, reducing opportunities to recoup costs
National buyers demand 20–30y TCO focus and 20–40% local content; backlog >€4bn
National buyers consolidate tenders, forcing CAF to bid competitively and offer lifecycle services; 2024 backlog >€4bn raises customization pressure.
Buyers focus on 20–30y TCO (energy+maintenance ~70–80%); energy upgrades can cut consumption up to 30%, shifting negotiation to SLAs with 1–3% penalty regimes.
2024 tenders often require 20–40% local content and financing, compressing margins to low single digits; public procurement ≈12% GDP.
| Metric | 2024 value |
|---|---|
| CAF backlog | €>4bn |
| TCO share (energy+maint) | 70–80% |
| Energy saving (upgrades) | up to 30% |
| Local content | 20–40% |
| Penalty rates | 1–3% |
Preview Before You Purchase
CAF Porter's Five Forces Analysis
This preview shows the exact CAF Porter's Five Forces Analysis you'll receive—no mockups or placeholders. The document is fully formatted, professionally written, and ready for immediate download the moment you purchase. What you see here is the actual deliverable, complete and useable without further setup or customization.

From Overview to Strategy Blueprint
This snapshot outlines CAF's Porter's Five Forces—buyer/supplier power, competitive rivalry, threat of new entrants and substitutes—and highlights key pressures shaping margins and growth. The full report quantifies each force, adds visuals and scenario implications, and pinpoints strategic responses. Unlock the complete analysis to inform investment or strategic decisions.
Suppliers Bargaining Power
Concentrated critical components
CAF relies on specialized suppliers for traction systems, bogies, braking and signaling electronics concentrated among global firms such as Siemens, Alstom, Knorr‑Bremse and Wabtec, which elevates supplier leverage on price and delivery terms. Lead times often exceed 12 months, increasing dependency risk. CAF mitigates via dual‑sourcing and selective in‑house capability development. Rigorous qualification and safety standards further limit switching options.
Raw materials volatility
Steel (~850 USD/ton in 2024), aluminum (~2,300 USD/ton) and copper (~10,000 USD/ton) and composite inputs drive CAF’s costs and are subject to commodity swings that allow suppliers to pass through price rises, squeezing margins on fixed-price contracts. CAF mitigates exposure via hedges and indexation clauses tied to metal benchmarks. Long lead times and tight quality specs limit rapid supplier substitution, sustaining supplier bargaining power.
Semiconductor and software dependence
Modern rolling stock relies on semiconductors, power electronics and embedded software, and 2024 industry lead times often exceed 20 weeks, creating cyclical shortages. Tier-2 and Tier-3 electronic suppliers can become bottlenecks, delaying projects by months. CAF holds buffer inventories (typically 3–6 months) and redesigns around available parts when feasible. Cybersecurity requirements and software licensing add ongoing supplier leverage and recurring costs to fleet contracts.
Certification and switching costs
Suppliers face rigorous rail safety and interoperability certifications that typically take 6–18 months and raise onboarding costs materially; requalification after integration can run into multi-million-euro programmes, creating high switching costs for CAF and strengthening incumbent suppliers’ bargaining power. Long-term framework agreements covering up to ~60–70% of procurement spend partially rebalance terms and reduce spot-price exposure in 2024.
- Certification time: 6–18 months
- Requalification: multi-million-euro impact
- Switching costs: high lock-in
- Framework coverage: ~60–70% (2024)
Geopolitical and logistics risk
Supplier concentration, >12m lead times and commodity spikes elevate pass-through risk
Supplier concentration (Siemens, Alstom, Knorr‑Bremse, Wabtec) and long lead times (>12 months; semiconductors ~20 weeks) give high leverage, compounded by certification-driven switching costs (6–18 months). Commodity pressure (steel 850 USD/t, Al 2,300 USD/t, Cu 10,000 USD/t) and sea‑dependent logistics raise pass‑through risk; framework coverage (~60–70%) and hedges partially mitigate.
| Metric | 2024 | Impact |
|---|---|---|
| Supplier concentration | Top 4 | High |
| Steel | 850 USD/t | Margin pressure |
| Lead time (traction) | >12 months | Dependency |
| Semiconductor LT | ~20 weeks | Bottleneck |
| Framework coverage | 60–70% | Risk reduction |
What is included in the product
Detailed Word Document
Comprehensive Porter's Five Forces analysis tailored to CAF, assessing competitive rivalry, supplier and buyer power, entry barriers, and substitute threats to reveal strategic levers, emerging disruptions, and implications for pricing, profitability, and market positioning; fully editable for inclusion in investor reports, strategy decks, or academic projects.
Customizable Excel Spreadsheet
Fast, actionable Porter's Five Forces for CAF that reduces analysis time—customize pressure levels, swap in your data, and export a clean one-sheet for decks or dashboards without macros or coding.
Customers Bargaining Power
Few, large institutional buyers
National operators and city authorities consolidate purchases into large tenders, concentrating demand and giving buyers strong leverage over price and technical specifications. CAF must bid aggressively and tailor rolling-stock packages per tender, often offering lifecycle services and financing to win contracts. Proven delivery, references and safety records act as strict gatekeepers when awarding multi-year, high-value procurements.
Lifecycle cost focus
Buyers now prioritize total cost of ownership over 20–30 year horizons, with energy and maintenance typically accounting for roughly 70–80% of lifecycle costs; fleet energy upgrades can cut consumption by up to 30% versus legacy stock. This shifts negotiations from capex to performance guarantees and strict availability SLAs. CAF must offer service contracts and warranties with clear availability targets and penalties—commonly 1–3% of contract value—boosting buyer leverage.
Customization and compliance demands
Operators demand bespoke configurations and strict standards (ETCS, CBTC, accessibility), driving CAF engineering effort and raising project risk; CAF reported a 2024 order backlog above €4bn, concentrating customization pressure. Buyers leverage detailed specs to differentiate bids and accelerate delivery timelines, increasing penalty exposure. Modular platform strategies have reduced scope creep and cut integration hours by an estimated 15–20% on recent contracts.
Financing and local content clauses
Many 2024 rail tenders mandate financing packages, offsets or local manufacturing, enabling buyers to push favorable payment terms and 20–40% localization requirements; CAF addresses this by partnering with financiers and establishing local assembly lines to comply. These clauses increase cost and complexity, strengthening buyer bargaining power and pressuring margins.
- 2024: common local content 20–40%
- CAF response: financier partnerships, local assembly
- Effect: higher compliance cost, stronger buyer leverage
Transparent tendering and re-bids
Transparent public procurement (OECD estimates public procurement at about 12% of GDP) enforces open scoring and formal challenges, letting buyers cancel or re-run tenders to improve terms. CAF faces acute price pressure and must keep bids competitive, often accepting low single-digit margins. Post-award change orders are tightly controlled, limiting margin recovery.
- Transparent scoring: enables challenges and re-bids
- Buyer leverage: tenders can be canceled/rerun to drive prices down
- CAF impact: competitive bids, compressed margins (low single digits)
- Change orders: restricted, reducing opportunities to recoup costs
National buyers demand 20–30y TCO focus and 20–40% local content; backlog >€4bn
National buyers consolidate tenders, forcing CAF to bid competitively and offer lifecycle services; 2024 backlog >€4bn raises customization pressure.
Buyers focus on 20–30y TCO (energy+maintenance ~70–80%); energy upgrades can cut consumption up to 30%, shifting negotiation to SLAs with 1–3% penalty regimes.
2024 tenders often require 20–40% local content and financing, compressing margins to low single digits; public procurement ≈12% GDP.
| Metric | 2024 value |
|---|---|
| CAF backlog | €>4bn |
| TCO share (energy+maint) | 70–80% |
| Energy saving (upgrades) | up to 30% |
| Local content | 20–40% |
| Penalty rates | 1–3% |
Preview Before You Purchase
CAF Porter's Five Forces Analysis
This preview shows the exact CAF Porter's Five Forces Analysis you'll receive—no mockups or placeholders. The document is fully formatted, professionally written, and ready for immediate download the moment you purchase. What you see here is the actual deliverable, complete and useable without further setup or customization.
Original: $10.00
-65%$10.00
$3.50Description
From Overview to Strategy Blueprint
This snapshot outlines CAF's Porter's Five Forces—buyer/supplier power, competitive rivalry, threat of new entrants and substitutes—and highlights key pressures shaping margins and growth. The full report quantifies each force, adds visuals and scenario implications, and pinpoints strategic responses. Unlock the complete analysis to inform investment or strategic decisions.
Suppliers Bargaining Power
Concentrated critical components
CAF relies on specialized suppliers for traction systems, bogies, braking and signaling electronics concentrated among global firms such as Siemens, Alstom, Knorr‑Bremse and Wabtec, which elevates supplier leverage on price and delivery terms. Lead times often exceed 12 months, increasing dependency risk. CAF mitigates via dual‑sourcing and selective in‑house capability development. Rigorous qualification and safety standards further limit switching options.
Raw materials volatility
Steel (~850 USD/ton in 2024), aluminum (~2,300 USD/ton) and copper (~10,000 USD/ton) and composite inputs drive CAF’s costs and are subject to commodity swings that allow suppliers to pass through price rises, squeezing margins on fixed-price contracts. CAF mitigates exposure via hedges and indexation clauses tied to metal benchmarks. Long lead times and tight quality specs limit rapid supplier substitution, sustaining supplier bargaining power.
Semiconductor and software dependence
Modern rolling stock relies on semiconductors, power electronics and embedded software, and 2024 industry lead times often exceed 20 weeks, creating cyclical shortages. Tier-2 and Tier-3 electronic suppliers can become bottlenecks, delaying projects by months. CAF holds buffer inventories (typically 3–6 months) and redesigns around available parts when feasible. Cybersecurity requirements and software licensing add ongoing supplier leverage and recurring costs to fleet contracts.
Certification and switching costs
Suppliers face rigorous rail safety and interoperability certifications that typically take 6–18 months and raise onboarding costs materially; requalification after integration can run into multi-million-euro programmes, creating high switching costs for CAF and strengthening incumbent suppliers’ bargaining power. Long-term framework agreements covering up to ~60–70% of procurement spend partially rebalance terms and reduce spot-price exposure in 2024.
- Certification time: 6–18 months
- Requalification: multi-million-euro impact
- Switching costs: high lock-in
- Framework coverage: ~60–70% (2024)
Geopolitical and logistics risk
Supplier concentration, >12m lead times and commodity spikes elevate pass-through risk
Supplier concentration (Siemens, Alstom, Knorr‑Bremse, Wabtec) and long lead times (>12 months; semiconductors ~20 weeks) give high leverage, compounded by certification-driven switching costs (6–18 months). Commodity pressure (steel 850 USD/t, Al 2,300 USD/t, Cu 10,000 USD/t) and sea‑dependent logistics raise pass‑through risk; framework coverage (~60–70%) and hedges partially mitigate.
| Metric | 2024 | Impact |
|---|---|---|
| Supplier concentration | Top 4 | High |
| Steel | 850 USD/t | Margin pressure |
| Lead time (traction) | >12 months | Dependency |
| Semiconductor LT | ~20 weeks | Bottleneck |
| Framework coverage | 60–70% | Risk reduction |
What is included in the product
Detailed Word Document
Comprehensive Porter's Five Forces analysis tailored to CAF, assessing competitive rivalry, supplier and buyer power, entry barriers, and substitute threats to reveal strategic levers, emerging disruptions, and implications for pricing, profitability, and market positioning; fully editable for inclusion in investor reports, strategy decks, or academic projects.
Customizable Excel Spreadsheet
Fast, actionable Porter's Five Forces for CAF that reduces analysis time—customize pressure levels, swap in your data, and export a clean one-sheet for decks or dashboards without macros or coding.
Customers Bargaining Power
Few, large institutional buyers
National operators and city authorities consolidate purchases into large tenders, concentrating demand and giving buyers strong leverage over price and technical specifications. CAF must bid aggressively and tailor rolling-stock packages per tender, often offering lifecycle services and financing to win contracts. Proven delivery, references and safety records act as strict gatekeepers when awarding multi-year, high-value procurements.
Lifecycle cost focus
Buyers now prioritize total cost of ownership over 20–30 year horizons, with energy and maintenance typically accounting for roughly 70–80% of lifecycle costs; fleet energy upgrades can cut consumption by up to 30% versus legacy stock. This shifts negotiations from capex to performance guarantees and strict availability SLAs. CAF must offer service contracts and warranties with clear availability targets and penalties—commonly 1–3% of contract value—boosting buyer leverage.
Customization and compliance demands
Operators demand bespoke configurations and strict standards (ETCS, CBTC, accessibility), driving CAF engineering effort and raising project risk; CAF reported a 2024 order backlog above €4bn, concentrating customization pressure. Buyers leverage detailed specs to differentiate bids and accelerate delivery timelines, increasing penalty exposure. Modular platform strategies have reduced scope creep and cut integration hours by an estimated 15–20% on recent contracts.
Financing and local content clauses
Many 2024 rail tenders mandate financing packages, offsets or local manufacturing, enabling buyers to push favorable payment terms and 20–40% localization requirements; CAF addresses this by partnering with financiers and establishing local assembly lines to comply. These clauses increase cost and complexity, strengthening buyer bargaining power and pressuring margins.
- 2024: common local content 20–40%
- CAF response: financier partnerships, local assembly
- Effect: higher compliance cost, stronger buyer leverage
Transparent tendering and re-bids
Transparent public procurement (OECD estimates public procurement at about 12% of GDP) enforces open scoring and formal challenges, letting buyers cancel or re-run tenders to improve terms. CAF faces acute price pressure and must keep bids competitive, often accepting low single-digit margins. Post-award change orders are tightly controlled, limiting margin recovery.
- Transparent scoring: enables challenges and re-bids
- Buyer leverage: tenders can be canceled/rerun to drive prices down
- CAF impact: competitive bids, compressed margins (low single digits)
- Change orders: restricted, reducing opportunities to recoup costs
National buyers demand 20–30y TCO focus and 20–40% local content; backlog >€4bn
National buyers consolidate tenders, forcing CAF to bid competitively and offer lifecycle services; 2024 backlog >€4bn raises customization pressure.
Buyers focus on 20–30y TCO (energy+maintenance ~70–80%); energy upgrades can cut consumption up to 30%, shifting negotiation to SLAs with 1–3% penalty regimes.
2024 tenders often require 20–40% local content and financing, compressing margins to low single digits; public procurement ≈12% GDP.
| Metric | 2024 value |
|---|---|
| CAF backlog | €>4bn |
| TCO share (energy+maint) | 70–80% |
| Energy saving (upgrades) | up to 30% |
| Local content | 20–40% |
| Penalty rates | 1–3% |
Preview Before You Purchase
CAF Porter's Five Forces Analysis
This preview shows the exact CAF Porter's Five Forces Analysis you'll receive—no mockups or placeholders. The document is fully formatted, professionally written, and ready for immediate download the moment you purchase. What you see here is the actual deliverable, complete and useable without further setup or customization.











