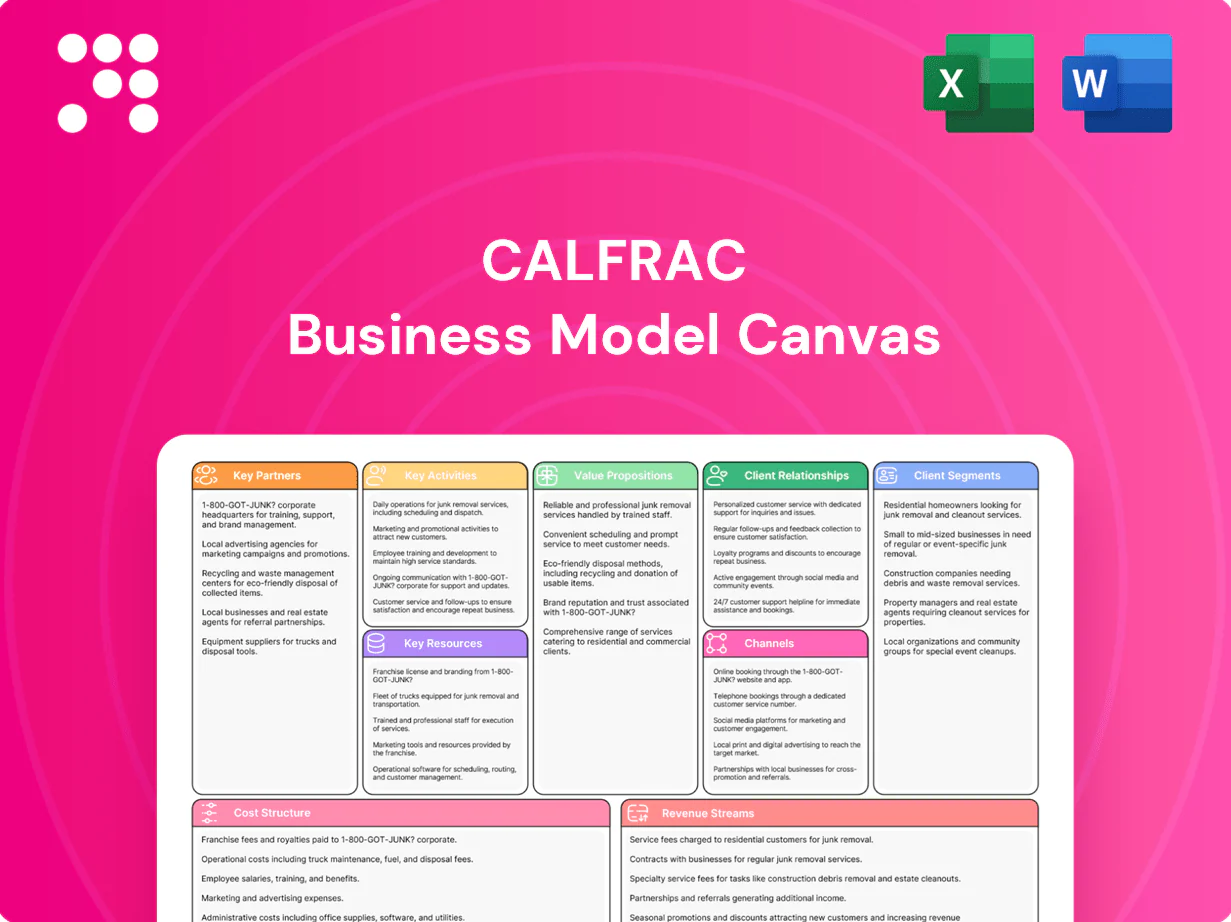
Calfrac Business Model Canvas

Unlock the strategic playbook with a concise Business Model Canvas
Unlock Calfrac's strategic playbook with our Business Model Canvas. This concise, actionable framework reveals the company's value propositions, key partnerships, cost structure and revenue levers to help investors and strategists pinpoint growth and risk. Purchase the full, editable Canvas in Word and Excel to apply these insights directly.
Partnerships

E&P operators and supermajors
Anchor relationships with E&P operators and supermajors across Canada, the US and Argentina secure pad-level collaboration on development and stimulation design, enabling multi-year service programs. Aligning schedules and KPIs with partners maximizes well productivity and reduces NPT through coordinated crews and shared targets. Master service agreements provide continuity and volume visibility to support multi-season planning and capital allocation.
Equipment OEMs and technology vendors
Partner with pump, blender, powertrain and data-logging OEMs to co-develop reliability upgrades, fuel-flex solutions and digital controls; Calfrac’s 2024 fleet modernization pilots cut fuel consumption and emissions intensity by 12% while improving uptime. Secure priority access to parts and field service to reduce lead times and maintenance costs, and pilot new tech that lowers per-job operating costs and CO2 output.

Chemical and proppant suppliers
Calfrac partners with frac sand, resin-coated proppant and chemistry providers to secure tailored fluid systems for each formation while actively managing cost per stage. In 2024 the company emphasized just-in-time delivery to wellsites and regional terminals to minimize inventory and downtime. Volume-based pricing and contingency supply agreements underpin reliability and cost predictability across campaigns.

Logistics and infrastructure partners
Engage rail, trucking, transload terminals and storage yards to centralize inbound sand, fuel and water logistics, optimizing last-mile sand delivery and on-site water handling to reduce mobilization delays. Improve turnaround times and cut demurrage and standby through coordinated scheduling and shared KPI-driven dispatch. Implement real-time data sharing for inventory visibility, ETA tracking and dynamic load reallocation to boost fleet utilization.
- rail integration
- last-mile sand delivery
- fuel & water handling
- reduced demurrage/standby
- real-time inventory & dispatch
Regulators and local communities
Regulators and local communities ensure Calfrac maintains strict compliance with environmental, safety, and labor regulations while building trust through proactive community engagement and transparent, responsible operations. Coordination on permits, road use, and noise/traffic mitigation minimizes disruptions to residents and operations. Prioritizing local hiring and supplier development strengthens social license and reduces operational risk.
- Compliance focus: environmental, safety, labor
- Community engagement: trust-building, transparency
- Operational coordination: permits, road use, noise/traffic
- Local economic impact: hiring and supplier development
Operator partnerships align KPIs, cut NPT; fleet pilots cut 12% fuel/emissions
Calfrac’s anchor E&P and supermajor partnerships secure multi-year pad programs and MSA-backed volume visibility, aligning KPIs to cut NPT and improve crew utilization. 2024 fleet modernization pilots reduced fuel consumption and emissions intensity by 12% while improving uptime. Supply and logistics partners enabled JIT sand delivery and real-time dispatch to minimize downtime.
| Partner type | 2024 impact |
|---|---|
| Operators/MSAs | Multi-year programs, KPI alignment |
| OEMs | 12% fuel/emissions reduction |
| Logistics/sand | JIT delivery, reduced downtime |
What is included in the product
 Detailed Word Document
A complete Business Model Canvas for Calfrac detailing customer segments, value propositions, channels, key activities and assets (fleet and services), revenue streams and cost structure across the nine BMC blocks, with linked SWOT and competitive advantages—ideal for presentations, investor discussions, and strategic decision-making.

 Customizable Excel Spreadsheet
Condenses Calfrac’s operations, customer segments, and revenue drivers into a clean, editable one-page canvas that saves hours of analysis and helps teams quickly align on strategy and operational pain points.
Activities

Hydraulic fracturing operations
Plan, mobilize and execute multi-stage stimulation jobs across Calfrac’s 2024 operating programs, managing pumping schedules, pressures and fluid systems to meet engineered designs. Coordinate crews, sand, water and chemicals to sustain continuous pumping and minimize downtime. Capture detailed job data in 2024 to refine designs, improve efficiency and control per-job costs.
Coiled tubing and well intervention
Deliver millouts, cleanouts and post-frac interventions with rapid rig-up/rig-down to ensure safe, efficient operations; 2024 field case studies show coiled tubing integrations yielding 10–20% production uplift when CT data is correlated with frac outcomes. Focus on minimizing downtime between stages—targeting sub-12-hour turnarounds—to accelerate cycle times and improve well economics.

Cementing and zonal isolation
Provide primary and remedial cementing to ensure zonal isolation and long-term well integrity, tailoring operations to casing and formation needs. Engineer slurries for temperature, pressure and formation conditions, leveraging lab-validated mixes and field optimization. Coordinate with drilling and completions timelines and verify placement quality with pressure tests and cement bond/ultrasonic logging; the global well cementing market was estimated near USD 4.3B in 2024.

Fleet maintenance and reliability
HSE, compliance, and training
Implement safety programs that meet client and regulatory standards, train crews on procedures, equipment, and hazard controls, and track incidents, audits, and corrective actions to ensure accountability. Drive continuous improvement initiatives focused on lowering total recordable injury frequency and reducing environmental impact through operational changes and learnings.
- HSE program alignment
- Crew training & competency
- Incident/audit tracking
- Continuous TRIF & emissions reduction
2024 fracs: crews, sands, fluids, sub-12h turnarounds, CT uplift 10–20%
Plan and execute multi-stage stimulation across 2024 programs, managing schedules, pressures and fluids to meet designs. Coordinate crews, sand, water and chemicals to sustain continuous pumping and minimize downtime. Deliver post-frac interventions and cementing, targeting sub-12-hour turnarounds and leveraging CT correlations (2024 CT-linked uplift 10–20%, global cementing market ~USD 4.3B).
| Activity | 2024 Metric |
|---|---|
| CT-related uplift | 10–20% |
| Turnaround target | sub-12 hours |
| Global cementing market | ~USD 4.3B |
Delivered as Displayed
Business Model Canvas
The Calfrac Business Model Canvas previewed here is the exact document you will receive — not a mockup. Upon purchase you’ll download the complete file, formatted and ready to edit in Word and Excel. No hidden pages, no placeholders.

Unlock the strategic playbook with a concise Business Model Canvas
Unlock Calfrac's strategic playbook with our Business Model Canvas. This concise, actionable framework reveals the company's value propositions, key partnerships, cost structure and revenue levers to help investors and strategists pinpoint growth and risk. Purchase the full, editable Canvas in Word and Excel to apply these insights directly.
Partnerships
E&P operators and supermajors
Anchor relationships with E&P operators and supermajors across Canada, the US and Argentina secure pad-level collaboration on development and stimulation design, enabling multi-year service programs. Aligning schedules and KPIs with partners maximizes well productivity and reduces NPT through coordinated crews and shared targets. Master service agreements provide continuity and volume visibility to support multi-season planning and capital allocation.
Equipment OEMs and technology vendors
Partner with pump, blender, powertrain and data-logging OEMs to co-develop reliability upgrades, fuel-flex solutions and digital controls; Calfrac’s 2024 fleet modernization pilots cut fuel consumption and emissions intensity by 12% while improving uptime. Secure priority access to parts and field service to reduce lead times and maintenance costs, and pilot new tech that lowers per-job operating costs and CO2 output.
Chemical and proppant suppliers
Calfrac partners with frac sand, resin-coated proppant and chemistry providers to secure tailored fluid systems for each formation while actively managing cost per stage. In 2024 the company emphasized just-in-time delivery to wellsites and regional terminals to minimize inventory and downtime. Volume-based pricing and contingency supply agreements underpin reliability and cost predictability across campaigns.
Logistics and infrastructure partners
Engage rail, trucking, transload terminals and storage yards to centralize inbound sand, fuel and water logistics, optimizing last-mile sand delivery and on-site water handling to reduce mobilization delays. Improve turnaround times and cut demurrage and standby through coordinated scheduling and shared KPI-driven dispatch. Implement real-time data sharing for inventory visibility, ETA tracking and dynamic load reallocation to boost fleet utilization.
- rail integration
- last-mile sand delivery
- fuel & water handling
- reduced demurrage/standby
- real-time inventory & dispatch
Regulators and local communities
Regulators and local communities ensure Calfrac maintains strict compliance with environmental, safety, and labor regulations while building trust through proactive community engagement and transparent, responsible operations. Coordination on permits, road use, and noise/traffic mitigation minimizes disruptions to residents and operations. Prioritizing local hiring and supplier development strengthens social license and reduces operational risk.
- Compliance focus: environmental, safety, labor
- Community engagement: trust-building, transparency
- Operational coordination: permits, road use, noise/traffic
- Local economic impact: hiring and supplier development
Operator partnerships align KPIs, cut NPT; fleet pilots cut 12% fuel/emissions
Calfrac’s anchor E&P and supermajor partnerships secure multi-year pad programs and MSA-backed volume visibility, aligning KPIs to cut NPT and improve crew utilization. 2024 fleet modernization pilots reduced fuel consumption and emissions intensity by 12% while improving uptime. Supply and logistics partners enabled JIT sand delivery and real-time dispatch to minimize downtime.
| Partner type | 2024 impact |
|---|---|
| Operators/MSAs | Multi-year programs, KPI alignment |
| OEMs | 12% fuel/emissions reduction |
| Logistics/sand | JIT delivery, reduced downtime |
What is included in the product
Detailed Word Document
A complete Business Model Canvas for Calfrac detailing customer segments, value propositions, channels, key activities and assets (fleet and services), revenue streams and cost structure across the nine BMC blocks, with linked SWOT and competitive advantages—ideal for presentations, investor discussions, and strategic decision-making.
Customizable Excel Spreadsheet
Condenses Calfrac’s operations, customer segments, and revenue drivers into a clean, editable one-page canvas that saves hours of analysis and helps teams quickly align on strategy and operational pain points.
Activities
Hydraulic fracturing operations
Plan, mobilize and execute multi-stage stimulation jobs across Calfrac’s 2024 operating programs, managing pumping schedules, pressures and fluid systems to meet engineered designs. Coordinate crews, sand, water and chemicals to sustain continuous pumping and minimize downtime. Capture detailed job data in 2024 to refine designs, improve efficiency and control per-job costs.
Coiled tubing and well intervention
Deliver millouts, cleanouts and post-frac interventions with rapid rig-up/rig-down to ensure safe, efficient operations; 2024 field case studies show coiled tubing integrations yielding 10–20% production uplift when CT data is correlated with frac outcomes. Focus on minimizing downtime between stages—targeting sub-12-hour turnarounds—to accelerate cycle times and improve well economics.
Cementing and zonal isolation
Provide primary and remedial cementing to ensure zonal isolation and long-term well integrity, tailoring operations to casing and formation needs. Engineer slurries for temperature, pressure and formation conditions, leveraging lab-validated mixes and field optimization. Coordinate with drilling and completions timelines and verify placement quality with pressure tests and cement bond/ultrasonic logging; the global well cementing market was estimated near USD 4.3B in 2024.
Fleet maintenance and reliability
HSE, compliance, and training
Implement safety programs that meet client and regulatory standards, train crews on procedures, equipment, and hazard controls, and track incidents, audits, and corrective actions to ensure accountability. Drive continuous improvement initiatives focused on lowering total recordable injury frequency and reducing environmental impact through operational changes and learnings.
- HSE program alignment
- Crew training & competency
- Incident/audit tracking
- Continuous TRIF & emissions reduction
2024 fracs: crews, sands, fluids, sub-12h turnarounds, CT uplift 10–20%
Plan and execute multi-stage stimulation across 2024 programs, managing schedules, pressures and fluids to meet designs. Coordinate crews, sand, water and chemicals to sustain continuous pumping and minimize downtime. Deliver post-frac interventions and cementing, targeting sub-12-hour turnarounds and leveraging CT correlations (2024 CT-linked uplift 10–20%, global cementing market ~USD 4.3B).
| Activity | 2024 Metric |
|---|---|
| CT-related uplift | 10–20% |
| Turnaround target | sub-12 hours |
| Global cementing market | ~USD 4.3B |
Delivered as Displayed
Business Model Canvas
The Calfrac Business Model Canvas previewed here is the exact document you will receive — not a mockup. Upon purchase you’ll download the complete file, formatted and ready to edit in Word and Excel. No hidden pages, no placeholders.
Description
Unlock the strategic playbook with a concise Business Model Canvas
Unlock Calfrac's strategic playbook with our Business Model Canvas. This concise, actionable framework reveals the company's value propositions, key partnerships, cost structure and revenue levers to help investors and strategists pinpoint growth and risk. Purchase the full, editable Canvas in Word and Excel to apply these insights directly.
Partnerships
E&P operators and supermajors
Anchor relationships with E&P operators and supermajors across Canada, the US and Argentina secure pad-level collaboration on development and stimulation design, enabling multi-year service programs. Aligning schedules and KPIs with partners maximizes well productivity and reduces NPT through coordinated crews and shared targets. Master service agreements provide continuity and volume visibility to support multi-season planning and capital allocation.
Equipment OEMs and technology vendors
Partner with pump, blender, powertrain and data-logging OEMs to co-develop reliability upgrades, fuel-flex solutions and digital controls; Calfrac’s 2024 fleet modernization pilots cut fuel consumption and emissions intensity by 12% while improving uptime. Secure priority access to parts and field service to reduce lead times and maintenance costs, and pilot new tech that lowers per-job operating costs and CO2 output.
Chemical and proppant suppliers
Calfrac partners with frac sand, resin-coated proppant and chemistry providers to secure tailored fluid systems for each formation while actively managing cost per stage. In 2024 the company emphasized just-in-time delivery to wellsites and regional terminals to minimize inventory and downtime. Volume-based pricing and contingency supply agreements underpin reliability and cost predictability across campaigns.
Logistics and infrastructure partners
Engage rail, trucking, transload terminals and storage yards to centralize inbound sand, fuel and water logistics, optimizing last-mile sand delivery and on-site water handling to reduce mobilization delays. Improve turnaround times and cut demurrage and standby through coordinated scheduling and shared KPI-driven dispatch. Implement real-time data sharing for inventory visibility, ETA tracking and dynamic load reallocation to boost fleet utilization.
- rail integration
- last-mile sand delivery
- fuel & water handling
- reduced demurrage/standby
- real-time inventory & dispatch
Regulators and local communities
Regulators and local communities ensure Calfrac maintains strict compliance with environmental, safety, and labor regulations while building trust through proactive community engagement and transparent, responsible operations. Coordination on permits, road use, and noise/traffic mitigation minimizes disruptions to residents and operations. Prioritizing local hiring and supplier development strengthens social license and reduces operational risk.
- Compliance focus: environmental, safety, labor
- Community engagement: trust-building, transparency
- Operational coordination: permits, road use, noise/traffic
- Local economic impact: hiring and supplier development
Operator partnerships align KPIs, cut NPT; fleet pilots cut 12% fuel/emissions
Calfrac’s anchor E&P and supermajor partnerships secure multi-year pad programs and MSA-backed volume visibility, aligning KPIs to cut NPT and improve crew utilization. 2024 fleet modernization pilots reduced fuel consumption and emissions intensity by 12% while improving uptime. Supply and logistics partners enabled JIT sand delivery and real-time dispatch to minimize downtime.
| Partner type | 2024 impact |
|---|---|
| Operators/MSAs | Multi-year programs, KPI alignment |
| OEMs | 12% fuel/emissions reduction |
| Logistics/sand | JIT delivery, reduced downtime |
What is included in the product
Detailed Word Document
A complete Business Model Canvas for Calfrac detailing customer segments, value propositions, channels, key activities and assets (fleet and services), revenue streams and cost structure across the nine BMC blocks, with linked SWOT and competitive advantages—ideal for presentations, investor discussions, and strategic decision-making.
Customizable Excel Spreadsheet
Condenses Calfrac’s operations, customer segments, and revenue drivers into a clean, editable one-page canvas that saves hours of analysis and helps teams quickly align on strategy and operational pain points.
Activities
Hydraulic fracturing operations
Plan, mobilize and execute multi-stage stimulation jobs across Calfrac’s 2024 operating programs, managing pumping schedules, pressures and fluid systems to meet engineered designs. Coordinate crews, sand, water and chemicals to sustain continuous pumping and minimize downtime. Capture detailed job data in 2024 to refine designs, improve efficiency and control per-job costs.
Coiled tubing and well intervention
Deliver millouts, cleanouts and post-frac interventions with rapid rig-up/rig-down to ensure safe, efficient operations; 2024 field case studies show coiled tubing integrations yielding 10–20% production uplift when CT data is correlated with frac outcomes. Focus on minimizing downtime between stages—targeting sub-12-hour turnarounds—to accelerate cycle times and improve well economics.
Cementing and zonal isolation
Provide primary and remedial cementing to ensure zonal isolation and long-term well integrity, tailoring operations to casing and formation needs. Engineer slurries for temperature, pressure and formation conditions, leveraging lab-validated mixes and field optimization. Coordinate with drilling and completions timelines and verify placement quality with pressure tests and cement bond/ultrasonic logging; the global well cementing market was estimated near USD 4.3B in 2024.
Fleet maintenance and reliability
HSE, compliance, and training
Implement safety programs that meet client and regulatory standards, train crews on procedures, equipment, and hazard controls, and track incidents, audits, and corrective actions to ensure accountability. Drive continuous improvement initiatives focused on lowering total recordable injury frequency and reducing environmental impact through operational changes and learnings.
- HSE program alignment
- Crew training & competency
- Incident/audit tracking
- Continuous TRIF & emissions reduction
2024 fracs: crews, sands, fluids, sub-12h turnarounds, CT uplift 10–20%
Plan and execute multi-stage stimulation across 2024 programs, managing schedules, pressures and fluids to meet designs. Coordinate crews, sand, water and chemicals to sustain continuous pumping and minimize downtime. Deliver post-frac interventions and cementing, targeting sub-12-hour turnarounds and leveraging CT correlations (2024 CT-linked uplift 10–20%, global cementing market ~USD 4.3B).
| Activity | 2024 Metric |
|---|---|
| CT-related uplift | 10–20% |
| Turnaround target | sub-12 hours |
| Global cementing market | ~USD 4.3B |
Delivered as Displayed
Business Model Canvas
The Calfrac Business Model Canvas previewed here is the exact document you will receive — not a mockup. Upon purchase you’ll download the complete file, formatted and ready to edit in Word and Excel. No hidden pages, no placeholders.











