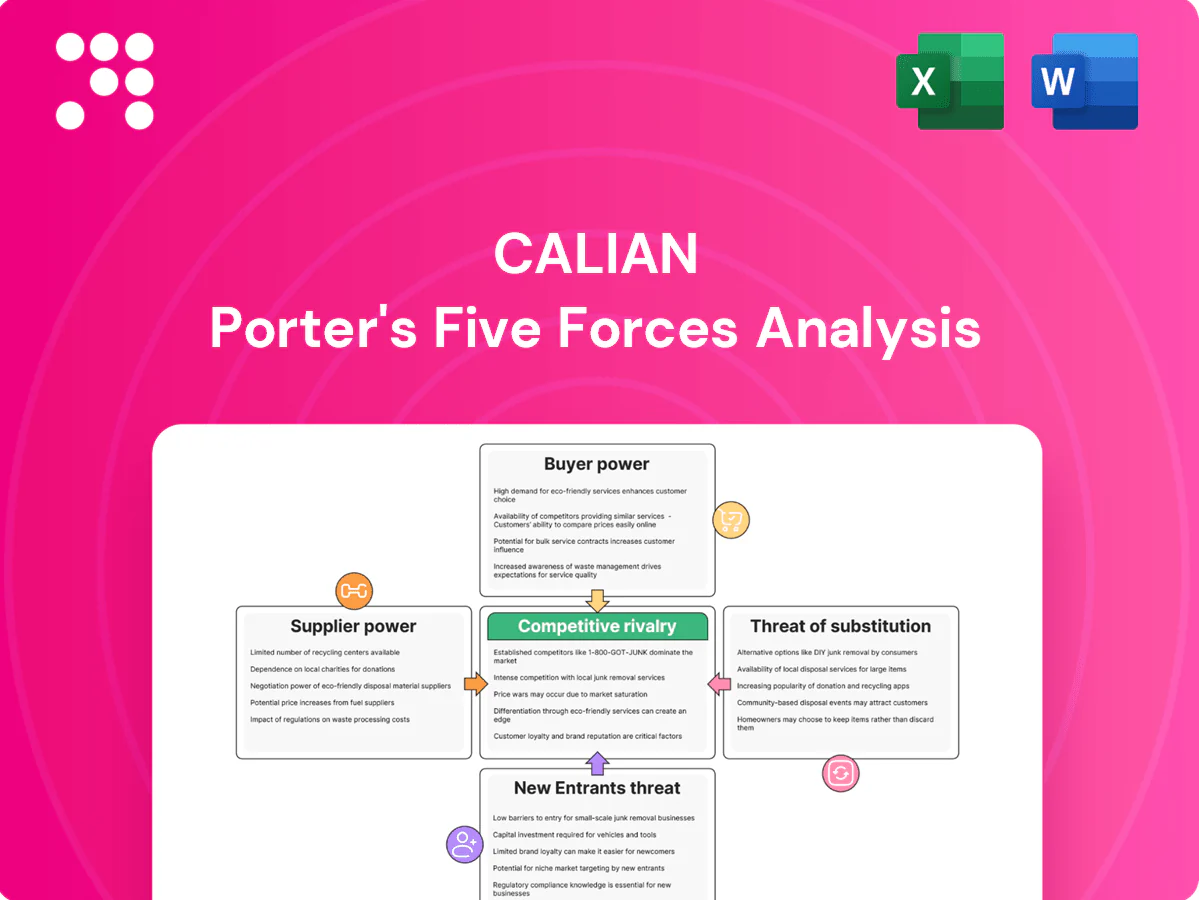
Calian Porter's Five Forces Analysis

Don't Miss the Bigger Picture
Calian's Porter's Five Forces snapshot highlights supplier leverage, buyer power, substitute threats, new entrant risks, and competitive rivalry shaping its margins and strategy. This concise overview surfaces key pressures but omits force-by-force ratings, visuals, and actionable recommendations. Unlock the full Porter's Five Forces Analysis to get consultant-grade ratings, data-driven implications, and presentation-ready deliverables to guide investment or strategic decisions.
Suppliers Bargaining Power

Niche tech suppliers wield leverage
Calian’s satellite ground systems and RF solutions depend on specialized antennas, high-reliability semiconductors and test gear sourced from a narrow vendor pool, giving those suppliers measurable negotiation leverage. Scarcity and rigorous qualification requirements concentrate power, and 2024 industry-wide lead-time volatility has repeatedly affected project schedules and margins. Dual-sourcing and framework agreements mitigate but do not eliminate supplier risk.
Talent and credentialed labor constraints
Calian’s healthcare staffing and cybersecurity services rely on scarce, credentialed professionals, giving suppliers (labor) significant leverage. ISC2 estimated a 3.4 million global cybersecurity workforce gap in 2024 and Canadian nursing vacancy rates hovered near 10%, driving wage and bill-rate pressure. Tight markets can force capacity limits; targeted upskilling pipelines and retention programs are key to rebalancing supplier power.

Software, cloud, and data dependencies
Reliance on major cloud platforms (AWS ~31%, Azure ~23%, GCP ~11% in 2024) and specialized security/software vendors creates lock-in as the cloud infrastructure market reached about $243B in 2024; vendors with unique features or data gravity gain pricing power. API compatibility and exit costs shape switching feasibility, while Calian can negotiate enterprise terms and maintain tool redundancy to retain flexibility.

IP ownership and OEM partnerships
Where OEMs control core IP for subsystems or platforms they can dictate terms and upgrade paths, and bundled maintenance and certification tie-ins increase customer dependence; joint roadmaps may align incentives but also constrain Calian’s bargaining power. Calian (TSX: CGY) retained proprietary IP in selected offerings in 2024, reducing supplier exposure in those lines.
- OEM IP control: limits negotiation on upgrades
- Bundled tie-ins: raises switching costs and certification barriers
- Joint roadmaps: align but restrict flexibility
- Calian 2024: selective in-house IP lowers supplier risk
Supply chain resilience and compliance
Security-cleared, ITAR/CGP-compliant or medical-grade suppliers are limited, amplifying supplier power and raising switching costs; 2024 industry reports show specialized suppliers constitute roughly 35% of critical defense/health supply bases. Audit and traceability mandates restrict rapid substitution, while long-term compliant partners command premium pricing; proactive qualification and inventory buffers reduce disruption risk.
- Specialized suppliers ~35% (2024)
- Audit/traceability = high switching cost
- Long-term partners = premium pricing
- Proactive qualification + buffers = lowered disruption
Supplier concentration pressures margins - ~35% specialized suppliers, 3.4M cyber gap
Calian faces concentrated supplier power across electronics, certified labor and cloud providers, driving lead-time and wage pressure that affected 2024 margins. Specialized suppliers (~35% of critical base) and security/compliance requirements raise switching costs and premiums. Dual-sourcing, selective IP ownership and talent pipelines partially mitigate but do not remove leverage.
| Factor | 2024 metric |
|---|---|
| Specialized suppliers | ~35% |
| Cloud share | AWS 31% / Azure 23% / GCP 11% |
| Cyber workforce gap | 3.4M global |
What is included in the product
 Detailed Word Document
Tailored Porter’s Five Forces analysis for Calian that uncovers key drivers of competition, buyer and supplier power, substitutes and entry barriers, and identifies disruptive threats and strategic levers to protect market share and pricing power.

 Customizable Excel Spreadsheet
A concise, one-sheet Calian Porter Five Forces tool that pinpoints competitive pain points for rapid strategic response and prioritization.
Customers Bargaining Power

Government buyers with scale and rigor
Public-sector clients run competitive RFPs with strict SLAs and compliance, concentrating buying power and forcing suppliers to meet detailed standards; large, multi-year awards often exceed CAD 10M and span 3–7 years, driving pricing discipline. Past performance and certifications materially influence selection but do not eliminate downward pricing pressure. Framework contracts secure volume yet typically cap rates and margins.
Commercial clients seek measurable ROI
Enterprises in healthcare, cyber and training now prioritize measurable outcomes and total cost of ownership, with over 70% of buyers in 2024 requiring proof of value; healthcare IT buyers pushed TCO scrutiny amid a $220B global cybersecurity spend in 2024. They benchmark Calian against integrators and MSPs in a roughly $260B managed services market, and price transparency plus ROI evidence raises negotiation leverage. Calian’s integrated, bundled solutions can justify modest premiums by demonstrating consolidated savings and outcome-linked value.

Switching costs vary by segment
Switching costs vary: integrated systems, accreditations and embedded processes in advanced tech and cyber create high friction—global cybersecurity spend hit about US$223B in 2024, driving long multiyear contracts—while healthcare staffing shows unit-level substitutability with nurse turnover near 18–20% annually; multiyear support and tied training drive inertia, yet clear migration paths enable churn if perceived value drops.

Performance-based contracts and SLAs
Outcome-linked milestones shift risk to the vendor, empowering buyers to demand concessions and tougher SLA terms; penalties for downtime or staffing gaps directly pressure vendor margins and cashflow. Strong KPI delivery, however, unlocks renewals and expansions and supports premium pricing. Transparent, auditable reporting helps vendors defend pricing by proving value and compliance.
- Risk shift: buyers demand concessions
- Penalties: margin pressure from downtime/staff gaps
- KPIs: drive renewals/expansion
- Reporting: defends pricing
Global reach and vendor consolidation
Large enterprise buyers increasingly seek fewer, scalable partners across regions, boosting customer bargaining power during contract renewals; Calian (TSX: CGY) reported fiscal 2024 revenue of CAD 564 million, supporting regional scale and standardized delivery to counter price pressure.
- Vendor consolidation raises renewal leverage
- Cross-selling reduces unit-price impact
- Geographic coverage strengthens negotiation position
Public buyers drive price pressure; > 70% demand PoV, awards > CAD 10M
Public-sector and large enterprise buyers wield strong leverage via competitive RFPs, strict SLAs and multiyear awards (often >CAD 10M), driving price pressure despite certification and performance needs. Over 70% of 2024 buyers demand proof of value, raising negotiation power; outcome-linked SLAs shift risk to vendors but good KPI delivery secures renewals. Calian’s CAD 564M 2024 revenue and regional scale help mitigate but not eliminate buyer bargaining.
| Metric | 2024 Value | Relevance |
|---|---|---|
| Calian revenue | CAD 564M | Scale vs buyer leverage |
| Buyers requiring PoV | >70% | Increases negotiation strength |
| Cybersecurity spend | US$223B | Drives long contracts, vendor stickiness |
| Avg large award | >CAD 10M | Concentrates purchasing power |
Full Version Awaits
Calian Porter's Five Forces Analysis
This preview shows the exact Calian Porter's Five Forces Analysis you'll receive immediately after purchase—no surprises, no placeholders. The document is fully formatted, professionally written, and ready for download and use the moment you buy. You're looking at the final deliverable; upon payment you'll gain instant access to this identical file for strategic decision-making.

Don't Miss the Bigger Picture
Calian's Porter's Five Forces snapshot highlights supplier leverage, buyer power, substitute threats, new entrant risks, and competitive rivalry shaping its margins and strategy. This concise overview surfaces key pressures but omits force-by-force ratings, visuals, and actionable recommendations. Unlock the full Porter's Five Forces Analysis to get consultant-grade ratings, data-driven implications, and presentation-ready deliverables to guide investment or strategic decisions.
Suppliers Bargaining Power
Niche tech suppliers wield leverage
Calian’s satellite ground systems and RF solutions depend on specialized antennas, high-reliability semiconductors and test gear sourced from a narrow vendor pool, giving those suppliers measurable negotiation leverage. Scarcity and rigorous qualification requirements concentrate power, and 2024 industry-wide lead-time volatility has repeatedly affected project schedules and margins. Dual-sourcing and framework agreements mitigate but do not eliminate supplier risk.
Talent and credentialed labor constraints
Calian’s healthcare staffing and cybersecurity services rely on scarce, credentialed professionals, giving suppliers (labor) significant leverage. ISC2 estimated a 3.4 million global cybersecurity workforce gap in 2024 and Canadian nursing vacancy rates hovered near 10%, driving wage and bill-rate pressure. Tight markets can force capacity limits; targeted upskilling pipelines and retention programs are key to rebalancing supplier power.
Software, cloud, and data dependencies
Reliance on major cloud platforms (AWS ~31%, Azure ~23%, GCP ~11% in 2024) and specialized security/software vendors creates lock-in as the cloud infrastructure market reached about $243B in 2024; vendors with unique features or data gravity gain pricing power. API compatibility and exit costs shape switching feasibility, while Calian can negotiate enterprise terms and maintain tool redundancy to retain flexibility.
IP ownership and OEM partnerships
Where OEMs control core IP for subsystems or platforms they can dictate terms and upgrade paths, and bundled maintenance and certification tie-ins increase customer dependence; joint roadmaps may align incentives but also constrain Calian’s bargaining power. Calian (TSX: CGY) retained proprietary IP in selected offerings in 2024, reducing supplier exposure in those lines.
- OEM IP control: limits negotiation on upgrades
- Bundled tie-ins: raises switching costs and certification barriers
- Joint roadmaps: align but restrict flexibility
- Calian 2024: selective in-house IP lowers supplier risk
Supply chain resilience and compliance
Security-cleared, ITAR/CGP-compliant or medical-grade suppliers are limited, amplifying supplier power and raising switching costs; 2024 industry reports show specialized suppliers constitute roughly 35% of critical defense/health supply bases. Audit and traceability mandates restrict rapid substitution, while long-term compliant partners command premium pricing; proactive qualification and inventory buffers reduce disruption risk.
- Specialized suppliers ~35% (2024)
- Audit/traceability = high switching cost
- Long-term partners = premium pricing
- Proactive qualification + buffers = lowered disruption
Supplier concentration pressures margins - ~35% specialized suppliers, 3.4M cyber gap
Calian faces concentrated supplier power across electronics, certified labor and cloud providers, driving lead-time and wage pressure that affected 2024 margins. Specialized suppliers (~35% of critical base) and security/compliance requirements raise switching costs and premiums. Dual-sourcing, selective IP ownership and talent pipelines partially mitigate but do not remove leverage.
| Factor | 2024 metric |
|---|---|
| Specialized suppliers | ~35% |
| Cloud share | AWS 31% / Azure 23% / GCP 11% |
| Cyber workforce gap | 3.4M global |
What is included in the product
Detailed Word Document
Tailored Porter’s Five Forces analysis for Calian that uncovers key drivers of competition, buyer and supplier power, substitutes and entry barriers, and identifies disruptive threats and strategic levers to protect market share and pricing power.
Customizable Excel Spreadsheet
A concise, one-sheet Calian Porter Five Forces tool that pinpoints competitive pain points for rapid strategic response and prioritization.
Customers Bargaining Power
Government buyers with scale and rigor
Public-sector clients run competitive RFPs with strict SLAs and compliance, concentrating buying power and forcing suppliers to meet detailed standards; large, multi-year awards often exceed CAD 10M and span 3–7 years, driving pricing discipline. Past performance and certifications materially influence selection but do not eliminate downward pricing pressure. Framework contracts secure volume yet typically cap rates and margins.
Commercial clients seek measurable ROI
Enterprises in healthcare, cyber and training now prioritize measurable outcomes and total cost of ownership, with over 70% of buyers in 2024 requiring proof of value; healthcare IT buyers pushed TCO scrutiny amid a $220B global cybersecurity spend in 2024. They benchmark Calian against integrators and MSPs in a roughly $260B managed services market, and price transparency plus ROI evidence raises negotiation leverage. Calian’s integrated, bundled solutions can justify modest premiums by demonstrating consolidated savings and outcome-linked value.
Switching costs vary by segment
Switching costs vary: integrated systems, accreditations and embedded processes in advanced tech and cyber create high friction—global cybersecurity spend hit about US$223B in 2024, driving long multiyear contracts—while healthcare staffing shows unit-level substitutability with nurse turnover near 18–20% annually; multiyear support and tied training drive inertia, yet clear migration paths enable churn if perceived value drops.
Performance-based contracts and SLAs
Outcome-linked milestones shift risk to the vendor, empowering buyers to demand concessions and tougher SLA terms; penalties for downtime or staffing gaps directly pressure vendor margins and cashflow. Strong KPI delivery, however, unlocks renewals and expansions and supports premium pricing. Transparent, auditable reporting helps vendors defend pricing by proving value and compliance.
- Risk shift: buyers demand concessions
- Penalties: margin pressure from downtime/staff gaps
- KPIs: drive renewals/expansion
- Reporting: defends pricing
Global reach and vendor consolidation
Large enterprise buyers increasingly seek fewer, scalable partners across regions, boosting customer bargaining power during contract renewals; Calian (TSX: CGY) reported fiscal 2024 revenue of CAD 564 million, supporting regional scale and standardized delivery to counter price pressure.
- Vendor consolidation raises renewal leverage
- Cross-selling reduces unit-price impact
- Geographic coverage strengthens negotiation position
Public buyers drive price pressure; > 70% demand PoV, awards > CAD 10M
Public-sector and large enterprise buyers wield strong leverage via competitive RFPs, strict SLAs and multiyear awards (often >CAD 10M), driving price pressure despite certification and performance needs. Over 70% of 2024 buyers demand proof of value, raising negotiation power; outcome-linked SLAs shift risk to vendors but good KPI delivery secures renewals. Calian’s CAD 564M 2024 revenue and regional scale help mitigate but not eliminate buyer bargaining.
| Metric | 2024 Value | Relevance |
|---|---|---|
| Calian revenue | CAD 564M | Scale vs buyer leverage |
| Buyers requiring PoV | >70% | Increases negotiation strength |
| Cybersecurity spend | US$223B | Drives long contracts, vendor stickiness |
| Avg large award | >CAD 10M | Concentrates purchasing power |
Full Version Awaits
Calian Porter's Five Forces Analysis
This preview shows the exact Calian Porter's Five Forces Analysis you'll receive immediately after purchase—no surprises, no placeholders. The document is fully formatted, professionally written, and ready for download and use the moment you buy. You're looking at the final deliverable; upon payment you'll gain instant access to this identical file for strategic decision-making.
Original: $10.00
-65%$10.00
$3.50Description
Don't Miss the Bigger Picture
Calian's Porter's Five Forces snapshot highlights supplier leverage, buyer power, substitute threats, new entrant risks, and competitive rivalry shaping its margins and strategy. This concise overview surfaces key pressures but omits force-by-force ratings, visuals, and actionable recommendations. Unlock the full Porter's Five Forces Analysis to get consultant-grade ratings, data-driven implications, and presentation-ready deliverables to guide investment or strategic decisions.
Suppliers Bargaining Power
Niche tech suppliers wield leverage
Calian’s satellite ground systems and RF solutions depend on specialized antennas, high-reliability semiconductors and test gear sourced from a narrow vendor pool, giving those suppliers measurable negotiation leverage. Scarcity and rigorous qualification requirements concentrate power, and 2024 industry-wide lead-time volatility has repeatedly affected project schedules and margins. Dual-sourcing and framework agreements mitigate but do not eliminate supplier risk.
Talent and credentialed labor constraints
Calian’s healthcare staffing and cybersecurity services rely on scarce, credentialed professionals, giving suppliers (labor) significant leverage. ISC2 estimated a 3.4 million global cybersecurity workforce gap in 2024 and Canadian nursing vacancy rates hovered near 10%, driving wage and bill-rate pressure. Tight markets can force capacity limits; targeted upskilling pipelines and retention programs are key to rebalancing supplier power.
Software, cloud, and data dependencies
Reliance on major cloud platforms (AWS ~31%, Azure ~23%, GCP ~11% in 2024) and specialized security/software vendors creates lock-in as the cloud infrastructure market reached about $243B in 2024; vendors with unique features or data gravity gain pricing power. API compatibility and exit costs shape switching feasibility, while Calian can negotiate enterprise terms and maintain tool redundancy to retain flexibility.
IP ownership and OEM partnerships
Where OEMs control core IP for subsystems or platforms they can dictate terms and upgrade paths, and bundled maintenance and certification tie-ins increase customer dependence; joint roadmaps may align incentives but also constrain Calian’s bargaining power. Calian (TSX: CGY) retained proprietary IP in selected offerings in 2024, reducing supplier exposure in those lines.
- OEM IP control: limits negotiation on upgrades
- Bundled tie-ins: raises switching costs and certification barriers
- Joint roadmaps: align but restrict flexibility
- Calian 2024: selective in-house IP lowers supplier risk
Supply chain resilience and compliance
Security-cleared, ITAR/CGP-compliant or medical-grade suppliers are limited, amplifying supplier power and raising switching costs; 2024 industry reports show specialized suppliers constitute roughly 35% of critical defense/health supply bases. Audit and traceability mandates restrict rapid substitution, while long-term compliant partners command premium pricing; proactive qualification and inventory buffers reduce disruption risk.
- Specialized suppliers ~35% (2024)
- Audit/traceability = high switching cost
- Long-term partners = premium pricing
- Proactive qualification + buffers = lowered disruption
Supplier concentration pressures margins - ~35% specialized suppliers, 3.4M cyber gap
Calian faces concentrated supplier power across electronics, certified labor and cloud providers, driving lead-time and wage pressure that affected 2024 margins. Specialized suppliers (~35% of critical base) and security/compliance requirements raise switching costs and premiums. Dual-sourcing, selective IP ownership and talent pipelines partially mitigate but do not remove leverage.
| Factor | 2024 metric |
|---|---|
| Specialized suppliers | ~35% |
| Cloud share | AWS 31% / Azure 23% / GCP 11% |
| Cyber workforce gap | 3.4M global |
What is included in the product
Detailed Word Document
Tailored Porter’s Five Forces analysis for Calian that uncovers key drivers of competition, buyer and supplier power, substitutes and entry barriers, and identifies disruptive threats and strategic levers to protect market share and pricing power.
Customizable Excel Spreadsheet
A concise, one-sheet Calian Porter Five Forces tool that pinpoints competitive pain points for rapid strategic response and prioritization.
Customers Bargaining Power
Government buyers with scale and rigor
Public-sector clients run competitive RFPs with strict SLAs and compliance, concentrating buying power and forcing suppliers to meet detailed standards; large, multi-year awards often exceed CAD 10M and span 3–7 years, driving pricing discipline. Past performance and certifications materially influence selection but do not eliminate downward pricing pressure. Framework contracts secure volume yet typically cap rates and margins.
Commercial clients seek measurable ROI
Enterprises in healthcare, cyber and training now prioritize measurable outcomes and total cost of ownership, with over 70% of buyers in 2024 requiring proof of value; healthcare IT buyers pushed TCO scrutiny amid a $220B global cybersecurity spend in 2024. They benchmark Calian against integrators and MSPs in a roughly $260B managed services market, and price transparency plus ROI evidence raises negotiation leverage. Calian’s integrated, bundled solutions can justify modest premiums by demonstrating consolidated savings and outcome-linked value.
Switching costs vary by segment
Switching costs vary: integrated systems, accreditations and embedded processes in advanced tech and cyber create high friction—global cybersecurity spend hit about US$223B in 2024, driving long multiyear contracts—while healthcare staffing shows unit-level substitutability with nurse turnover near 18–20% annually; multiyear support and tied training drive inertia, yet clear migration paths enable churn if perceived value drops.
Performance-based contracts and SLAs
Outcome-linked milestones shift risk to the vendor, empowering buyers to demand concessions and tougher SLA terms; penalties for downtime or staffing gaps directly pressure vendor margins and cashflow. Strong KPI delivery, however, unlocks renewals and expansions and supports premium pricing. Transparent, auditable reporting helps vendors defend pricing by proving value and compliance.
- Risk shift: buyers demand concessions
- Penalties: margin pressure from downtime/staff gaps
- KPIs: drive renewals/expansion
- Reporting: defends pricing
Global reach and vendor consolidation
Large enterprise buyers increasingly seek fewer, scalable partners across regions, boosting customer bargaining power during contract renewals; Calian (TSX: CGY) reported fiscal 2024 revenue of CAD 564 million, supporting regional scale and standardized delivery to counter price pressure.
- Vendor consolidation raises renewal leverage
- Cross-selling reduces unit-price impact
- Geographic coverage strengthens negotiation position
Public buyers drive price pressure; > 70% demand PoV, awards > CAD 10M
Public-sector and large enterprise buyers wield strong leverage via competitive RFPs, strict SLAs and multiyear awards (often >CAD 10M), driving price pressure despite certification and performance needs. Over 70% of 2024 buyers demand proof of value, raising negotiation power; outcome-linked SLAs shift risk to vendors but good KPI delivery secures renewals. Calian’s CAD 564M 2024 revenue and regional scale help mitigate but not eliminate buyer bargaining.
| Metric | 2024 Value | Relevance |
|---|---|---|
| Calian revenue | CAD 564M | Scale vs buyer leverage |
| Buyers requiring PoV | >70% | Increases negotiation strength |
| Cybersecurity spend | US$223B | Drives long contracts, vendor stickiness |
| Avg large award | >CAD 10M | Concentrates purchasing power |
Full Version Awaits
Calian Porter's Five Forces Analysis
This preview shows the exact Calian Porter's Five Forces Analysis you'll receive immediately after purchase—no surprises, no placeholders. The document is fully formatted, professionally written, and ready for download and use the moment you buy. You're looking at the final deliverable; upon payment you'll gain instant access to this identical file for strategic decision-making.











