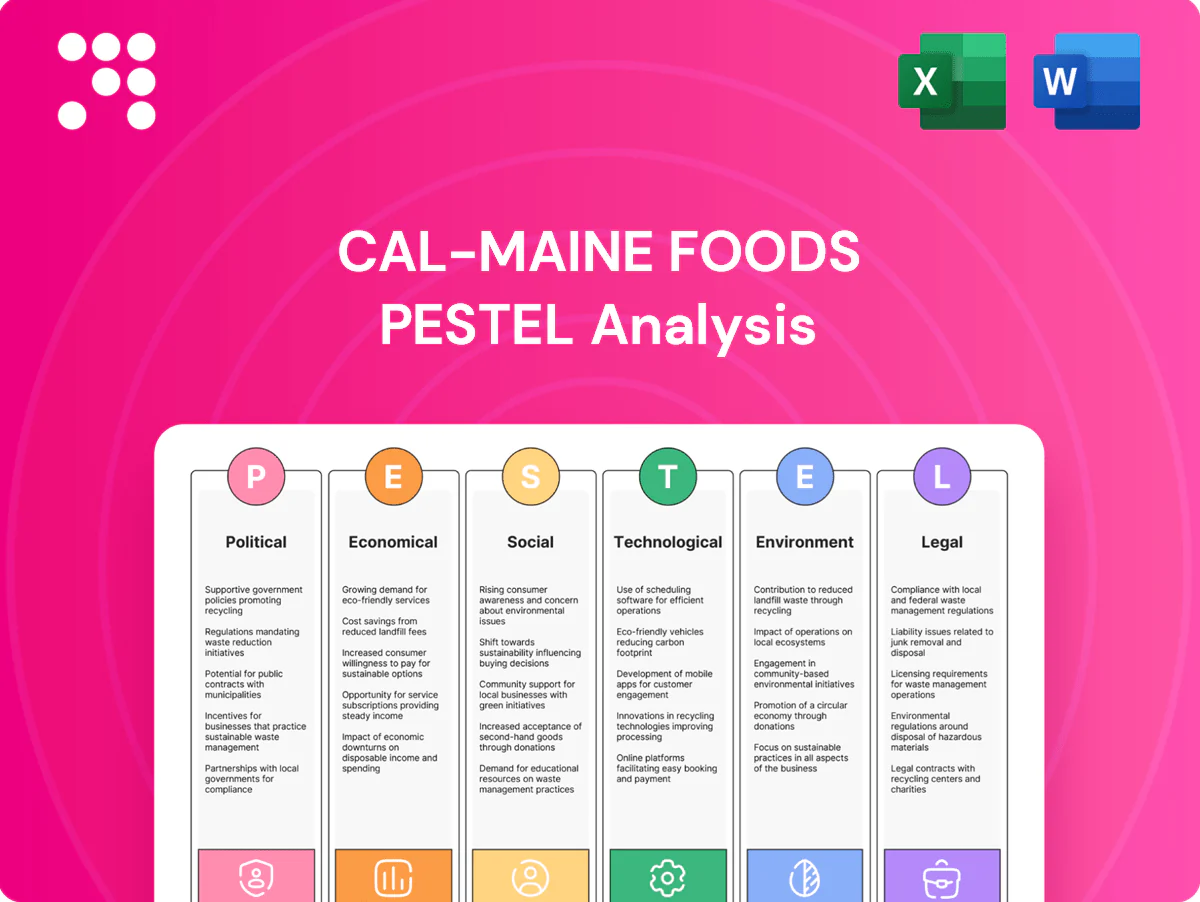
Cal-Maine Foods PESTLE Analysis

Your Competitive Advantage Starts with This Report
Unlock how political, economic, and environmental forces are reshaping Cal‑Maine Foods’ market position. Our PESTLE highlights regulatory risks, supply‑chain pressures, consumer trends, and technological shifts to sharpen your investment or strategy. Buy the full, editable report now for actionable insights you can implement immediately.
Political factors

Farm and ag policy direction
US farm bills shape subsidies, insurance and conservation programs that affect feed costs and capital planning; USDA season-average corn price was about $4.50/bu in 2024–25, directly impacting feed expense. Shifts toward animal welfare or biosecurity funding raise compliance costs for large-scale egg producers. Cal-Maine, with roughly 20% of the U.S. shell-egg market, must track allocations—policy stability lowers planning risk; gridlock raises uncertainty.
State-level ag mandates
State-level mandates such as California’s Proposition 12 (116 square inches for laying hens) reshape market access and welfare terms in a state of roughly 39 million residents, effectively exporting standards beyond borders. Divergent requirements across states force divergent packaging, SKU and network plans, raising logistics and forecasting costs. As the largest U.S. shell egg producer, Cal-Maine’s scale aids adaptation but multiplies compliance complexity and inspection exposure.

Trade and tariff impacts
Cal-Maine, the largest US shell-egg producer, faces input-cost pressure as US steel tariffs (25%) and aluminum duties (10%) raise equipment and packaging expenses and tariffs on corn/soy imports can ripple through feed costs. Export rules and shifts in egg-product shipments can tighten domestic supply, while tightened biosecurity amid geopolitical tensions raises compliance costs. Hedging and supplier diversification help mitigate this volatility.

Labor and immigration stance
Enforcement intensity and visa policy materially affect Cal-Maine operations: DOL-certified H-2A positions rose to about 318,000 in FY2023, tightening seasonal labor availability and pushing average hired farmworker pay toward roughly $16.95/hour in 2023, raising labor costs and execution risk. Political shifts can lift wages or limit seasonal hires, improving automation ROI where workforce programs subsidize capital investment.
- H-2A growth: ~318,000 certified positions (FY2023)
- Avg hired farm wage: ~$16.95/hr (2023)
- Stable access lowers execution risk
Infrastructure and energy policy
Funding for roads, ports and grid reliability directly impacts Cal‑Maine’s cold‑chain uptime and service levels; the Bipartisan Infrastructure Law committed roughly 1.2 trillion dollars to such projects, while the Inflation Reduction Act’s ~369 billion dollars in clean energy incentives improves onsite energy economics and ROI for solar-plus-storage deployments; tightening fuel and EPA standards raise freight costs; policy direction shapes long‑term capex priorities.
- Funding: BIL ~1.2 trillion
- Renewables: IRA ~369 billion
- Fuel standards: upward pressure on freight costs
- Capex: policy steers cold‑chain investments
Corn $4.50/bu, labor costs and rules push automation and compliance spend
US farm bills, tariffs and biosecurity rules drive feed, equipment and compliance costs—USDA season‑average corn ~ $4.50/bu (2024–25) raises feed expense. State mandates like CA Prop 12 and divergent rules increase packaging, logistics and inspection complexity for Cal‑Maine (≈20% U.S. shell‑egg market). Labor and infrastructure policy—H‑2A ~318,000 (FY2023); avg hired farm wage ~$16.95/hr (2023)—push automation and capex decisions.
| Metric | Value |
|---|---|
| Cal‑Maine market share | ~20% |
| USDA corn price (2024–25) | $4.50/bu |
| H‑2A positions (FY2023) | ~318,000 |
| Avg farm wage (2023) | $16.95/hr |
What is included in the product
 Detailed Word Document
Provides a data‑backed PESTLE evaluation of Cal‑Maine Foods across Political, Economic, Social, Technological, Environmental and Legal dimensions, highlighting region‑ and industry‑specific risks and opportunities and offering forward‑looking insights for scenario planning. Designed for executives, investors and strategists to inform reports, plans and funding decisions.

 Customizable Excel Spreadsheet
A concise, categorized PESTLE summary of Cal‑Maine Foods for easy meeting use, highlighting regulatory, supply‑chain and market risks and opportunities; editable notes let teams tailor insights by region or product, ideal for slides, strategy sessions, and quick cross‑department alignment.
Economic factors

Feed cost volatility
Corn and soybean meal represent roughly 70% of Cal-Maine’s feed ingredient costs, with corn futures averaging about $5.30/bu in 2024 and soybean meal near $420/ton in 2024. Weather, US biofuel mandates and rising global demand drove wide swings—corn ranged +/-30% year-over-year in 2023–24. Basis risk between futures and local cash markets complicates hedging effectiveness. Ability to pass costs through depends on retail contract terms and market tightness, especially during supply shocks.
Egg price cyclicality
Egg markets are highly sensitive to supply shocks and seasonal demand, with the 2022 HPAI outbreak culling over 50 million birds and driving wholesale egg prices from under $1 to about $3.50 per dozen at peak. Recovery cycles reset supply, often producing sharp price declines that compress margins. Industry overexpansion after spikes further squeezes returns. Revenue volatility forces Cal-Maine to emphasize disciplined capacity and dynamic pricing.

Consumer spending and mix
Macro shifts push demand between value and specialty eggs, with inflation-driven trade-downs favoring conventional or private-label cartons while periods of real wage growth lift cage-free and organic sales. Cal-Maine, the largest U.S. shell-egg producer with roughly 20% market share, benefits from breadth across conventional, cage-free and specialty SKUs. That portfolio diversity helps buffer margin and volume swings as consumer mix rotates.

Logistics and fuel costs
Diesel and freight rates directly affect Cal-Maine Foods’ delivered cost to retailers; U.S. diesel averaged about $3.85/gal in 2024 (EIA), pressuring per-case transport costs and margins. Tight trucking capacity in 2024–25 elevated surcharges and service risk, while higher network density on core routes improves drop economics. Fuel hedges and mode optimization (rail/intermodal where feasible) have been used to protect margins.
- Diesel avg ~ $3.85/gal (2024, EIA)
- Tight capacity → higher surcharges & service risk
- Network density lowers per-drop cost
- Fuel hedges + mode optimization protect margins
Retailer bargaining power
Retail consolidation gives grocers and club chains strong leverage over Cal‑Maine, pressing pricing and slotting fees while private‑label eggs now account for roughly 15% of category sales; performance‑based contracts that reward on‑time delivery and safety can offset margin pressure. Cal‑Maine’s scale, supplying about 20% of US shell eggs, and brand differentiation help counterbalance retailer power.
- Retailer pricing/slotting pressure
- Private label ~15% of category
- Performance contracts reward reliability
- Cal‑Maine ~20% US shell‑egg supply
Corn $4.50/bu, labor costs and rules push automation and compliance spend
Feed (corn ~70% of feed cost) with 2024 corn futures ~$5.30/bu and soybean meal ~$420/ton drives margin volatility; hedging limited by basis risk. HPAI culled >50M birds (2022) and pushed wholesale eggs to ~$3.50/doz at peak, creating boom‑bust cycles. Cal‑Maine supplies ~20% US shell eggs; private label ~15%; US diesel averaged $3.85/gal in 2024.
| Metric | Value (2024) |
|---|---|
| Corn futures | $5.30/bu |
| Soybean meal | $420/ton |
| HPAI cull | >50M birds |
| Peak wholesale eggs | $3.50/doz |
| Cal‑Maine market share | ~20% |
| Private label share | ~15% |
| US diesel avg | $3.85/gal |
What You See Is What You Get
Cal-Maine Foods PESTLE Analysis
This Cal-Maine Foods PESTLE Analysis preview is the exact document you’ll receive after purchase—fully formatted and ready to use. The content, layout, and professional structure shown here match the final downloadable file. No placeholders or teasers—what you see is what you’ll get.

Your Competitive Advantage Starts with This Report
Unlock how political, economic, and environmental forces are reshaping Cal‑Maine Foods’ market position. Our PESTLE highlights regulatory risks, supply‑chain pressures, consumer trends, and technological shifts to sharpen your investment or strategy. Buy the full, editable report now for actionable insights you can implement immediately.
Political factors
Farm and ag policy direction
US farm bills shape subsidies, insurance and conservation programs that affect feed costs and capital planning; USDA season-average corn price was about $4.50/bu in 2024–25, directly impacting feed expense. Shifts toward animal welfare or biosecurity funding raise compliance costs for large-scale egg producers. Cal-Maine, with roughly 20% of the U.S. shell-egg market, must track allocations—policy stability lowers planning risk; gridlock raises uncertainty.
State-level ag mandates
State-level mandates such as California’s Proposition 12 (116 square inches for laying hens) reshape market access and welfare terms in a state of roughly 39 million residents, effectively exporting standards beyond borders. Divergent requirements across states force divergent packaging, SKU and network plans, raising logistics and forecasting costs. As the largest U.S. shell egg producer, Cal-Maine’s scale aids adaptation but multiplies compliance complexity and inspection exposure.
Trade and tariff impacts
Cal-Maine, the largest US shell-egg producer, faces input-cost pressure as US steel tariffs (25%) and aluminum duties (10%) raise equipment and packaging expenses and tariffs on corn/soy imports can ripple through feed costs. Export rules and shifts in egg-product shipments can tighten domestic supply, while tightened biosecurity amid geopolitical tensions raises compliance costs. Hedging and supplier diversification help mitigate this volatility.
Labor and immigration stance
Enforcement intensity and visa policy materially affect Cal-Maine operations: DOL-certified H-2A positions rose to about 318,000 in FY2023, tightening seasonal labor availability and pushing average hired farmworker pay toward roughly $16.95/hour in 2023, raising labor costs and execution risk. Political shifts can lift wages or limit seasonal hires, improving automation ROI where workforce programs subsidize capital investment.
- H-2A growth: ~318,000 certified positions (FY2023)
- Avg hired farm wage: ~$16.95/hr (2023)
- Stable access lowers execution risk
Infrastructure and energy policy
Funding for roads, ports and grid reliability directly impacts Cal‑Maine’s cold‑chain uptime and service levels; the Bipartisan Infrastructure Law committed roughly 1.2 trillion dollars to such projects, while the Inflation Reduction Act’s ~369 billion dollars in clean energy incentives improves onsite energy economics and ROI for solar-plus-storage deployments; tightening fuel and EPA standards raise freight costs; policy direction shapes long‑term capex priorities.
- Funding: BIL ~1.2 trillion
- Renewables: IRA ~369 billion
- Fuel standards: upward pressure on freight costs
- Capex: policy steers cold‑chain investments
Corn $4.50/bu, labor costs and rules push automation and compliance spend
US farm bills, tariffs and biosecurity rules drive feed, equipment and compliance costs—USDA season‑average corn ~ $4.50/bu (2024–25) raises feed expense. State mandates like CA Prop 12 and divergent rules increase packaging, logistics and inspection complexity for Cal‑Maine (≈20% U.S. shell‑egg market). Labor and infrastructure policy—H‑2A ~318,000 (FY2023); avg hired farm wage ~$16.95/hr (2023)—push automation and capex decisions.
| Metric | Value |
|---|---|
| Cal‑Maine market share | ~20% |
| USDA corn price (2024–25) | $4.50/bu |
| H‑2A positions (FY2023) | ~318,000 |
| Avg farm wage (2023) | $16.95/hr |
What is included in the product
Detailed Word Document
Provides a data‑backed PESTLE evaluation of Cal‑Maine Foods across Political, Economic, Social, Technological, Environmental and Legal dimensions, highlighting region‑ and industry‑specific risks and opportunities and offering forward‑looking insights for scenario planning. Designed for executives, investors and strategists to inform reports, plans and funding decisions.
Customizable Excel Spreadsheet
A concise, categorized PESTLE summary of Cal‑Maine Foods for easy meeting use, highlighting regulatory, supply‑chain and market risks and opportunities; editable notes let teams tailor insights by region or product, ideal for slides, strategy sessions, and quick cross‑department alignment.
Economic factors
Feed cost volatility
Corn and soybean meal represent roughly 70% of Cal-Maine’s feed ingredient costs, with corn futures averaging about $5.30/bu in 2024 and soybean meal near $420/ton in 2024. Weather, US biofuel mandates and rising global demand drove wide swings—corn ranged +/-30% year-over-year in 2023–24. Basis risk between futures and local cash markets complicates hedging effectiveness. Ability to pass costs through depends on retail contract terms and market tightness, especially during supply shocks.
Egg price cyclicality
Egg markets are highly sensitive to supply shocks and seasonal demand, with the 2022 HPAI outbreak culling over 50 million birds and driving wholesale egg prices from under $1 to about $3.50 per dozen at peak. Recovery cycles reset supply, often producing sharp price declines that compress margins. Industry overexpansion after spikes further squeezes returns. Revenue volatility forces Cal-Maine to emphasize disciplined capacity and dynamic pricing.
Consumer spending and mix
Macro shifts push demand between value and specialty eggs, with inflation-driven trade-downs favoring conventional or private-label cartons while periods of real wage growth lift cage-free and organic sales. Cal-Maine, the largest U.S. shell-egg producer with roughly 20% market share, benefits from breadth across conventional, cage-free and specialty SKUs. That portfolio diversity helps buffer margin and volume swings as consumer mix rotates.
Logistics and fuel costs
Diesel and freight rates directly affect Cal-Maine Foods’ delivered cost to retailers; U.S. diesel averaged about $3.85/gal in 2024 (EIA), pressuring per-case transport costs and margins. Tight trucking capacity in 2024–25 elevated surcharges and service risk, while higher network density on core routes improves drop economics. Fuel hedges and mode optimization (rail/intermodal where feasible) have been used to protect margins.
- Diesel avg ~ $3.85/gal (2024, EIA)
- Tight capacity → higher surcharges & service risk
- Network density lowers per-drop cost
- Fuel hedges + mode optimization protect margins
Retailer bargaining power
Retail consolidation gives grocers and club chains strong leverage over Cal‑Maine, pressing pricing and slotting fees while private‑label eggs now account for roughly 15% of category sales; performance‑based contracts that reward on‑time delivery and safety can offset margin pressure. Cal‑Maine’s scale, supplying about 20% of US shell eggs, and brand differentiation help counterbalance retailer power.
- Retailer pricing/slotting pressure
- Private label ~15% of category
- Performance contracts reward reliability
- Cal‑Maine ~20% US shell‑egg supply
Corn $4.50/bu, labor costs and rules push automation and compliance spend
Feed (corn ~70% of feed cost) with 2024 corn futures ~$5.30/bu and soybean meal ~$420/ton drives margin volatility; hedging limited by basis risk. HPAI culled >50M birds (2022) and pushed wholesale eggs to ~$3.50/doz at peak, creating boom‑bust cycles. Cal‑Maine supplies ~20% US shell eggs; private label ~15%; US diesel averaged $3.85/gal in 2024.
| Metric | Value (2024) |
|---|---|
| Corn futures | $5.30/bu |
| Soybean meal | $420/ton |
| HPAI cull | >50M birds |
| Peak wholesale eggs | $3.50/doz |
| Cal‑Maine market share | ~20% |
| Private label share | ~15% |
| US diesel avg | $3.85/gal |
What You See Is What You Get
Cal-Maine Foods PESTLE Analysis
This Cal-Maine Foods PESTLE Analysis preview is the exact document you’ll receive after purchase—fully formatted and ready to use. The content, layout, and professional structure shown here match the final downloadable file. No placeholders or teasers—what you see is what you’ll get.
Description
Your Competitive Advantage Starts with This Report
Unlock how political, economic, and environmental forces are reshaping Cal‑Maine Foods’ market position. Our PESTLE highlights regulatory risks, supply‑chain pressures, consumer trends, and technological shifts to sharpen your investment or strategy. Buy the full, editable report now for actionable insights you can implement immediately.
Political factors
Farm and ag policy direction
US farm bills shape subsidies, insurance and conservation programs that affect feed costs and capital planning; USDA season-average corn price was about $4.50/bu in 2024–25, directly impacting feed expense. Shifts toward animal welfare or biosecurity funding raise compliance costs for large-scale egg producers. Cal-Maine, with roughly 20% of the U.S. shell-egg market, must track allocations—policy stability lowers planning risk; gridlock raises uncertainty.
State-level ag mandates
State-level mandates such as California’s Proposition 12 (116 square inches for laying hens) reshape market access and welfare terms in a state of roughly 39 million residents, effectively exporting standards beyond borders. Divergent requirements across states force divergent packaging, SKU and network plans, raising logistics and forecasting costs. As the largest U.S. shell egg producer, Cal-Maine’s scale aids adaptation but multiplies compliance complexity and inspection exposure.
Trade and tariff impacts
Cal-Maine, the largest US shell-egg producer, faces input-cost pressure as US steel tariffs (25%) and aluminum duties (10%) raise equipment and packaging expenses and tariffs on corn/soy imports can ripple through feed costs. Export rules and shifts in egg-product shipments can tighten domestic supply, while tightened biosecurity amid geopolitical tensions raises compliance costs. Hedging and supplier diversification help mitigate this volatility.
Labor and immigration stance
Enforcement intensity and visa policy materially affect Cal-Maine operations: DOL-certified H-2A positions rose to about 318,000 in FY2023, tightening seasonal labor availability and pushing average hired farmworker pay toward roughly $16.95/hour in 2023, raising labor costs and execution risk. Political shifts can lift wages or limit seasonal hires, improving automation ROI where workforce programs subsidize capital investment.
- H-2A growth: ~318,000 certified positions (FY2023)
- Avg hired farm wage: ~$16.95/hr (2023)
- Stable access lowers execution risk
Infrastructure and energy policy
Funding for roads, ports and grid reliability directly impacts Cal‑Maine’s cold‑chain uptime and service levels; the Bipartisan Infrastructure Law committed roughly 1.2 trillion dollars to such projects, while the Inflation Reduction Act’s ~369 billion dollars in clean energy incentives improves onsite energy economics and ROI for solar-plus-storage deployments; tightening fuel and EPA standards raise freight costs; policy direction shapes long‑term capex priorities.
- Funding: BIL ~1.2 trillion
- Renewables: IRA ~369 billion
- Fuel standards: upward pressure on freight costs
- Capex: policy steers cold‑chain investments
Corn $4.50/bu, labor costs and rules push automation and compliance spend
US farm bills, tariffs and biosecurity rules drive feed, equipment and compliance costs—USDA season‑average corn ~ $4.50/bu (2024–25) raises feed expense. State mandates like CA Prop 12 and divergent rules increase packaging, logistics and inspection complexity for Cal‑Maine (≈20% U.S. shell‑egg market). Labor and infrastructure policy—H‑2A ~318,000 (FY2023); avg hired farm wage ~$16.95/hr (2023)—push automation and capex decisions.
| Metric | Value |
|---|---|
| Cal‑Maine market share | ~20% |
| USDA corn price (2024–25) | $4.50/bu |
| H‑2A positions (FY2023) | ~318,000 |
| Avg farm wage (2023) | $16.95/hr |
What is included in the product
Detailed Word Document
Provides a data‑backed PESTLE evaluation of Cal‑Maine Foods across Political, Economic, Social, Technological, Environmental and Legal dimensions, highlighting region‑ and industry‑specific risks and opportunities and offering forward‑looking insights for scenario planning. Designed for executives, investors and strategists to inform reports, plans and funding decisions.
Customizable Excel Spreadsheet
A concise, categorized PESTLE summary of Cal‑Maine Foods for easy meeting use, highlighting regulatory, supply‑chain and market risks and opportunities; editable notes let teams tailor insights by region or product, ideal for slides, strategy sessions, and quick cross‑department alignment.
Economic factors
Feed cost volatility
Corn and soybean meal represent roughly 70% of Cal-Maine’s feed ingredient costs, with corn futures averaging about $5.30/bu in 2024 and soybean meal near $420/ton in 2024. Weather, US biofuel mandates and rising global demand drove wide swings—corn ranged +/-30% year-over-year in 2023–24. Basis risk between futures and local cash markets complicates hedging effectiveness. Ability to pass costs through depends on retail contract terms and market tightness, especially during supply shocks.
Egg price cyclicality
Egg markets are highly sensitive to supply shocks and seasonal demand, with the 2022 HPAI outbreak culling over 50 million birds and driving wholesale egg prices from under $1 to about $3.50 per dozen at peak. Recovery cycles reset supply, often producing sharp price declines that compress margins. Industry overexpansion after spikes further squeezes returns. Revenue volatility forces Cal-Maine to emphasize disciplined capacity and dynamic pricing.
Consumer spending and mix
Macro shifts push demand between value and specialty eggs, with inflation-driven trade-downs favoring conventional or private-label cartons while periods of real wage growth lift cage-free and organic sales. Cal-Maine, the largest U.S. shell-egg producer with roughly 20% market share, benefits from breadth across conventional, cage-free and specialty SKUs. That portfolio diversity helps buffer margin and volume swings as consumer mix rotates.
Logistics and fuel costs
Diesel and freight rates directly affect Cal-Maine Foods’ delivered cost to retailers; U.S. diesel averaged about $3.85/gal in 2024 (EIA), pressuring per-case transport costs and margins. Tight trucking capacity in 2024–25 elevated surcharges and service risk, while higher network density on core routes improves drop economics. Fuel hedges and mode optimization (rail/intermodal where feasible) have been used to protect margins.
- Diesel avg ~ $3.85/gal (2024, EIA)
- Tight capacity → higher surcharges & service risk
- Network density lowers per-drop cost
- Fuel hedges + mode optimization protect margins
Retailer bargaining power
Retail consolidation gives grocers and club chains strong leverage over Cal‑Maine, pressing pricing and slotting fees while private‑label eggs now account for roughly 15% of category sales; performance‑based contracts that reward on‑time delivery and safety can offset margin pressure. Cal‑Maine’s scale, supplying about 20% of US shell eggs, and brand differentiation help counterbalance retailer power.
- Retailer pricing/slotting pressure
- Private label ~15% of category
- Performance contracts reward reliability
- Cal‑Maine ~20% US shell‑egg supply
Corn $4.50/bu, labor costs and rules push automation and compliance spend
Feed (corn ~70% of feed cost) with 2024 corn futures ~$5.30/bu and soybean meal ~$420/ton drives margin volatility; hedging limited by basis risk. HPAI culled >50M birds (2022) and pushed wholesale eggs to ~$3.50/doz at peak, creating boom‑bust cycles. Cal‑Maine supplies ~20% US shell eggs; private label ~15%; US diesel averaged $3.85/gal in 2024.
| Metric | Value (2024) |
|---|---|
| Corn futures | $5.30/bu |
| Soybean meal | $420/ton |
| HPAI cull | >50M birds |
| Peak wholesale eggs | $3.50/doz |
| Cal‑Maine market share | ~20% |
| Private label share | ~15% |
| US diesel avg | $3.85/gal |
What You See Is What You Get
Cal-Maine Foods PESTLE Analysis
This Cal-Maine Foods PESTLE Analysis preview is the exact document you’ll receive after purchase—fully formatted and ready to use. The content, layout, and professional structure shown here match the final downloadable file. No placeholders or teasers—what you see is what you’ll get.











