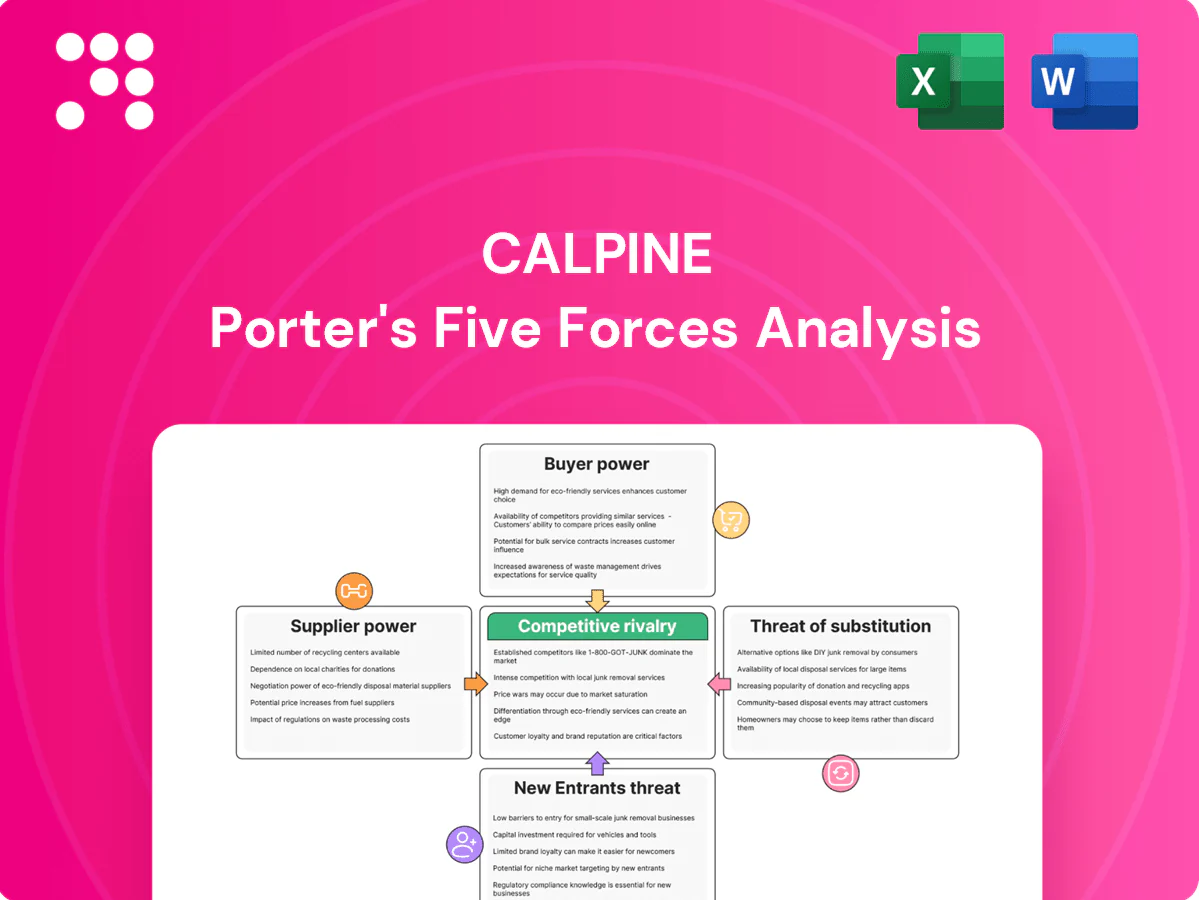
Calpine Porter's Five Forces Analysis

A Must-Have Tool for Decision-Makers
Calpine’s Porter's Five Forces snapshot highlights key competitive dynamics—supplier leverage, buyer power, regulatory pressures, and substitute threats—that shape its profitability and strategic choices. This preview teases force-by-force insights and tactical implications. Unlock the full analysis to access ratings, visuals, and actionable recommendations tailored for investors and strategists.
Suppliers Bargaining Power

Liquid gas markets temper power
Calpine sources gas from deep, liquid North American hubs (Henry Hub and regional hubs) benefiting from US production near 100 Bcf/d in 2024, which limits individual producer leverage; multiple pipelines and trading points support switching and hedging, while standardized contracts and transparent pricing reduce lock-in; supplier power is moderate and cyclical, with seasonal demand and basis spreads typically swinging about $0.5–$3/MMBtu.
Pipeline and transport constraints
Pipeline and transport constraints raise basis costs and tighten supply for Calpine; regional midstream bottlenecks drove basis volatility in 2024, with U.S. export/flow dynamics (≈12 Bcf/d LNG export capacity) amplifying regional spreads. In peak periods firm transport holders extract leverage over interruptible buyers, and regulatory delays on new pipelines exacerbate local scarcity. Calpine mitigates via firm transport rights, gas storage and locational fleet diversification.

Turbine OEM and parts dependence
As of 2024 Calpine depends on concentrated gas turbine OEMs—GE, Siemens Energy and Mitsubishi Power—whose proprietary parts and specialized MRO create vendor leverage. Lead times for critical parts were reported up to 12–18 months in 2024, inflating replacement costs and outage risk. Long-term service agreements (LTSAs) trade availability for vendor power, while strategic spares and multi-vendor sourcing materially reduce exposure.

Geothermal field and drilling services
Geothermal field and drilling services are scarce and specialized, elevating supplier bargaining power for Calpine; Calpine’s flagship The Geysers complex alone is about 725 MW, underscoring the value of reliable drilling and field expertise. Long-term contracts and advance bookings help stabilize costs and capacity, while proprietary reservoir management data from The Geysers can shift technical leverage back to Calpine.
- Supplier concentration: specialized rigs and service firms
- Mitigation: long-term contracts, advance bookings
- Leverage: reservoir data (The Geysers ~725 MW)
Environmental reagents and credits
Compliance inputs such as ammonia/urea and emission credits can tighten in certain markets, and policy shifts or supplier outages have driven price spikes; EU ETS averaged about €100/ton in 2024 while RGGI traded near $13/ton, increasing operating cost exposure for generators like Calpine.
- Supply tightness: ammonia/urea shortages raise compliance costs
- Policy shock: EU ETS ≈ €100/t (2024)
- Mitigation: diversified vendors + inventory buffers
- Market moderation: active credit trading improves liquidity
Moderate supplier power amid deep US gas hubs and LNG-driven regional basis swings
Calpine faces moderate supplier power: deep US gas hubs (≈100 Bcf/d in 2024) and liquid markets limit single-supplier leverage, though regional basis swings ($0.5–$3/MMBtu) persist.
Midstream constraints and ≈12 Bcf/d LNG exports amplify local scarcity; firm transport, storage and fleet locational spread reduce exposure.
OEMs (lead times 12–18 months) and specialized geothermal services (The Geysers ≈725 MW) create pockets of high vendor power; long-term agreements and spares mitigate risk.
| Item | 2024 metric | Impact |
|---|---|---|
| US gas supply | ≈100 Bcf/d | Moderate |
| LNG capacity | ≈12 Bcf/d | Raises basis |
| OEM lead time | 12–18 months | High vendor power |
| Geysers | ≈725 MW | Technical leverage |
| EU ETS / RGGI | €100/t · $13/t | Raises costs |
What is included in the product
 Detailed Word Document
Tailored exclusively for Calpine, this Porter's Five Forces overview uncovers key drivers of competition, buyer and supplier influence, and market entry risks specific to the U.S. power-generation sector. It identifies disruptive threats, substitutes, and regulatory dynamics that shape Calpine’s pricing power and long-term profitability.

 Customizable Excel Spreadsheet
Instant one-sheet Porter’s Five Forces for Calpine—customize pressure levels, swap in your own data, and visualize strategic intensity with an easy spider chart; clean layout fits slides, duplicates for scenario analysis, and requires no macros so non-finance users can act fast.
Customers Bargaining Power

Concentrated wholesale buyers
Utilities, retail providers and large C&I buyers purchase at scale, enhancing leverage over Calpine, whose fleet totals approximately 26 GW of generation capacity as of 2024. These offtakers run competitive RFPs and demand favorable commercial and pricing terms. Creditworthy buyers increasingly seek long-dated PPAs with strict performance and availability clauses. Calpine must price keenly to win and retain contracts.
Transparent market pricing
Seven US ISOs/RTOs (CAISO, ERCOT, PJM, MISO, NYISO, ISO-NE, SPP) publish granular nodal/hourly prices, enabling buyers to negotiate with precise market references. Visible spot and forward curves on venues like ICE/NYMEX anchor expectations and cap seller premiums. Buyers arbitrage between bilateral deals and market exposure using these curves, boosting bargaining power in commoditized power products.

Low switching costs in power
At the wholesale level electricity is largely undifferentiated, so buyers face low switching costs and can move to spot markets or alternate suppliers with minimal friction; organized markets account for roughly half of U.S. load and frequent contract expirations (commonly 1–5 year terms) create regular rebid opportunities. Calpine, with about 26 GW of generation capacity in 2024, seeks to retain customers via reliability, flexible dispatch, and favorable credit terms.

Preference for clean energy
Ancillary and capacity value
Flexible gas assets at Calpine—operator of roughly 27 GW of U.S. generating capacity in 2024—provide ramping, reserves and capacity that buyers pay premiums for in tight systems; in stressed regions ancillary and capacity prices spiked, boosting peaker value. Where supply is ample, those premiums compress and buyer negotiating power increases. Buyer power therefore fluctuates with system conditions and product scarcity.
- Capacity scale: ~27 GW (Calpine, 2024)
- Premiums: ancillary/capacity spikes in tight markets
- Compression: abundant supply lowers premiums
- Buyer power: varies with system tightness
Buyers drive pricing over ~26-27GW fleet; geothermal share small
Large utilities, retail providers and C&I buyers exert strong leverage over Calpine’s ~26–27 GW U.S. fleet (2024) through scale and competitive RFPs.
Seven ISOs/RTOs provide nodal hourly prices and visible forward curves, enabling precise market-referenced negotiation and low switching costs for buyers.
Decarbonization mandates shift demand to renewables/storage; Calpine’s geothermal ~725 MW (~2.8% of fleet) limits green contracting leverage.
| Metric | Value (2024) |
|---|---|
| Calpine capacity | ~26–27 GW |
| Geothermal (The Geysers) | ~725 MW (≈2.8%) |
| ISOs/RTOs | 7 (CAISO, ERCOT, PJM, MISO, NYISO, ISO‑NE, SPP) |
| Organized markets share | ~50% of U.S. load |
| Common PPA terms | 1–5 years |
Preview Before You Purchase
Calpine Porter's Five Forces Analysis
This preview shows the exact Calpine Porter's Five Forces analysis you'll receive immediately after purchase—no surprises, no placeholders. It provides a complete assessment of supplier power, buyer power, competitive rivalry, threats of entry and substitution, and strategic implications specific to Calpine. The document is fully formatted and ready for immediate download and use.

A Must-Have Tool for Decision-Makers
Calpine’s Porter's Five Forces snapshot highlights key competitive dynamics—supplier leverage, buyer power, regulatory pressures, and substitute threats—that shape its profitability and strategic choices. This preview teases force-by-force insights and tactical implications. Unlock the full analysis to access ratings, visuals, and actionable recommendations tailored for investors and strategists.
Suppliers Bargaining Power
Liquid gas markets temper power
Calpine sources gas from deep, liquid North American hubs (Henry Hub and regional hubs) benefiting from US production near 100 Bcf/d in 2024, which limits individual producer leverage; multiple pipelines and trading points support switching and hedging, while standardized contracts and transparent pricing reduce lock-in; supplier power is moderate and cyclical, with seasonal demand and basis spreads typically swinging about $0.5–$3/MMBtu.
Pipeline and transport constraints
Pipeline and transport constraints raise basis costs and tighten supply for Calpine; regional midstream bottlenecks drove basis volatility in 2024, with U.S. export/flow dynamics (≈12 Bcf/d LNG export capacity) amplifying regional spreads. In peak periods firm transport holders extract leverage over interruptible buyers, and regulatory delays on new pipelines exacerbate local scarcity. Calpine mitigates via firm transport rights, gas storage and locational fleet diversification.
Turbine OEM and parts dependence
As of 2024 Calpine depends on concentrated gas turbine OEMs—GE, Siemens Energy and Mitsubishi Power—whose proprietary parts and specialized MRO create vendor leverage. Lead times for critical parts were reported up to 12–18 months in 2024, inflating replacement costs and outage risk. Long-term service agreements (LTSAs) trade availability for vendor power, while strategic spares and multi-vendor sourcing materially reduce exposure.
Geothermal field and drilling services
Geothermal field and drilling services are scarce and specialized, elevating supplier bargaining power for Calpine; Calpine’s flagship The Geysers complex alone is about 725 MW, underscoring the value of reliable drilling and field expertise. Long-term contracts and advance bookings help stabilize costs and capacity, while proprietary reservoir management data from The Geysers can shift technical leverage back to Calpine.
- Supplier concentration: specialized rigs and service firms
- Mitigation: long-term contracts, advance bookings
- Leverage: reservoir data (The Geysers ~725 MW)
Environmental reagents and credits
Compliance inputs such as ammonia/urea and emission credits can tighten in certain markets, and policy shifts or supplier outages have driven price spikes; EU ETS averaged about €100/ton in 2024 while RGGI traded near $13/ton, increasing operating cost exposure for generators like Calpine.
- Supply tightness: ammonia/urea shortages raise compliance costs
- Policy shock: EU ETS ≈ €100/t (2024)
- Mitigation: diversified vendors + inventory buffers
- Market moderation: active credit trading improves liquidity
Moderate supplier power amid deep US gas hubs and LNG-driven regional basis swings
Calpine faces moderate supplier power: deep US gas hubs (≈100 Bcf/d in 2024) and liquid markets limit single-supplier leverage, though regional basis swings ($0.5–$3/MMBtu) persist.
Midstream constraints and ≈12 Bcf/d LNG exports amplify local scarcity; firm transport, storage and fleet locational spread reduce exposure.
OEMs (lead times 12–18 months) and specialized geothermal services (The Geysers ≈725 MW) create pockets of high vendor power; long-term agreements and spares mitigate risk.
| Item | 2024 metric | Impact |
|---|---|---|
| US gas supply | ≈100 Bcf/d | Moderate |
| LNG capacity | ≈12 Bcf/d | Raises basis |
| OEM lead time | 12–18 months | High vendor power |
| Geysers | ≈725 MW | Technical leverage |
| EU ETS / RGGI | €100/t · $13/t | Raises costs |
What is included in the product
Detailed Word Document
Tailored exclusively for Calpine, this Porter's Five Forces overview uncovers key drivers of competition, buyer and supplier influence, and market entry risks specific to the U.S. power-generation sector. It identifies disruptive threats, substitutes, and regulatory dynamics that shape Calpine’s pricing power and long-term profitability.
Customizable Excel Spreadsheet
Instant one-sheet Porter’s Five Forces for Calpine—customize pressure levels, swap in your own data, and visualize strategic intensity with an easy spider chart; clean layout fits slides, duplicates for scenario analysis, and requires no macros so non-finance users can act fast.
Customers Bargaining Power
Concentrated wholesale buyers
Utilities, retail providers and large C&I buyers purchase at scale, enhancing leverage over Calpine, whose fleet totals approximately 26 GW of generation capacity as of 2024. These offtakers run competitive RFPs and demand favorable commercial and pricing terms. Creditworthy buyers increasingly seek long-dated PPAs with strict performance and availability clauses. Calpine must price keenly to win and retain contracts.
Transparent market pricing
Seven US ISOs/RTOs (CAISO, ERCOT, PJM, MISO, NYISO, ISO-NE, SPP) publish granular nodal/hourly prices, enabling buyers to negotiate with precise market references. Visible spot and forward curves on venues like ICE/NYMEX anchor expectations and cap seller premiums. Buyers arbitrage between bilateral deals and market exposure using these curves, boosting bargaining power in commoditized power products.
Low switching costs in power
At the wholesale level electricity is largely undifferentiated, so buyers face low switching costs and can move to spot markets or alternate suppliers with minimal friction; organized markets account for roughly half of U.S. load and frequent contract expirations (commonly 1–5 year terms) create regular rebid opportunities. Calpine, with about 26 GW of generation capacity in 2024, seeks to retain customers via reliability, flexible dispatch, and favorable credit terms.
Preference for clean energy
Ancillary and capacity value
Flexible gas assets at Calpine—operator of roughly 27 GW of U.S. generating capacity in 2024—provide ramping, reserves and capacity that buyers pay premiums for in tight systems; in stressed regions ancillary and capacity prices spiked, boosting peaker value. Where supply is ample, those premiums compress and buyer negotiating power increases. Buyer power therefore fluctuates with system conditions and product scarcity.
- Capacity scale: ~27 GW (Calpine, 2024)
- Premiums: ancillary/capacity spikes in tight markets
- Compression: abundant supply lowers premiums
- Buyer power: varies with system tightness
Buyers drive pricing over ~26-27GW fleet; geothermal share small
Large utilities, retail providers and C&I buyers exert strong leverage over Calpine’s ~26–27 GW U.S. fleet (2024) through scale and competitive RFPs.
Seven ISOs/RTOs provide nodal hourly prices and visible forward curves, enabling precise market-referenced negotiation and low switching costs for buyers.
Decarbonization mandates shift demand to renewables/storage; Calpine’s geothermal ~725 MW (~2.8% of fleet) limits green contracting leverage.
| Metric | Value (2024) |
|---|---|
| Calpine capacity | ~26–27 GW |
| Geothermal (The Geysers) | ~725 MW (≈2.8%) |
| ISOs/RTOs | 7 (CAISO, ERCOT, PJM, MISO, NYISO, ISO‑NE, SPP) |
| Organized markets share | ~50% of U.S. load |
| Common PPA terms | 1–5 years |
Preview Before You Purchase
Calpine Porter's Five Forces Analysis
This preview shows the exact Calpine Porter's Five Forces analysis you'll receive immediately after purchase—no surprises, no placeholders. It provides a complete assessment of supplier power, buyer power, competitive rivalry, threats of entry and substitution, and strategic implications specific to Calpine. The document is fully formatted and ready for immediate download and use.
Description
A Must-Have Tool for Decision-Makers
Calpine’s Porter's Five Forces snapshot highlights key competitive dynamics—supplier leverage, buyer power, regulatory pressures, and substitute threats—that shape its profitability and strategic choices. This preview teases force-by-force insights and tactical implications. Unlock the full analysis to access ratings, visuals, and actionable recommendations tailored for investors and strategists.
Suppliers Bargaining Power
Liquid gas markets temper power
Calpine sources gas from deep, liquid North American hubs (Henry Hub and regional hubs) benefiting from US production near 100 Bcf/d in 2024, which limits individual producer leverage; multiple pipelines and trading points support switching and hedging, while standardized contracts and transparent pricing reduce lock-in; supplier power is moderate and cyclical, with seasonal demand and basis spreads typically swinging about $0.5–$3/MMBtu.
Pipeline and transport constraints
Pipeline and transport constraints raise basis costs and tighten supply for Calpine; regional midstream bottlenecks drove basis volatility in 2024, with U.S. export/flow dynamics (≈12 Bcf/d LNG export capacity) amplifying regional spreads. In peak periods firm transport holders extract leverage over interruptible buyers, and regulatory delays on new pipelines exacerbate local scarcity. Calpine mitigates via firm transport rights, gas storage and locational fleet diversification.
Turbine OEM and parts dependence
As of 2024 Calpine depends on concentrated gas turbine OEMs—GE, Siemens Energy and Mitsubishi Power—whose proprietary parts and specialized MRO create vendor leverage. Lead times for critical parts were reported up to 12–18 months in 2024, inflating replacement costs and outage risk. Long-term service agreements (LTSAs) trade availability for vendor power, while strategic spares and multi-vendor sourcing materially reduce exposure.
Geothermal field and drilling services
Geothermal field and drilling services are scarce and specialized, elevating supplier bargaining power for Calpine; Calpine’s flagship The Geysers complex alone is about 725 MW, underscoring the value of reliable drilling and field expertise. Long-term contracts and advance bookings help stabilize costs and capacity, while proprietary reservoir management data from The Geysers can shift technical leverage back to Calpine.
- Supplier concentration: specialized rigs and service firms
- Mitigation: long-term contracts, advance bookings
- Leverage: reservoir data (The Geysers ~725 MW)
Environmental reagents and credits
Compliance inputs such as ammonia/urea and emission credits can tighten in certain markets, and policy shifts or supplier outages have driven price spikes; EU ETS averaged about €100/ton in 2024 while RGGI traded near $13/ton, increasing operating cost exposure for generators like Calpine.
- Supply tightness: ammonia/urea shortages raise compliance costs
- Policy shock: EU ETS ≈ €100/t (2024)
- Mitigation: diversified vendors + inventory buffers
- Market moderation: active credit trading improves liquidity
Moderate supplier power amid deep US gas hubs and LNG-driven regional basis swings
Calpine faces moderate supplier power: deep US gas hubs (≈100 Bcf/d in 2024) and liquid markets limit single-supplier leverage, though regional basis swings ($0.5–$3/MMBtu) persist.
Midstream constraints and ≈12 Bcf/d LNG exports amplify local scarcity; firm transport, storage and fleet locational spread reduce exposure.
OEMs (lead times 12–18 months) and specialized geothermal services (The Geysers ≈725 MW) create pockets of high vendor power; long-term agreements and spares mitigate risk.
| Item | 2024 metric | Impact |
|---|---|---|
| US gas supply | ≈100 Bcf/d | Moderate |
| LNG capacity | ≈12 Bcf/d | Raises basis |
| OEM lead time | 12–18 months | High vendor power |
| Geysers | ≈725 MW | Technical leverage |
| EU ETS / RGGI | €100/t · $13/t | Raises costs |
What is included in the product
Detailed Word Document
Tailored exclusively for Calpine, this Porter's Five Forces overview uncovers key drivers of competition, buyer and supplier influence, and market entry risks specific to the U.S. power-generation sector. It identifies disruptive threats, substitutes, and regulatory dynamics that shape Calpine’s pricing power and long-term profitability.
Customizable Excel Spreadsheet
Instant one-sheet Porter’s Five Forces for Calpine—customize pressure levels, swap in your own data, and visualize strategic intensity with an easy spider chart; clean layout fits slides, duplicates for scenario analysis, and requires no macros so non-finance users can act fast.
Customers Bargaining Power
Concentrated wholesale buyers
Utilities, retail providers and large C&I buyers purchase at scale, enhancing leverage over Calpine, whose fleet totals approximately 26 GW of generation capacity as of 2024. These offtakers run competitive RFPs and demand favorable commercial and pricing terms. Creditworthy buyers increasingly seek long-dated PPAs with strict performance and availability clauses. Calpine must price keenly to win and retain contracts.
Transparent market pricing
Seven US ISOs/RTOs (CAISO, ERCOT, PJM, MISO, NYISO, ISO-NE, SPP) publish granular nodal/hourly prices, enabling buyers to negotiate with precise market references. Visible spot and forward curves on venues like ICE/NYMEX anchor expectations and cap seller premiums. Buyers arbitrage between bilateral deals and market exposure using these curves, boosting bargaining power in commoditized power products.
Low switching costs in power
At the wholesale level electricity is largely undifferentiated, so buyers face low switching costs and can move to spot markets or alternate suppliers with minimal friction; organized markets account for roughly half of U.S. load and frequent contract expirations (commonly 1–5 year terms) create regular rebid opportunities. Calpine, with about 26 GW of generation capacity in 2024, seeks to retain customers via reliability, flexible dispatch, and favorable credit terms.
Preference for clean energy
Ancillary and capacity value
Flexible gas assets at Calpine—operator of roughly 27 GW of U.S. generating capacity in 2024—provide ramping, reserves and capacity that buyers pay premiums for in tight systems; in stressed regions ancillary and capacity prices spiked, boosting peaker value. Where supply is ample, those premiums compress and buyer negotiating power increases. Buyer power therefore fluctuates with system conditions and product scarcity.
- Capacity scale: ~27 GW (Calpine, 2024)
- Premiums: ancillary/capacity spikes in tight markets
- Compression: abundant supply lowers premiums
- Buyer power: varies with system tightness
Buyers drive pricing over ~26-27GW fleet; geothermal share small
Large utilities, retail providers and C&I buyers exert strong leverage over Calpine’s ~26–27 GW U.S. fleet (2024) through scale and competitive RFPs.
Seven ISOs/RTOs provide nodal hourly prices and visible forward curves, enabling precise market-referenced negotiation and low switching costs for buyers.
Decarbonization mandates shift demand to renewables/storage; Calpine’s geothermal ~725 MW (~2.8% of fleet) limits green contracting leverage.
| Metric | Value (2024) |
|---|---|
| Calpine capacity | ~26–27 GW |
| Geothermal (The Geysers) | ~725 MW (≈2.8%) |
| ISOs/RTOs | 7 (CAISO, ERCOT, PJM, MISO, NYISO, ISO‑NE, SPP) |
| Organized markets share | ~50% of U.S. load |
| Common PPA terms | 1–5 years |
Preview Before You Purchase
Calpine Porter's Five Forces Analysis
This preview shows the exact Calpine Porter's Five Forces analysis you'll receive immediately after purchase—no surprises, no placeholders. It provides a complete assessment of supplier power, buyer power, competitive rivalry, threats of entry and substitution, and strategic implications specific to Calpine. The document is fully formatted and ready for immediate download and use.











