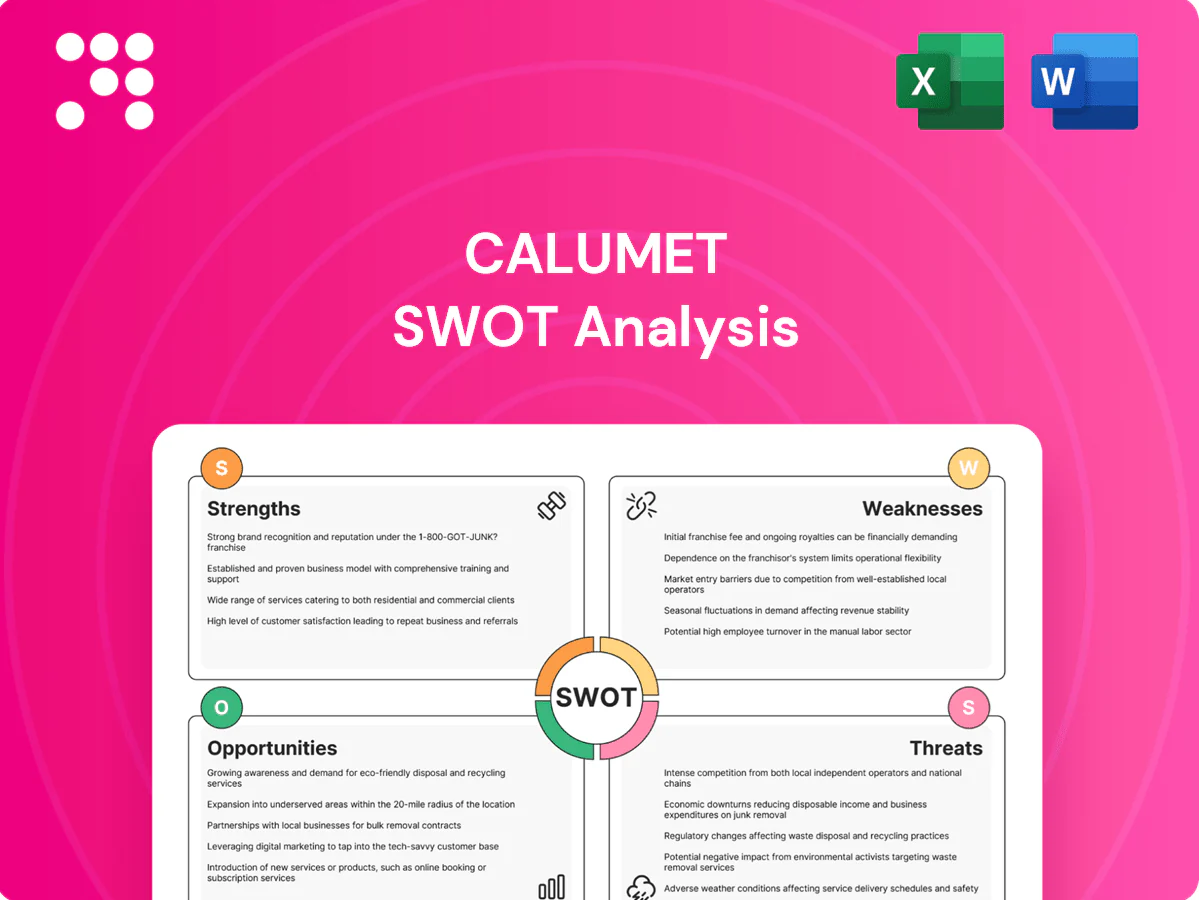
Calumet SWOT Analysis

Go Beyond the Preview—Access the Full Strategic Report
Discover how Calumet's operational strengths, regulatory exposures, and growth opportunities shape its competitive stance. Our concise SWOT preview highlights key takeaways—purchase the full analysis for deep financial context, risk scenarios, and strategic recommendations. Get the editable Word and Excel deliverables to plan, pitch, or invest with confidence.
Strengths

Diverse specialty portfolio
Calumet’s broad slate of lubricating oils, solvents and waxes—which represented about 55% of product revenue in 2024—delivers higher-margin, more resilient cashflows versus commodity fuels. Customized and niche formulations drive customer stickiness through technical service and tailored specs. Specialty blends smooth earnings across cycles by offsetting fuel-margin volatility. Cross-selling across industrial and consumer end-markets expands wallet share and utilization.
Customization and technical know-how
Calumet’s ability to customize hydrocarbon products to exacting specs—via application engineering, advanced blending expertise and close customer collaboration—acts as a clear competitive moat. Rigorous qualification processes and high switching costs lock in customers and enable multi-year contracts. Technical support and bespoke formulations justify premium pricing and higher margin profiles for specialized segments.

Integrated refining and logistics footprint
Owning and operating refining and logistics assets gives Calumet feedstock flexibility and the ability to optimize its product slate across fuels and specialties, supporting margin-driven shifts in output. Proximity to North American customers and established distribution channels enhances market access and shortens delivery cycles. Direct operational control improves reliability and uptime, enabling rapid pivots between specialty and fuel production as market spreads change.

Diverse end-market exposure
Calumet serves industrial, transportation, consumer and commercial users—automotive lubricants, aviation fuels and packaging waxes—lowering concentration risk and cushioning sector-specific downturns through varied demand drivers and broad customer relationships that generate recurring orders.
- Diversified end-markets
- Multiple demand drivers
- Recurring B2B orders
Growing renewable fuels platform
Calumet’s expansion into renewable diesel and SAF strengthens growth and ESG positioning, supported by IRA SAF tax credits of up to 1.25 USD/gal and California LCFS credits near 120 USD/MT in 2024, enabling premium pricing and lower carbon intensity value. The platform offers optionality to scale production and diversify earnings across fuels, aligning with the long-term energy transition and rising SAF mandates.
Specialty-heavy product mix boosts margins, recurring contracts and renewable fuel optionality
Calumet’s 2024 product mix—about 55% lubricants, solvents and waxes—yields higher-margin, more resilient cashflows versus commodity fuels. Advanced blending and technical support create high switching costs and multi-year contracts, enabling premium pricing. Asset ownership provides feedstock flexibility to shift between specialties and fuels; renewable diesel/SAF optionality taps IRA SAF credit and LCFS value.
| Metric | Value (2024) |
|---|---|
| Specialty product revenue share | ~55% |
| IRA SAF credit | up to 1.25 USD/gal |
| CA LCFS value | ~120 USD/MT |
What is included in the product
 Detailed Word Document
Delivers a strategic overview of Calumet’s internal strengths and weaknesses and external opportunities and threats, highlighting refinery operations, feedstock flexibility, market exposure, regulatory and commodity risks to assess competitive position and growth prospects.

 Customizable Excel Spreadsheet
Provides a focused Calumet SWOT matrix for fast, visual strategy alignment, highlighting refinery-specific risks, market drivers, and regulatory opportunities. Ideal for executives needing a quick snapshot to guide capital allocation and operational decisions.
Weaknesses

Feedstock price exposure
Calumet's margins are highly exposed to crude and natural gas volatility—WTI averaged about $78/bbl in 2024 and Henry Hub near $2.8/MMBtu—so feedstock swings materially change input costs. Specialty product contracts typically pass costs with lags of 30–90 days, creating timing mismatches that compress margins during price moves. Basis risk and limited hedging coverage across all product lines leave residual exposure. Sensitivity spikes during rapid commodity swings, amplifying earnings volatility.
Smaller scale vs supermajors
Smaller scale vs supermajors limits Calumet's purchasing power, capex capacity, and global reach, constraining ability to secure low-cost feedstock and fund large projects. This makes competing for large enterprise accounts and breadth of R&D offerings difficult, reducing appeal for multinational customers. Calumet has less bargaining leverage with suppliers and logistics providers, raising input and transport costs. Scale constraints also slow geographic and asset expansion.

Environmental liabilities and capex
Refining assets expose Calumet to ongoing remediation, permitting, monitoring and emissions-reduction capital costs that require multi-million-dollar investment cycles for equipment upgrades and compliance. Legacy sites create potential cleanup liabilities and contingent obligations that can be material to cash flow if remediation scopes expand. These obligations increase operating and capital intensity, constraining free cash flow and limiting investment flexibility.

Earnings cyclicality from fuels
Exposure to gasoline, diesel and jet fuel ties Calumet earnings to crack spread swings, so fuel downturns can wipe out steadier specialty-product margins. Scheduled turnarounds and unplanned outages amplify quarterly volatility and complicate cash-flow visibility. A mixed product slate makes feedstock allocation and hedging more complex, increasing planning risk.
- Crack spread-driven revenue swings
- Fuel drops can eclipse specialty margins
- Turnarounds/outages amplify volatility
- Mixed slate complicates feedstock/hedge planning
Complexity of product mix
Managing a product mix spanning hundreds of SKUs raises scheduling, quality-control, and inventory risks, forcing higher buffer stocks and frequent line changeovers; qualification cycles for specialty blends often take several months, delaying product switches and time-to-revenue, which elevates working-capital needs for multiple feedstocks and intermediates and pushes operating costs higher.
Commodity swings, passthrough lags and legacy remediation squeeze margins and cash flow
Margins exposed to crude/gas swings (WTI $78/bbl 2024; Henry Hub $2.8/MMBtu) plus 30–90 day passthrough lags compress profitability and amplify earnings volatility. Smaller scale limits purchasing power, capex flexibility and global reach, raising input/logistics costs. Legacy sites and multi-million-dollar remediation/capex obligations strain free cash flow and investment optionality.
| Metric | Value |
|---|---|
| WTI (2024) | $78/bbl |
| Henry Hub (2024) | $2.8/MMBtu |
| Product SKUs | hundreds |
| Remediation capex | multi-million $ |
Same Document Delivered
Calumet SWOT Analysis
This is the actual Calumet SWOT analysis document you’ll receive upon purchase—no surprises, just professional quality. The preview below is taken directly from the full SWOT report you'll get. Once purchased, you’ll receive the complete, editable version.

Go Beyond the Preview—Access the Full Strategic Report
Discover how Calumet's operational strengths, regulatory exposures, and growth opportunities shape its competitive stance. Our concise SWOT preview highlights key takeaways—purchase the full analysis for deep financial context, risk scenarios, and strategic recommendations. Get the editable Word and Excel deliverables to plan, pitch, or invest with confidence.
Strengths
Diverse specialty portfolio
Calumet’s broad slate of lubricating oils, solvents and waxes—which represented about 55% of product revenue in 2024—delivers higher-margin, more resilient cashflows versus commodity fuels. Customized and niche formulations drive customer stickiness through technical service and tailored specs. Specialty blends smooth earnings across cycles by offsetting fuel-margin volatility. Cross-selling across industrial and consumer end-markets expands wallet share and utilization.
Customization and technical know-how
Calumet’s ability to customize hydrocarbon products to exacting specs—via application engineering, advanced blending expertise and close customer collaboration—acts as a clear competitive moat. Rigorous qualification processes and high switching costs lock in customers and enable multi-year contracts. Technical support and bespoke formulations justify premium pricing and higher margin profiles for specialized segments.
Integrated refining and logistics footprint
Owning and operating refining and logistics assets gives Calumet feedstock flexibility and the ability to optimize its product slate across fuels and specialties, supporting margin-driven shifts in output. Proximity to North American customers and established distribution channels enhances market access and shortens delivery cycles. Direct operational control improves reliability and uptime, enabling rapid pivots between specialty and fuel production as market spreads change.
Diverse end-market exposure
Calumet serves industrial, transportation, consumer and commercial users—automotive lubricants, aviation fuels and packaging waxes—lowering concentration risk and cushioning sector-specific downturns through varied demand drivers and broad customer relationships that generate recurring orders.
- Diversified end-markets
- Multiple demand drivers
- Recurring B2B orders
Growing renewable fuels platform
Calumet’s expansion into renewable diesel and SAF strengthens growth and ESG positioning, supported by IRA SAF tax credits of up to 1.25 USD/gal and California LCFS credits near 120 USD/MT in 2024, enabling premium pricing and lower carbon intensity value. The platform offers optionality to scale production and diversify earnings across fuels, aligning with the long-term energy transition and rising SAF mandates.
Specialty-heavy product mix boosts margins, recurring contracts and renewable fuel optionality
Calumet’s 2024 product mix—about 55% lubricants, solvents and waxes—yields higher-margin, more resilient cashflows versus commodity fuels. Advanced blending and technical support create high switching costs and multi-year contracts, enabling premium pricing. Asset ownership provides feedstock flexibility to shift between specialties and fuels; renewable diesel/SAF optionality taps IRA SAF credit and LCFS value.
| Metric | Value (2024) |
|---|---|
| Specialty product revenue share | ~55% |
| IRA SAF credit | up to 1.25 USD/gal |
| CA LCFS value | ~120 USD/MT |
What is included in the product
Detailed Word Document
Delivers a strategic overview of Calumet’s internal strengths and weaknesses and external opportunities and threats, highlighting refinery operations, feedstock flexibility, market exposure, regulatory and commodity risks to assess competitive position and growth prospects.
Customizable Excel Spreadsheet
Provides a focused Calumet SWOT matrix for fast, visual strategy alignment, highlighting refinery-specific risks, market drivers, and regulatory opportunities. Ideal for executives needing a quick snapshot to guide capital allocation and operational decisions.
Weaknesses
Feedstock price exposure
Calumet's margins are highly exposed to crude and natural gas volatility—WTI averaged about $78/bbl in 2024 and Henry Hub near $2.8/MMBtu—so feedstock swings materially change input costs. Specialty product contracts typically pass costs with lags of 30–90 days, creating timing mismatches that compress margins during price moves. Basis risk and limited hedging coverage across all product lines leave residual exposure. Sensitivity spikes during rapid commodity swings, amplifying earnings volatility.
Smaller scale vs supermajors
Smaller scale vs supermajors limits Calumet's purchasing power, capex capacity, and global reach, constraining ability to secure low-cost feedstock and fund large projects. This makes competing for large enterprise accounts and breadth of R&D offerings difficult, reducing appeal for multinational customers. Calumet has less bargaining leverage with suppliers and logistics providers, raising input and transport costs. Scale constraints also slow geographic and asset expansion.
Environmental liabilities and capex
Refining assets expose Calumet to ongoing remediation, permitting, monitoring and emissions-reduction capital costs that require multi-million-dollar investment cycles for equipment upgrades and compliance. Legacy sites create potential cleanup liabilities and contingent obligations that can be material to cash flow if remediation scopes expand. These obligations increase operating and capital intensity, constraining free cash flow and limiting investment flexibility.
Earnings cyclicality from fuels
Exposure to gasoline, diesel and jet fuel ties Calumet earnings to crack spread swings, so fuel downturns can wipe out steadier specialty-product margins. Scheduled turnarounds and unplanned outages amplify quarterly volatility and complicate cash-flow visibility. A mixed product slate makes feedstock allocation and hedging more complex, increasing planning risk.
- Crack spread-driven revenue swings
- Fuel drops can eclipse specialty margins
- Turnarounds/outages amplify volatility
- Mixed slate complicates feedstock/hedge planning
Complexity of product mix
Managing a product mix spanning hundreds of SKUs raises scheduling, quality-control, and inventory risks, forcing higher buffer stocks and frequent line changeovers; qualification cycles for specialty blends often take several months, delaying product switches and time-to-revenue, which elevates working-capital needs for multiple feedstocks and intermediates and pushes operating costs higher.
Commodity swings, passthrough lags and legacy remediation squeeze margins and cash flow
Margins exposed to crude/gas swings (WTI $78/bbl 2024; Henry Hub $2.8/MMBtu) plus 30–90 day passthrough lags compress profitability and amplify earnings volatility. Smaller scale limits purchasing power, capex flexibility and global reach, raising input/logistics costs. Legacy sites and multi-million-dollar remediation/capex obligations strain free cash flow and investment optionality.
| Metric | Value |
|---|---|
| WTI (2024) | $78/bbl |
| Henry Hub (2024) | $2.8/MMBtu |
| Product SKUs | hundreds |
| Remediation capex | multi-million $ |
Same Document Delivered
Calumet SWOT Analysis
This is the actual Calumet SWOT analysis document you’ll receive upon purchase—no surprises, just professional quality. The preview below is taken directly from the full SWOT report you'll get. Once purchased, you’ll receive the complete, editable version.
Original: $10.00
-65%$10.00
$3.50Description
Go Beyond the Preview—Access the Full Strategic Report
Discover how Calumet's operational strengths, regulatory exposures, and growth opportunities shape its competitive stance. Our concise SWOT preview highlights key takeaways—purchase the full analysis for deep financial context, risk scenarios, and strategic recommendations. Get the editable Word and Excel deliverables to plan, pitch, or invest with confidence.
Strengths
Diverse specialty portfolio
Calumet’s broad slate of lubricating oils, solvents and waxes—which represented about 55% of product revenue in 2024—delivers higher-margin, more resilient cashflows versus commodity fuels. Customized and niche formulations drive customer stickiness through technical service and tailored specs. Specialty blends smooth earnings across cycles by offsetting fuel-margin volatility. Cross-selling across industrial and consumer end-markets expands wallet share and utilization.
Customization and technical know-how
Calumet’s ability to customize hydrocarbon products to exacting specs—via application engineering, advanced blending expertise and close customer collaboration—acts as a clear competitive moat. Rigorous qualification processes and high switching costs lock in customers and enable multi-year contracts. Technical support and bespoke formulations justify premium pricing and higher margin profiles for specialized segments.
Integrated refining and logistics footprint
Owning and operating refining and logistics assets gives Calumet feedstock flexibility and the ability to optimize its product slate across fuels and specialties, supporting margin-driven shifts in output. Proximity to North American customers and established distribution channels enhances market access and shortens delivery cycles. Direct operational control improves reliability and uptime, enabling rapid pivots between specialty and fuel production as market spreads change.
Diverse end-market exposure
Calumet serves industrial, transportation, consumer and commercial users—automotive lubricants, aviation fuels and packaging waxes—lowering concentration risk and cushioning sector-specific downturns through varied demand drivers and broad customer relationships that generate recurring orders.
- Diversified end-markets
- Multiple demand drivers
- Recurring B2B orders
Growing renewable fuels platform
Calumet’s expansion into renewable diesel and SAF strengthens growth and ESG positioning, supported by IRA SAF tax credits of up to 1.25 USD/gal and California LCFS credits near 120 USD/MT in 2024, enabling premium pricing and lower carbon intensity value. The platform offers optionality to scale production and diversify earnings across fuels, aligning with the long-term energy transition and rising SAF mandates.
Specialty-heavy product mix boosts margins, recurring contracts and renewable fuel optionality
Calumet’s 2024 product mix—about 55% lubricants, solvents and waxes—yields higher-margin, more resilient cashflows versus commodity fuels. Advanced blending and technical support create high switching costs and multi-year contracts, enabling premium pricing. Asset ownership provides feedstock flexibility to shift between specialties and fuels; renewable diesel/SAF optionality taps IRA SAF credit and LCFS value.
| Metric | Value (2024) |
|---|---|
| Specialty product revenue share | ~55% |
| IRA SAF credit | up to 1.25 USD/gal |
| CA LCFS value | ~120 USD/MT |
What is included in the product
Detailed Word Document
Delivers a strategic overview of Calumet’s internal strengths and weaknesses and external opportunities and threats, highlighting refinery operations, feedstock flexibility, market exposure, regulatory and commodity risks to assess competitive position and growth prospects.
Customizable Excel Spreadsheet
Provides a focused Calumet SWOT matrix for fast, visual strategy alignment, highlighting refinery-specific risks, market drivers, and regulatory opportunities. Ideal for executives needing a quick snapshot to guide capital allocation and operational decisions.
Weaknesses
Feedstock price exposure
Calumet's margins are highly exposed to crude and natural gas volatility—WTI averaged about $78/bbl in 2024 and Henry Hub near $2.8/MMBtu—so feedstock swings materially change input costs. Specialty product contracts typically pass costs with lags of 30–90 days, creating timing mismatches that compress margins during price moves. Basis risk and limited hedging coverage across all product lines leave residual exposure. Sensitivity spikes during rapid commodity swings, amplifying earnings volatility.
Smaller scale vs supermajors
Smaller scale vs supermajors limits Calumet's purchasing power, capex capacity, and global reach, constraining ability to secure low-cost feedstock and fund large projects. This makes competing for large enterprise accounts and breadth of R&D offerings difficult, reducing appeal for multinational customers. Calumet has less bargaining leverage with suppliers and logistics providers, raising input and transport costs. Scale constraints also slow geographic and asset expansion.
Environmental liabilities and capex
Refining assets expose Calumet to ongoing remediation, permitting, monitoring and emissions-reduction capital costs that require multi-million-dollar investment cycles for equipment upgrades and compliance. Legacy sites create potential cleanup liabilities and contingent obligations that can be material to cash flow if remediation scopes expand. These obligations increase operating and capital intensity, constraining free cash flow and limiting investment flexibility.
Earnings cyclicality from fuels
Exposure to gasoline, diesel and jet fuel ties Calumet earnings to crack spread swings, so fuel downturns can wipe out steadier specialty-product margins. Scheduled turnarounds and unplanned outages amplify quarterly volatility and complicate cash-flow visibility. A mixed product slate makes feedstock allocation and hedging more complex, increasing planning risk.
- Crack spread-driven revenue swings
- Fuel drops can eclipse specialty margins
- Turnarounds/outages amplify volatility
- Mixed slate complicates feedstock/hedge planning
Complexity of product mix
Managing a product mix spanning hundreds of SKUs raises scheduling, quality-control, and inventory risks, forcing higher buffer stocks and frequent line changeovers; qualification cycles for specialty blends often take several months, delaying product switches and time-to-revenue, which elevates working-capital needs for multiple feedstocks and intermediates and pushes operating costs higher.
Commodity swings, passthrough lags and legacy remediation squeeze margins and cash flow
Margins exposed to crude/gas swings (WTI $78/bbl 2024; Henry Hub $2.8/MMBtu) plus 30–90 day passthrough lags compress profitability and amplify earnings volatility. Smaller scale limits purchasing power, capex flexibility and global reach, raising input/logistics costs. Legacy sites and multi-million-dollar remediation/capex obligations strain free cash flow and investment optionality.
| Metric | Value |
|---|---|
| WTI (2024) | $78/bbl |
| Henry Hub (2024) | $2.8/MMBtu |
| Product SKUs | hundreds |
| Remediation capex | multi-million $ |
Same Document Delivered
Calumet SWOT Analysis
This is the actual Calumet SWOT analysis document you’ll receive upon purchase—no surprises, just professional quality. The preview below is taken directly from the full SWOT report you'll get. Once purchased, you’ll receive the complete, editable version.











