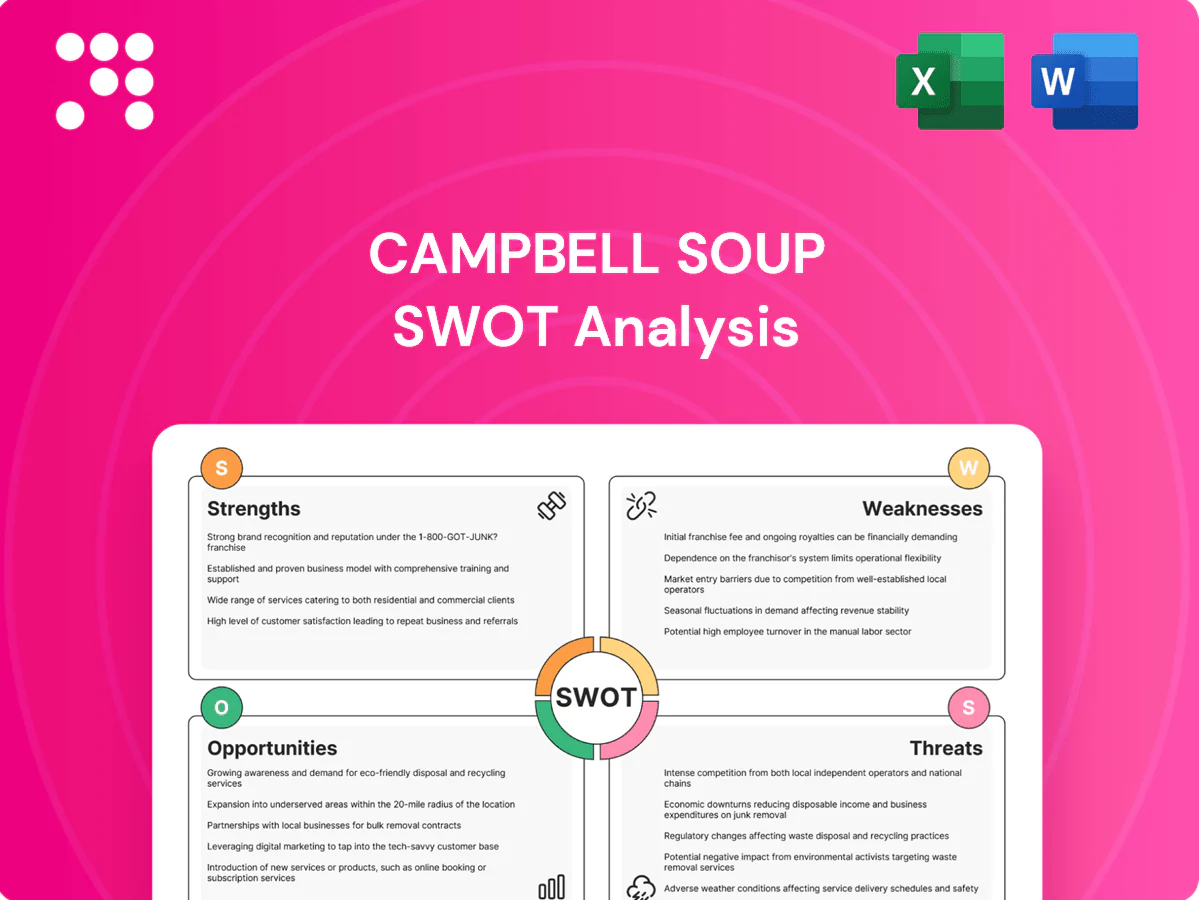
Campbell Soup SWOT Analysis

Make Insightful Decisions Backed by Expert Research
Campbell Soup’s recognizable brands and scale mask supply-chain pressures and shifting consumer tastes; our SWOT distills what matters for investors and strategists. Want the full picture—actionable strengths, risks, and growth levers? Purchase the complete SWOT for a professionally formatted, editable report and Excel matrix to plan and pitch with confidence.
Strengths

Iconic brands with high household penetration
Campbell’s portfolio—Campbell’s, Pepperidge Farm (Goldfish), Prego, Pace, V8, Snyder’s, Kettle Brand and Rao’s—delivers strong recognition and repeat, with portfolio reach in over 90% of US households and FY2024 net sales of $8.6 billion. Broad shelf presence supports velocity and resilient baseline demand. High brand equity provides pricing power and profitable line extensions, while loyalty buffers category cyclicality.
Diversified Meals & Beverages and Snacks portfolio
Campbell’s balanced portfolio across soups, sauces, broths, snacks and beverages mitigates single-category risk, supporting resilience as fiscal 2024 net sales were about $7.2 billion. Snacks drive higher-growth share and mix benefits while core meals supply scale and steady cash flow. Cross-category merchandising enhances retailer partnerships and the breadth of SKUs enables dynamic revenue-management levers.

Scale distribution and retail relationships
Campbell leverages deep ties with major grocers and mass, club, and dollar channels to secure shelf placement and broad promotional reach, ensuring national visibility for core brands. Its national DSD and warehouse network supports snack freshness and reliable service levels, enabling fast replenishment. Scale delivers preferential slotting, end-cap access, and stronger trade terms, while consistent execution sustains market share.

Operational efficiencies and cash generation
Campbell Soup (CPB) leverages an established manufacturing footprint and centralized procurement to sustain margins, while ongoing productivity programs help offset input inflation and improve cost-to-serve. Strong free cash flow in FY2024 funded dividends, debt reduction, and targeted M&A, and network optimization raised fill rates and lowered logistics costs.
- Established footprint supports margins
- FY2024 FCF funded dividends/debt/M&A
- Productivity offsets input inflation
- Network optimization improves fill rates
Premiumization via Rao’s and better-for-you offerings
Rao’s expands Campbell’s presence in premium Italian sauces and ready meals, while Pacific Foods and other clean-label lines meet growing consumer demand for simple-ingredient, better-for-you options; this premium mix supports higher price realization and improved margins and enables brand stretch into adjacent meal occasions.
- Rao’s: premium Italian sauces/meals
- Pacific Foods: clean-label, wellness
- Premium mix: better price realization
- Brand stretch: adjacent meal innovation
National brands reach >90% of US homes; FY24 sales $8.6B
Strong national brands reach >90% of US households; FY2024 net sales $8.6B. Diversified portfolio across soups, snacks, sauces and beverages supports steady cash flow and higher-growth snack mix. Scale in retail and supply chain drives trade terms and fill rates; productivity programs and network optimization sustain margins and funded dividends, debt reduction and targeted M&A.
| Metric | Value | Note |
|---|---|---|
| Household Reach | >90% | National brands |
| FY2024 Net Sales | $8.6B | Company reported |
| Portfolio Mix | Soups, Snacks, Sauces, Beverages | Diversified revenue |
What is included in the product
 Detailed Word Document
Provides a concise SWOT analysis of Campbell Soup, outlining internal strengths and weaknesses and external opportunities and threats. Evaluates competitive position, growth drivers, operational gaps, and market risks shaping the company’s strategic outlook.

 Customizable Excel Spreadsheet
Provides a concise Campbell Soup SWOT matrix for fast strategic alignment and stakeholder-ready summaries, easing decision-making across product lines and market initiatives.
Weaknesses

Category concentration in center-store soups
Heavy exposure to legacy canned center-store soups ties Campbell’s results to a mature, often low- to single-digit declining segment; industry data show refrigerated and fresh formats growing faster year-over-year. Shifts toward fresh/refrigerated offerings have damped center-store growth and force constant SKU renovation and marketing investment to sustain relevance. This dependence constrains margin and channel expansion into faster-growing fresh and refrigerated categories.
Heavy North America revenue reliance
Heavy reliance on North America—Campbell generated roughly 90%+ of net sales from the U.S. and Canada in FY2024—limits diversification versus global peers and concentrates country risk. FX upside is limited and regional downturns bite harder, as international exposure remains small. Growth optionality outside the U.S./Canada is underdeveloped and significant global white spaces remain untapped.

Exposure to commodity and packaging volatility
Exposure to steel, tomatoes, wheat, oils and logistics drives volatile COGS and pressures gross margin as retail price adjustments lag raw‑material spikes. Short‑term profitability is compressed when cost inflation outpaces shelf price pass‑through. Financial hedges and index contracts only partially mitigate input variability. Concentrated supplier bases and single‑region sourcing can amplify supply shocks and cost swings.

Complex integration and SKU rationalization
Multiple acquisitions (eg, Snyder's‑Lance acquisition for $4.87B in 2018) require sustained synergy capture and complex systems harmonization; SKU rationalization risks temporary shelf losses and assortment gaps, while integration can divert R&D and marketing resources and execution missteps may erode retailer confidence.
- Synergy capture: long tail post‑2018
- SKU cuts: short‑term shelf risk
- Resource drag: less innovation
- Retailer trust: fragile after missteps
Perception challenges on sodium and processed foods
Health-conscious consumers scrutinize Campbell soups and snacks for sodium, sugar and additives, pressuring reformulation that must preserve taste while meeting nutrition targets; Campbell reported roughly $8.1 billion in net sales in FY2024, exposing revenue risk if reformulation slows velocity in retail or foodservice. Labeling shifts and voluntary sodium reduction guidance raise R&D and compliance costs.
- Perception risk: sodium/additives
- Reformulation vs taste trade-off
- Channel velocity capped by negative sentiment
- R&D/compliance burden from labeling shifts
Center-store decline and input volatility squeeze margins, fresh up ~5%
Legacy canned center‑store dependence ties results to a low‑single‑digit declining segment while refrigerated/fresh channels grew ~5% YoY; margins and SKU churn suffer. FY2024 net sales $8.1B with 90%+ U.S./Canada exposure concentrates country risk. Input volatility (steel, tomatoes, oils) and post‑2018 Snyder's‑Lance $4.87B integration pressure margins and execution.
| Weakness | Impact | FY2024 metric |
|---|---|---|
| Center‑store reliance | Declining volume | ~5% refrigerated growth |
| Regional concentration | Country risk | $8.1B; 90%+ NA sales |
| Input volatility | Margin pressure | Commodity exposure |
Preview the Actual Deliverable
Campbell Soup SWOT Analysis
This is the actual SWOT analysis document you’ll receive upon purchase—no surprises, just professional quality. It summarizes Campbell Soup's strengths, weaknesses, opportunities, and threats with actionable insights for investors and managers. The preview below is taken directly from the full report you'll get.

Make Insightful Decisions Backed by Expert Research
Campbell Soup’s recognizable brands and scale mask supply-chain pressures and shifting consumer tastes; our SWOT distills what matters for investors and strategists. Want the full picture—actionable strengths, risks, and growth levers? Purchase the complete SWOT for a professionally formatted, editable report and Excel matrix to plan and pitch with confidence.
Strengths
Iconic brands with high household penetration
Campbell’s portfolio—Campbell’s, Pepperidge Farm (Goldfish), Prego, Pace, V8, Snyder’s, Kettle Brand and Rao’s—delivers strong recognition and repeat, with portfolio reach in over 90% of US households and FY2024 net sales of $8.6 billion. Broad shelf presence supports velocity and resilient baseline demand. High brand equity provides pricing power and profitable line extensions, while loyalty buffers category cyclicality.
Diversified Meals & Beverages and Snacks portfolio
Campbell’s balanced portfolio across soups, sauces, broths, snacks and beverages mitigates single-category risk, supporting resilience as fiscal 2024 net sales were about $7.2 billion. Snacks drive higher-growth share and mix benefits while core meals supply scale and steady cash flow. Cross-category merchandising enhances retailer partnerships and the breadth of SKUs enables dynamic revenue-management levers.
Scale distribution and retail relationships
Campbell leverages deep ties with major grocers and mass, club, and dollar channels to secure shelf placement and broad promotional reach, ensuring national visibility for core brands. Its national DSD and warehouse network supports snack freshness and reliable service levels, enabling fast replenishment. Scale delivers preferential slotting, end-cap access, and stronger trade terms, while consistent execution sustains market share.
Operational efficiencies and cash generation
Campbell Soup (CPB) leverages an established manufacturing footprint and centralized procurement to sustain margins, while ongoing productivity programs help offset input inflation and improve cost-to-serve. Strong free cash flow in FY2024 funded dividends, debt reduction, and targeted M&A, and network optimization raised fill rates and lowered logistics costs.
- Established footprint supports margins
- FY2024 FCF funded dividends/debt/M&A
- Productivity offsets input inflation
- Network optimization improves fill rates
Premiumization via Rao’s and better-for-you offerings
Rao’s expands Campbell’s presence in premium Italian sauces and ready meals, while Pacific Foods and other clean-label lines meet growing consumer demand for simple-ingredient, better-for-you options; this premium mix supports higher price realization and improved margins and enables brand stretch into adjacent meal occasions.
- Rao’s: premium Italian sauces/meals
- Pacific Foods: clean-label, wellness
- Premium mix: better price realization
- Brand stretch: adjacent meal innovation
National brands reach >90% of US homes; FY24 sales $8.6B
Strong national brands reach >90% of US households; FY2024 net sales $8.6B. Diversified portfolio across soups, snacks, sauces and beverages supports steady cash flow and higher-growth snack mix. Scale in retail and supply chain drives trade terms and fill rates; productivity programs and network optimization sustain margins and funded dividends, debt reduction and targeted M&A.
| Metric | Value | Note |
|---|---|---|
| Household Reach | >90% | National brands |
| FY2024 Net Sales | $8.6B | Company reported |
| Portfolio Mix | Soups, Snacks, Sauces, Beverages | Diversified revenue |
What is included in the product
Detailed Word Document
Provides a concise SWOT analysis of Campbell Soup, outlining internal strengths and weaknesses and external opportunities and threats. Evaluates competitive position, growth drivers, operational gaps, and market risks shaping the company’s strategic outlook.
Customizable Excel Spreadsheet
Provides a concise Campbell Soup SWOT matrix for fast strategic alignment and stakeholder-ready summaries, easing decision-making across product lines and market initiatives.
Weaknesses
Category concentration in center-store soups
Heavy exposure to legacy canned center-store soups ties Campbell’s results to a mature, often low- to single-digit declining segment; industry data show refrigerated and fresh formats growing faster year-over-year. Shifts toward fresh/refrigerated offerings have damped center-store growth and force constant SKU renovation and marketing investment to sustain relevance. This dependence constrains margin and channel expansion into faster-growing fresh and refrigerated categories.
Heavy North America revenue reliance
Heavy reliance on North America—Campbell generated roughly 90%+ of net sales from the U.S. and Canada in FY2024—limits diversification versus global peers and concentrates country risk. FX upside is limited and regional downturns bite harder, as international exposure remains small. Growth optionality outside the U.S./Canada is underdeveloped and significant global white spaces remain untapped.
Exposure to commodity and packaging volatility
Exposure to steel, tomatoes, wheat, oils and logistics drives volatile COGS and pressures gross margin as retail price adjustments lag raw‑material spikes. Short‑term profitability is compressed when cost inflation outpaces shelf price pass‑through. Financial hedges and index contracts only partially mitigate input variability. Concentrated supplier bases and single‑region sourcing can amplify supply shocks and cost swings.
Complex integration and SKU rationalization
Multiple acquisitions (eg, Snyder's‑Lance acquisition for $4.87B in 2018) require sustained synergy capture and complex systems harmonization; SKU rationalization risks temporary shelf losses and assortment gaps, while integration can divert R&D and marketing resources and execution missteps may erode retailer confidence.
- Synergy capture: long tail post‑2018
- SKU cuts: short‑term shelf risk
- Resource drag: less innovation
- Retailer trust: fragile after missteps
Perception challenges on sodium and processed foods
Health-conscious consumers scrutinize Campbell soups and snacks for sodium, sugar and additives, pressuring reformulation that must preserve taste while meeting nutrition targets; Campbell reported roughly $8.1 billion in net sales in FY2024, exposing revenue risk if reformulation slows velocity in retail or foodservice. Labeling shifts and voluntary sodium reduction guidance raise R&D and compliance costs.
- Perception risk: sodium/additives
- Reformulation vs taste trade-off
- Channel velocity capped by negative sentiment
- R&D/compliance burden from labeling shifts
Center-store decline and input volatility squeeze margins, fresh up ~5%
Legacy canned center‑store dependence ties results to a low‑single‑digit declining segment while refrigerated/fresh channels grew ~5% YoY; margins and SKU churn suffer. FY2024 net sales $8.1B with 90%+ U.S./Canada exposure concentrates country risk. Input volatility (steel, tomatoes, oils) and post‑2018 Snyder's‑Lance $4.87B integration pressure margins and execution.
| Weakness | Impact | FY2024 metric |
|---|---|---|
| Center‑store reliance | Declining volume | ~5% refrigerated growth |
| Regional concentration | Country risk | $8.1B; 90%+ NA sales |
| Input volatility | Margin pressure | Commodity exposure |
Preview the Actual Deliverable
Campbell Soup SWOT Analysis
This is the actual SWOT analysis document you’ll receive upon purchase—no surprises, just professional quality. It summarizes Campbell Soup's strengths, weaknesses, opportunities, and threats with actionable insights for investors and managers. The preview below is taken directly from the full report you'll get.
Original: $10.00
-65%$10.00
$3.50Description
Make Insightful Decisions Backed by Expert Research
Campbell Soup’s recognizable brands and scale mask supply-chain pressures and shifting consumer tastes; our SWOT distills what matters for investors and strategists. Want the full picture—actionable strengths, risks, and growth levers? Purchase the complete SWOT for a professionally formatted, editable report and Excel matrix to plan and pitch with confidence.
Strengths
Iconic brands with high household penetration
Campbell’s portfolio—Campbell’s, Pepperidge Farm (Goldfish), Prego, Pace, V8, Snyder’s, Kettle Brand and Rao’s—delivers strong recognition and repeat, with portfolio reach in over 90% of US households and FY2024 net sales of $8.6 billion. Broad shelf presence supports velocity and resilient baseline demand. High brand equity provides pricing power and profitable line extensions, while loyalty buffers category cyclicality.
Diversified Meals & Beverages and Snacks portfolio
Campbell’s balanced portfolio across soups, sauces, broths, snacks and beverages mitigates single-category risk, supporting resilience as fiscal 2024 net sales were about $7.2 billion. Snacks drive higher-growth share and mix benefits while core meals supply scale and steady cash flow. Cross-category merchandising enhances retailer partnerships and the breadth of SKUs enables dynamic revenue-management levers.
Scale distribution and retail relationships
Campbell leverages deep ties with major grocers and mass, club, and dollar channels to secure shelf placement and broad promotional reach, ensuring national visibility for core brands. Its national DSD and warehouse network supports snack freshness and reliable service levels, enabling fast replenishment. Scale delivers preferential slotting, end-cap access, and stronger trade terms, while consistent execution sustains market share.
Operational efficiencies and cash generation
Campbell Soup (CPB) leverages an established manufacturing footprint and centralized procurement to sustain margins, while ongoing productivity programs help offset input inflation and improve cost-to-serve. Strong free cash flow in FY2024 funded dividends, debt reduction, and targeted M&A, and network optimization raised fill rates and lowered logistics costs.
- Established footprint supports margins
- FY2024 FCF funded dividends/debt/M&A
- Productivity offsets input inflation
- Network optimization improves fill rates
Premiumization via Rao’s and better-for-you offerings
Rao’s expands Campbell’s presence in premium Italian sauces and ready meals, while Pacific Foods and other clean-label lines meet growing consumer demand for simple-ingredient, better-for-you options; this premium mix supports higher price realization and improved margins and enables brand stretch into adjacent meal occasions.
- Rao’s: premium Italian sauces/meals
- Pacific Foods: clean-label, wellness
- Premium mix: better price realization
- Brand stretch: adjacent meal innovation
National brands reach >90% of US homes; FY24 sales $8.6B
Strong national brands reach >90% of US households; FY2024 net sales $8.6B. Diversified portfolio across soups, snacks, sauces and beverages supports steady cash flow and higher-growth snack mix. Scale in retail and supply chain drives trade terms and fill rates; productivity programs and network optimization sustain margins and funded dividends, debt reduction and targeted M&A.
| Metric | Value | Note |
|---|---|---|
| Household Reach | >90% | National brands |
| FY2024 Net Sales | $8.6B | Company reported |
| Portfolio Mix | Soups, Snacks, Sauces, Beverages | Diversified revenue |
What is included in the product
Detailed Word Document
Provides a concise SWOT analysis of Campbell Soup, outlining internal strengths and weaknesses and external opportunities and threats. Evaluates competitive position, growth drivers, operational gaps, and market risks shaping the company’s strategic outlook.
Customizable Excel Spreadsheet
Provides a concise Campbell Soup SWOT matrix for fast strategic alignment and stakeholder-ready summaries, easing decision-making across product lines and market initiatives.
Weaknesses
Category concentration in center-store soups
Heavy exposure to legacy canned center-store soups ties Campbell’s results to a mature, often low- to single-digit declining segment; industry data show refrigerated and fresh formats growing faster year-over-year. Shifts toward fresh/refrigerated offerings have damped center-store growth and force constant SKU renovation and marketing investment to sustain relevance. This dependence constrains margin and channel expansion into faster-growing fresh and refrigerated categories.
Heavy North America revenue reliance
Heavy reliance on North America—Campbell generated roughly 90%+ of net sales from the U.S. and Canada in FY2024—limits diversification versus global peers and concentrates country risk. FX upside is limited and regional downturns bite harder, as international exposure remains small. Growth optionality outside the U.S./Canada is underdeveloped and significant global white spaces remain untapped.
Exposure to commodity and packaging volatility
Exposure to steel, tomatoes, wheat, oils and logistics drives volatile COGS and pressures gross margin as retail price adjustments lag raw‑material spikes. Short‑term profitability is compressed when cost inflation outpaces shelf price pass‑through. Financial hedges and index contracts only partially mitigate input variability. Concentrated supplier bases and single‑region sourcing can amplify supply shocks and cost swings.
Complex integration and SKU rationalization
Multiple acquisitions (eg, Snyder's‑Lance acquisition for $4.87B in 2018) require sustained synergy capture and complex systems harmonization; SKU rationalization risks temporary shelf losses and assortment gaps, while integration can divert R&D and marketing resources and execution missteps may erode retailer confidence.
- Synergy capture: long tail post‑2018
- SKU cuts: short‑term shelf risk
- Resource drag: less innovation
- Retailer trust: fragile after missteps
Perception challenges on sodium and processed foods
Health-conscious consumers scrutinize Campbell soups and snacks for sodium, sugar and additives, pressuring reformulation that must preserve taste while meeting nutrition targets; Campbell reported roughly $8.1 billion in net sales in FY2024, exposing revenue risk if reformulation slows velocity in retail or foodservice. Labeling shifts and voluntary sodium reduction guidance raise R&D and compliance costs.
- Perception risk: sodium/additives
- Reformulation vs taste trade-off
- Channel velocity capped by negative sentiment
- R&D/compliance burden from labeling shifts
Center-store decline and input volatility squeeze margins, fresh up ~5%
Legacy canned center‑store dependence ties results to a low‑single‑digit declining segment while refrigerated/fresh channels grew ~5% YoY; margins and SKU churn suffer. FY2024 net sales $8.1B with 90%+ U.S./Canada exposure concentrates country risk. Input volatility (steel, tomatoes, oils) and post‑2018 Snyder's‑Lance $4.87B integration pressure margins and execution.
| Weakness | Impact | FY2024 metric |
|---|---|---|
| Center‑store reliance | Declining volume | ~5% refrigerated growth |
| Regional concentration | Country risk | $8.1B; 90%+ NA sales |
| Input volatility | Margin pressure | Commodity exposure |
Preview the Actual Deliverable
Campbell Soup SWOT Analysis
This is the actual SWOT analysis document you’ll receive upon purchase—no surprises, just professional quality. It summarizes Campbell Soup's strengths, weaknesses, opportunities, and threats with actionable insights for investors and managers. The preview below is taken directly from the full report you'll get.











