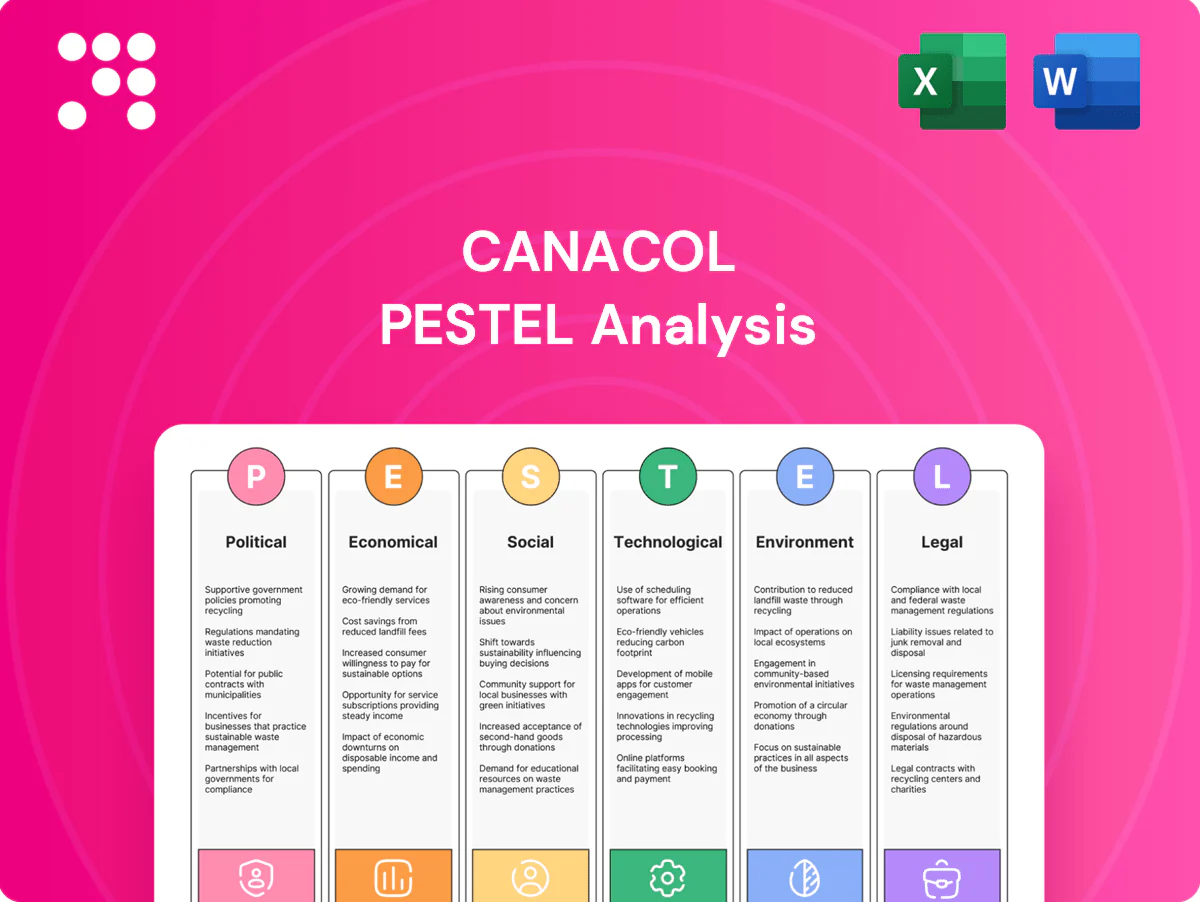
Canacol PESTLE Analysis

Skip the Research. Get the Strategy.
Gain strategic advantage with our PESTLE Analysis of Canacol. We map political, economic, social, technological, legal and environmental forces shaping its future. Perfect for investors and strategists—buy the full, editable report now for actionable insights.
Political factors

Regulatory stability in Colombia
Colombia’s hydrocarbon policy remains formally pro-development since the ANH was created in 2003, but policy direction can change with administrations, notably after the 2022–2024 reform debates that impacted fiscal terms.
Stability in ANH licensing and gas market rules drives investment timing because exploration-to-production timelines typically span 3–7 years, affecting capital allocation for multi-year projects.
Monitoring national policy continuity and regional/municipal politics is essential, as local permits and community agreements frequently alter project schedules and operating costs.
Election cycles and policy shifts
National and local elections can change fiscal terms, environmental priorities and state energy investment—Colombia's 2022 president Gustavo Petro won 50.44% in the runoff and his administration announced a moratorium on new oil and gas exploration, raising environmental scrutiny. A tilt toward energy transition may favor gas over oil but tighten approvals and affect contract renewals. Scenario planning around electoral outcomes is essential for Canacol.

Security and social governance in producing areas
Operational continuity in the Lower Magdalena Basin hinges on security, community relations and public order, with 2024 field access repeatedly tied to local protest dynamics. Government capacity to manage protests and blockades determines timing of drilling campaigns and truck movements. Close partnerships with municipal authorities and community leaders reduce disruption risk. Security budgets and contingency planning materially affect project economics in 2024.

State influence and midstream policy
State rules on pipeline access, tariffs and expansion shape Canacol’s market reach and pricing power; regulated third-party access dictates offtake terms and netbacks. Coordination with state-linked entities and regulators can accelerate or delay takeaway capacity projects, affecting timing of cash flows. Policy support for gas-fired power and industrial demand underpins offtake stability while midstream regulatory shifts affect margins.
- pipeline access: affects pricing
- tariffs: direct margin impact
- regulator coordination: caps project timing risk
- policy on gas demand: stabilizes volumes
Regional energy integration
Regional energy integration shapes Canacol’s export optionality: Colombia produced about 1.2 Bcf/d of gas in 2024 while Canacol’s marketed volumes were roughly 300 MMcf/d, making cross-border trade to Caribbean and Andean markets commercially attractive but dependent on diplomatic ties and interconnection policy. Export permits, quotas and pricing rules set by host and buyer states directly affect sales timing and margins, and regional reliability initiatives could lift Colombian gas demand. Geopolitical tensions or permit delays can constrain pipeline routes and LNG approvals, limiting upside.
- Cross-border dependence: diplomatic ties & interconnection policy
- Volumes: Colombia ~1.2 Bcf/d (2024); Canacol ~300 MMcf/d
- Regulation: permits, quotas, pricing rules affect optionality
- Risk: geopolitical tensions can block routes/approvals
Volatility raises approval risk; pipelines (1.2 Bcf/d) and 300 MMcf/d market shape 3–7 years
Colombian policy is pro-hydrocarbon but politically volatile after 2022–24 fiscal debates and Petro-era moratorium signals, raising approval and contract risk.
ANH licensing stability, local permits and protest-driven field access materially affect 3–7 year project timing and security/contingency costs.
Pipeline access, tariffs and export permits (Colombia ~1.2 Bcf/d; Canacol ~300 MMcf/d in 2024) determine netbacks and regional optionality.
| Metric | 2024 Value |
|---|---|
| Colombia gas prod | ~1.2 Bcf/d |
| Canacol marketed | ~300 MMcf/d |
| Typical E&P timeline | 3–7 years |
What is included in the product
 Detailed Word Document
Explores how macro-environmental forces uniquely affect Canacol across Political, Economic, Social, Technological, Environmental, and Legal dimensions, with data-driven trends, region-specific examples, forward-looking scenarios, and actionable insights to inform strategy, risk management, and investor-facing materials.

 Customizable Excel Spreadsheet
Clean, summarized Canacol PESTLE that’s visually segmented by category for quick interpretation and easily dropped into presentations or shared across teams to streamline risk discussions and planning.
Economic factors

Domestic gas demand dynamics
Industrial, residential and power sectors are the main drivers of Colombian gas demand, with 2024 seeing higher thermal offtake as El Niño reduced hydro output. El Niño episodes historically cause sharp spikes in power-sector gas consumption, supporting short-term price strength. Canacol's contract mix of firm and spot sales cushions cash flow volatility, while steady demand growth underpins long-term field development.
Commodity prices and indexation
Local gas contracts often reference inflation or energy indices, so realized pricing for Canacol moves with those clauses; diversified indexation across CPI and energy indices helps cushion volatility. Brent averaged about 86 USD/bbl in 2024 and traded near 80 USD/bbl in H1 2025, shaping investor appetite and service costs. Price ceilings or regulated tariffs in certain Colombian segments can cap upside despite commodity rallies.

COP FX volatility and inflation
COP volatility — USD/COP averaged about 4,000 in H1 2025, after notable swings in 2023–24 — creates currency risk because Canacol’s revenue is largely peso-linked while many costs and debt are USD-exposed, compressing margins. Colombia annual CPI ran near 9% in 2024, raising OPEX and capex and increasing unit costs. Active FX hedging and greater local sourcing have reduced net exposure. Monetary policy tightening lifted local financing costs, raising interest expense.

Capital access and cost of funds
Canacol’s E&P programs depend on stable access to equity, bank debt and bond markets; sovereign risk and sector sentiment directly influence borrowing spreads and lender willingness. Strong proven reserves and long-term gas sales agreements enhance collateral and secure better funding terms, while delays in receivables or regulatory approvals can rapidly strain short-term liquidity and elevate rollover risk.
- Dependence: equity, bank debt, bonds
- Drivers: sovereign risk & sector sentiment
- Mitigants: proven reserves + long-term contracts
- Risks: receivable/approval delays → liquidity stress
Infrastructure and logistics costs
Canacol’s delivered gas cost is driven by pipeline capacity, compression and processing; 2024 production averaged ~420 MMcf/d and midstream constraints have periodically forced higher-cost trucking or virtual pipelines. Timely compression and pipeline build-outs have cut unit transport costs an estimated 10–15% and unlocked incremental volumes. Steel and services inflation — spiking ~25% in 2021–22 and moderating to ~+5% in 2024 — raises upfront build economics.
Volatility raises approval risk; pipelines (1.2 Bcf/d) and 300 MMcf/d market shape 3–7 years
Colombian gas demand rose in 2024 with El Niño-driven power demand; Canacol produced ~420 MMcf/d in 2024 supporting cash flows. Brent ~80 USD/bbl (H1 2025); COP ~4,000/USD (H1 2025) and 2024 CPI ~9% squeeze margins. Pipeline constraints raise delivered costs; compression cut transport ~10–15%, while financing access depends on reserves and long-term contracts.
| Metric | Value |
|---|---|
| Production 2024 | ~420 MMcf/d |
| Brent (H1 2025) | ~80 USD/bbl |
| USD/COP (H1 2025) | ~4,000 |
| CPI 2024 | ~9% |
Full Version Awaits
Canacol PESTLE Analysis
This Canacol PESTLE Analysis provides a concise, actionable review of political, economic, social, technological, legal and environmental factors affecting Canacol Energy, with implications for strategy and risk. The preview shown here is the exact document you’ll receive after purchase—fully formatted and ready to use. No placeholders or surprises: what you see is the final file available for immediate download.

Skip the Research. Get the Strategy.
Gain strategic advantage with our PESTLE Analysis of Canacol. We map political, economic, social, technological, legal and environmental forces shaping its future. Perfect for investors and strategists—buy the full, editable report now for actionable insights.
Political factors
Regulatory stability in Colombia
Colombia’s hydrocarbon policy remains formally pro-development since the ANH was created in 2003, but policy direction can change with administrations, notably after the 2022–2024 reform debates that impacted fiscal terms.
Stability in ANH licensing and gas market rules drives investment timing because exploration-to-production timelines typically span 3–7 years, affecting capital allocation for multi-year projects.
Monitoring national policy continuity and regional/municipal politics is essential, as local permits and community agreements frequently alter project schedules and operating costs.
Election cycles and policy shifts
National and local elections can change fiscal terms, environmental priorities and state energy investment—Colombia's 2022 president Gustavo Petro won 50.44% in the runoff and his administration announced a moratorium on new oil and gas exploration, raising environmental scrutiny. A tilt toward energy transition may favor gas over oil but tighten approvals and affect contract renewals. Scenario planning around electoral outcomes is essential for Canacol.
Security and social governance in producing areas
Operational continuity in the Lower Magdalena Basin hinges on security, community relations and public order, with 2024 field access repeatedly tied to local protest dynamics. Government capacity to manage protests and blockades determines timing of drilling campaigns and truck movements. Close partnerships with municipal authorities and community leaders reduce disruption risk. Security budgets and contingency planning materially affect project economics in 2024.
State influence and midstream policy
State rules on pipeline access, tariffs and expansion shape Canacol’s market reach and pricing power; regulated third-party access dictates offtake terms and netbacks. Coordination with state-linked entities and regulators can accelerate or delay takeaway capacity projects, affecting timing of cash flows. Policy support for gas-fired power and industrial demand underpins offtake stability while midstream regulatory shifts affect margins.
- pipeline access: affects pricing
- tariffs: direct margin impact
- regulator coordination: caps project timing risk
- policy on gas demand: stabilizes volumes
Regional energy integration
Regional energy integration shapes Canacol’s export optionality: Colombia produced about 1.2 Bcf/d of gas in 2024 while Canacol’s marketed volumes were roughly 300 MMcf/d, making cross-border trade to Caribbean and Andean markets commercially attractive but dependent on diplomatic ties and interconnection policy. Export permits, quotas and pricing rules set by host and buyer states directly affect sales timing and margins, and regional reliability initiatives could lift Colombian gas demand. Geopolitical tensions or permit delays can constrain pipeline routes and LNG approvals, limiting upside.
- Cross-border dependence: diplomatic ties & interconnection policy
- Volumes: Colombia ~1.2 Bcf/d (2024); Canacol ~300 MMcf/d
- Regulation: permits, quotas, pricing rules affect optionality
- Risk: geopolitical tensions can block routes/approvals
Volatility raises approval risk; pipelines (1.2 Bcf/d) and 300 MMcf/d market shape 3–7 years
Colombian policy is pro-hydrocarbon but politically volatile after 2022–24 fiscal debates and Petro-era moratorium signals, raising approval and contract risk.
ANH licensing stability, local permits and protest-driven field access materially affect 3–7 year project timing and security/contingency costs.
Pipeline access, tariffs and export permits (Colombia ~1.2 Bcf/d; Canacol ~300 MMcf/d in 2024) determine netbacks and regional optionality.
| Metric | 2024 Value |
|---|---|
| Colombia gas prod | ~1.2 Bcf/d |
| Canacol marketed | ~300 MMcf/d |
| Typical E&P timeline | 3–7 years |
What is included in the product
Detailed Word Document
Explores how macro-environmental forces uniquely affect Canacol across Political, Economic, Social, Technological, Environmental, and Legal dimensions, with data-driven trends, region-specific examples, forward-looking scenarios, and actionable insights to inform strategy, risk management, and investor-facing materials.
Customizable Excel Spreadsheet
Clean, summarized Canacol PESTLE that’s visually segmented by category for quick interpretation and easily dropped into presentations or shared across teams to streamline risk discussions and planning.
Economic factors
Domestic gas demand dynamics
Industrial, residential and power sectors are the main drivers of Colombian gas demand, with 2024 seeing higher thermal offtake as El Niño reduced hydro output. El Niño episodes historically cause sharp spikes in power-sector gas consumption, supporting short-term price strength. Canacol's contract mix of firm and spot sales cushions cash flow volatility, while steady demand growth underpins long-term field development.
Commodity prices and indexation
Local gas contracts often reference inflation or energy indices, so realized pricing for Canacol moves with those clauses; diversified indexation across CPI and energy indices helps cushion volatility. Brent averaged about 86 USD/bbl in 2024 and traded near 80 USD/bbl in H1 2025, shaping investor appetite and service costs. Price ceilings or regulated tariffs in certain Colombian segments can cap upside despite commodity rallies.
COP FX volatility and inflation
COP volatility — USD/COP averaged about 4,000 in H1 2025, after notable swings in 2023–24 — creates currency risk because Canacol’s revenue is largely peso-linked while many costs and debt are USD-exposed, compressing margins. Colombia annual CPI ran near 9% in 2024, raising OPEX and capex and increasing unit costs. Active FX hedging and greater local sourcing have reduced net exposure. Monetary policy tightening lifted local financing costs, raising interest expense.
Capital access and cost of funds
Canacol’s E&P programs depend on stable access to equity, bank debt and bond markets; sovereign risk and sector sentiment directly influence borrowing spreads and lender willingness. Strong proven reserves and long-term gas sales agreements enhance collateral and secure better funding terms, while delays in receivables or regulatory approvals can rapidly strain short-term liquidity and elevate rollover risk.
- Dependence: equity, bank debt, bonds
- Drivers: sovereign risk & sector sentiment
- Mitigants: proven reserves + long-term contracts
- Risks: receivable/approval delays → liquidity stress
Infrastructure and logistics costs
Canacol’s delivered gas cost is driven by pipeline capacity, compression and processing; 2024 production averaged ~420 MMcf/d and midstream constraints have periodically forced higher-cost trucking or virtual pipelines. Timely compression and pipeline build-outs have cut unit transport costs an estimated 10–15% and unlocked incremental volumes. Steel and services inflation — spiking ~25% in 2021–22 and moderating to ~+5% in 2024 — raises upfront build economics.
Volatility raises approval risk; pipelines (1.2 Bcf/d) and 300 MMcf/d market shape 3–7 years
Colombian gas demand rose in 2024 with El Niño-driven power demand; Canacol produced ~420 MMcf/d in 2024 supporting cash flows. Brent ~80 USD/bbl (H1 2025); COP ~4,000/USD (H1 2025) and 2024 CPI ~9% squeeze margins. Pipeline constraints raise delivered costs; compression cut transport ~10–15%, while financing access depends on reserves and long-term contracts.
| Metric | Value |
|---|---|
| Production 2024 | ~420 MMcf/d |
| Brent (H1 2025) | ~80 USD/bbl |
| USD/COP (H1 2025) | ~4,000 |
| CPI 2024 | ~9% |
Full Version Awaits
Canacol PESTLE Analysis
This Canacol PESTLE Analysis provides a concise, actionable review of political, economic, social, technological, legal and environmental factors affecting Canacol Energy, with implications for strategy and risk. The preview shown here is the exact document you’ll receive after purchase—fully formatted and ready to use. No placeholders or surprises: what you see is the final file available for immediate download.
Original: $10.00
-65%$10.00
$3.50Description
Skip the Research. Get the Strategy.
Gain strategic advantage with our PESTLE Analysis of Canacol. We map political, economic, social, technological, legal and environmental forces shaping its future. Perfect for investors and strategists—buy the full, editable report now for actionable insights.
Political factors
Regulatory stability in Colombia
Colombia’s hydrocarbon policy remains formally pro-development since the ANH was created in 2003, but policy direction can change with administrations, notably after the 2022–2024 reform debates that impacted fiscal terms.
Stability in ANH licensing and gas market rules drives investment timing because exploration-to-production timelines typically span 3–7 years, affecting capital allocation for multi-year projects.
Monitoring national policy continuity and regional/municipal politics is essential, as local permits and community agreements frequently alter project schedules and operating costs.
Election cycles and policy shifts
National and local elections can change fiscal terms, environmental priorities and state energy investment—Colombia's 2022 president Gustavo Petro won 50.44% in the runoff and his administration announced a moratorium on new oil and gas exploration, raising environmental scrutiny. A tilt toward energy transition may favor gas over oil but tighten approvals and affect contract renewals. Scenario planning around electoral outcomes is essential for Canacol.
Security and social governance in producing areas
Operational continuity in the Lower Magdalena Basin hinges on security, community relations and public order, with 2024 field access repeatedly tied to local protest dynamics. Government capacity to manage protests and blockades determines timing of drilling campaigns and truck movements. Close partnerships with municipal authorities and community leaders reduce disruption risk. Security budgets and contingency planning materially affect project economics in 2024.
State influence and midstream policy
State rules on pipeline access, tariffs and expansion shape Canacol’s market reach and pricing power; regulated third-party access dictates offtake terms and netbacks. Coordination with state-linked entities and regulators can accelerate or delay takeaway capacity projects, affecting timing of cash flows. Policy support for gas-fired power and industrial demand underpins offtake stability while midstream regulatory shifts affect margins.
- pipeline access: affects pricing
- tariffs: direct margin impact
- regulator coordination: caps project timing risk
- policy on gas demand: stabilizes volumes
Regional energy integration
Regional energy integration shapes Canacol’s export optionality: Colombia produced about 1.2 Bcf/d of gas in 2024 while Canacol’s marketed volumes were roughly 300 MMcf/d, making cross-border trade to Caribbean and Andean markets commercially attractive but dependent on diplomatic ties and interconnection policy. Export permits, quotas and pricing rules set by host and buyer states directly affect sales timing and margins, and regional reliability initiatives could lift Colombian gas demand. Geopolitical tensions or permit delays can constrain pipeline routes and LNG approvals, limiting upside.
- Cross-border dependence: diplomatic ties & interconnection policy
- Volumes: Colombia ~1.2 Bcf/d (2024); Canacol ~300 MMcf/d
- Regulation: permits, quotas, pricing rules affect optionality
- Risk: geopolitical tensions can block routes/approvals
Volatility raises approval risk; pipelines (1.2 Bcf/d) and 300 MMcf/d market shape 3–7 years
Colombian policy is pro-hydrocarbon but politically volatile after 2022–24 fiscal debates and Petro-era moratorium signals, raising approval and contract risk.
ANH licensing stability, local permits and protest-driven field access materially affect 3–7 year project timing and security/contingency costs.
Pipeline access, tariffs and export permits (Colombia ~1.2 Bcf/d; Canacol ~300 MMcf/d in 2024) determine netbacks and regional optionality.
| Metric | 2024 Value |
|---|---|
| Colombia gas prod | ~1.2 Bcf/d |
| Canacol marketed | ~300 MMcf/d |
| Typical E&P timeline | 3–7 years |
What is included in the product
Detailed Word Document
Explores how macro-environmental forces uniquely affect Canacol across Political, Economic, Social, Technological, Environmental, and Legal dimensions, with data-driven trends, region-specific examples, forward-looking scenarios, and actionable insights to inform strategy, risk management, and investor-facing materials.
Customizable Excel Spreadsheet
Clean, summarized Canacol PESTLE that’s visually segmented by category for quick interpretation and easily dropped into presentations or shared across teams to streamline risk discussions and planning.
Economic factors
Domestic gas demand dynamics
Industrial, residential and power sectors are the main drivers of Colombian gas demand, with 2024 seeing higher thermal offtake as El Niño reduced hydro output. El Niño episodes historically cause sharp spikes in power-sector gas consumption, supporting short-term price strength. Canacol's contract mix of firm and spot sales cushions cash flow volatility, while steady demand growth underpins long-term field development.
Commodity prices and indexation
Local gas contracts often reference inflation or energy indices, so realized pricing for Canacol moves with those clauses; diversified indexation across CPI and energy indices helps cushion volatility. Brent averaged about 86 USD/bbl in 2024 and traded near 80 USD/bbl in H1 2025, shaping investor appetite and service costs. Price ceilings or regulated tariffs in certain Colombian segments can cap upside despite commodity rallies.
COP FX volatility and inflation
COP volatility — USD/COP averaged about 4,000 in H1 2025, after notable swings in 2023–24 — creates currency risk because Canacol’s revenue is largely peso-linked while many costs and debt are USD-exposed, compressing margins. Colombia annual CPI ran near 9% in 2024, raising OPEX and capex and increasing unit costs. Active FX hedging and greater local sourcing have reduced net exposure. Monetary policy tightening lifted local financing costs, raising interest expense.
Capital access and cost of funds
Canacol’s E&P programs depend on stable access to equity, bank debt and bond markets; sovereign risk and sector sentiment directly influence borrowing spreads and lender willingness. Strong proven reserves and long-term gas sales agreements enhance collateral and secure better funding terms, while delays in receivables or regulatory approvals can rapidly strain short-term liquidity and elevate rollover risk.
- Dependence: equity, bank debt, bonds
- Drivers: sovereign risk & sector sentiment
- Mitigants: proven reserves + long-term contracts
- Risks: receivable/approval delays → liquidity stress
Infrastructure and logistics costs
Canacol’s delivered gas cost is driven by pipeline capacity, compression and processing; 2024 production averaged ~420 MMcf/d and midstream constraints have periodically forced higher-cost trucking or virtual pipelines. Timely compression and pipeline build-outs have cut unit transport costs an estimated 10–15% and unlocked incremental volumes. Steel and services inflation — spiking ~25% in 2021–22 and moderating to ~+5% in 2024 — raises upfront build economics.
Volatility raises approval risk; pipelines (1.2 Bcf/d) and 300 MMcf/d market shape 3–7 years
Colombian gas demand rose in 2024 with El Niño-driven power demand; Canacol produced ~420 MMcf/d in 2024 supporting cash flows. Brent ~80 USD/bbl (H1 2025); COP ~4,000/USD (H1 2025) and 2024 CPI ~9% squeeze margins. Pipeline constraints raise delivered costs; compression cut transport ~10–15%, while financing access depends on reserves and long-term contracts.
| Metric | Value |
|---|---|
| Production 2024 | ~420 MMcf/d |
| Brent (H1 2025) | ~80 USD/bbl |
| USD/COP (H1 2025) | ~4,000 |
| CPI 2024 | ~9% |
Full Version Awaits
Canacol PESTLE Analysis
This Canacol PESTLE Analysis provides a concise, actionable review of political, economic, social, technological, legal and environmental factors affecting Canacol Energy, with implications for strategy and risk. The preview shown here is the exact document you’ll receive after purchase—fully formatted and ready to use. No placeholders or surprises: what you see is the final file available for immediate download.











