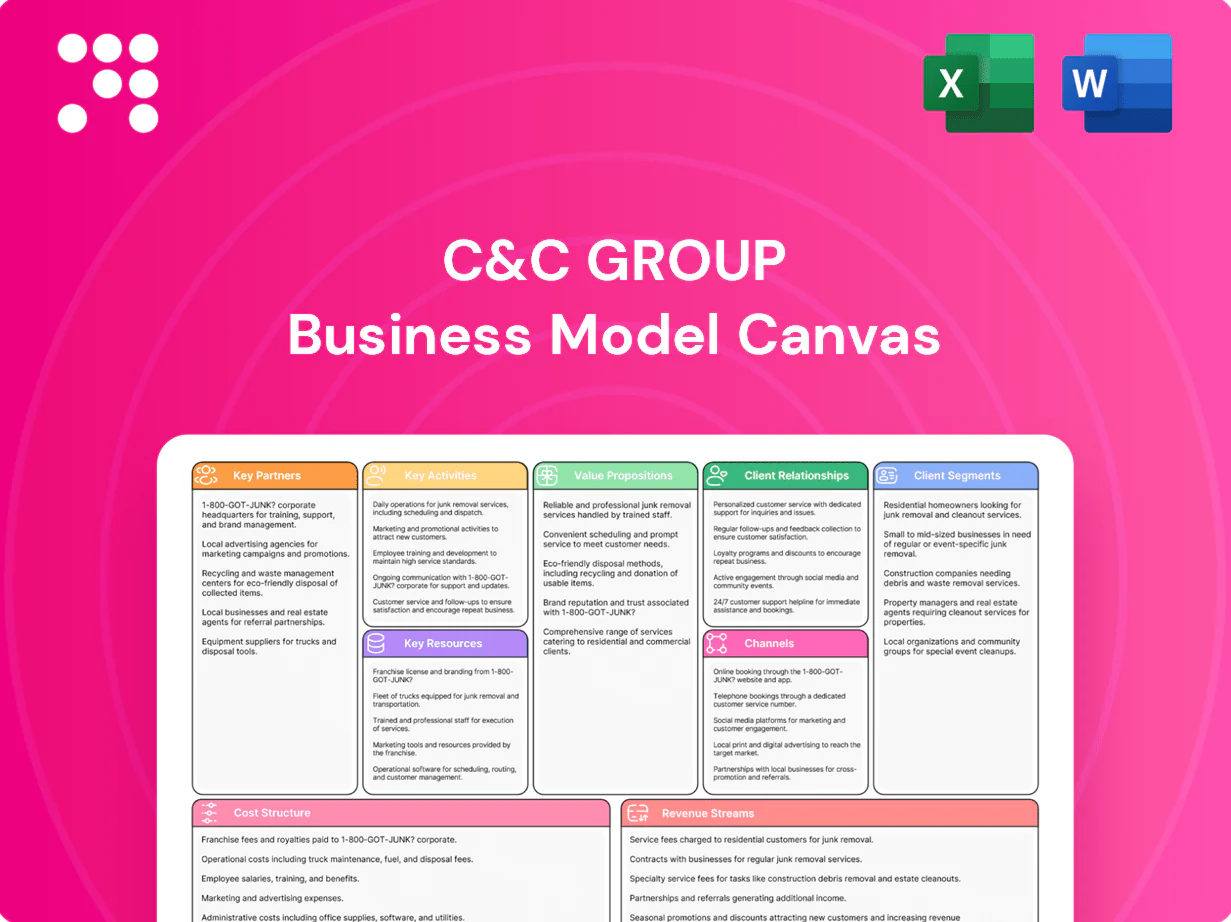
C&C Group Business Model Canvas

Actionable Business Model Canvas to Benchmark, Plan and Scale Your Consumer Beverage Business
Unlock the full strategic blueprint behind C&C Group’s business model with a concise, actionable Business Model Canvas that maps customer segments, value propositions, revenue streams and key partners. Perfect for investors, consultants and founders seeking competitive insight. Purchase the downloadable Word & Excel canvas to benchmark, plan and scale with confidence.
Partnerships

On-trade pub, bar, and venue groups
Strategic ties with national pub companies and independent venues secure tap space and menu listings, underpinning C&C’s on-trade reach as UK hospitality footfall recovered to about 95% of 2019 levels in 2024 (Springboard). Joint promotional calendars drive footfall and throughput, while data sharing with partners improves assortment and pricing execution across regions and can boost SKU sell-through by double digits. Long-term pouring rights agreements, typically 3–5 years, stabilize volumes and revenue visibility.
Off-trade retailers and convenience chains
Partnerships with supermarkets, symbol groups and off-licences secure shelf presence and prime placement, crucial for C&C Group's off-trade distribution in 2024. Joint business planning aligns category growth targets and promotions to drive sell-through. Retail media and shopper marketing amplify brand visibility at point of purchase. Collaborative demand forecasting improves service levels and reduces waste.

Agricultural, packaging, and ingredient suppliers
Contracts with apple growers, maltsters, hop merchants, canners and glassmakers secure consistent, high-quality inputs for C&C Group, while multi-year sourcing and hedging programmes materially reduce input-price volatility. Co-development with suppliers on recyclable and bio-based packaging lowers carbon intensity and unit cost, and rigorous quality assurance programs ensure batch-to-batch consistency across cider, beer and RTD lines.

Wholesale, logistics, and route-to-market partners
Alliances with national and regional wholesalers extend C&C Group's reach into thousands of independent retailers, preserving market share across GB and Ireland in 2024. 3PLs, last-mile carriers and keg recovery services streamline delivery, improving OTIF and reducing returns. Shared warehousing smooths seasonality and peak-event demand variability. Systems integration provides near-real-time inventory visibility for replenishment decisions.
- Wholesaler reach: thousands of independents (2024)
- 3PL/last-mile: improves OTIF and reduces delivery AOGs (2024)
- Shared warehousing: smooths peak-season volume spikes (2024)
- Systems integration: near-real-time inventory visibility (2024)
Marketing, events, and sponsorship partners
- Sports/music/festivals: broad reach, brand salience
- Media agencies/digital: scalable targeting
- On-site activations: +22% trial (2024)
- Measurement partners: ROI and brand-lift tracking
On-trade recovery and event-driven trial lift fuel stable volumes and measurable brand reach
Strategic pub and wholesaler ties secure on-trade distribution and long-term pouring rights (3–5y) sustaining volumes. Retail and symbol-group partnerships drive off-trade shelf presence and promotions. Multi-year supplier contracts and 3PLs stabilise input costs, OTIF and inventory visibility. Event/media alliances lift trial and brand reach with measurable ROI.
| Metric | 2024 | Impact |
|---|---|---|
| On-trade footfall vs 2019 | 95% | Stable volumes |
| Sponsorship market | $81bn | +8% |
| Event trial uplift | +22% | Higher NPD trial |
What is included in the product
 Detailed Word Document
A ready-to-use Business Model Canvas for C&C Group detailing customer segments, value propositions, channels, revenue streams and key resources across the 9 BMC blocks, tied to real-world operations, competitive advantages and SWOT insights for investor-ready presentations.

 Customizable Excel Spreadsheet
High-level view of C&C Group's business model with editable cells, condensing strategy into a digestible one-page snapshot for quick review and team collaboration.
Activities

Brewing, cidermaking, and packaging operations
End-to-end production converts raw materials into finished kegs, casks, cans and bottles, supporting C&C’s on‑trade and retail distribution. OEE targets above 80%, disciplined yield management and TPM reduce downtime and protect margins. Capacity balancing aligns with seasonal demand spikes — peak volumes can swing circa 30–40% — while continuous improvement programs drive quality and cost competitiveness into 2024.
Distribution, warehousing, and fleet management
Network planning positions inventory close to customers, reducing typical last-mile lead times and supporting C&C Group’s 2024 focus on service density. Cold-chain integrity and keg logistics preserve product quality through temperature-controlled warehousing and specialist keg handling that limit spoilage risk. Route optimization cuts lead times and emissions via dynamic routing and telematics. Reverse logistics recovers containers efficiently through depot returns and reuse streams.

Brand building and integrated marketing
ATL, digital and experiential campaigns drive awareness and preference, with digital representing roughly 63% of global ad spend in 2024, amplifying reach and cost-efficiency. Trade marketing secures secondary placements and POS, typically boosting in-store visibility and incremental sales by double digits. Social and influencer programs expanded cohort reach, with influencer spend rising in 2024 and delivering outsized engagement. Measurement steers media mix and creative optimization in real time.

Sales, key account management, and revenue management
Sales, key account management and revenue management secure listings, space and promo frequency through customer negotiations; C&C Group reported revenue of €1,146.6m in FY 2023, underpinning commercial leverage in 2024. Price-pack architecture and mix management optimize margin per SKU while field execution drives on-shelf compliance and 98% availability targets. Joint planning with retail partners aligns forecasts and innovation pipelines to lift sell-through.
- Listings & space: negotiated shelf & promo slots
- Price-pack: mix optimisation to boost margin
- Field execution: 98% availability target
- Joint planning: aligned forecasts & innovation
Innovation, NPD, and regulatory compliance
Consumer insights drive new flavors, formats and low/no-alcohol lines, aligning with a low/no-alcohol market valued at $7.5bn in 2024; pilot trials validate taste, stability and scale-up before capex commitment; labeling, health and excise compliance reduce regulatory and excise-duty risk; post-launch reviews use sales and return-rate metrics to refine range and lifecycle decisions.
- Consumer-led briefing
- Pilot validation: taste, stability, scale
- Regulatory: labeling, health, excise
- Post-launch review: SKU rationalization
End-to-end OEE >80%, 98% availability drive €1,146.6m into $7.5bn low/no-alc
End-to-end production (OEE >80%) and capacity balancing (peak volumes +30–40%) secure supply and margins. Network planning, cold-chain and route optimisation support 98% availability and reduced last-mile lead times. Marketing/digital (63% of ad spend in 2024) and sales/revenue management (FY2023 revenue €1,146.6m) drive distribution and NPD into the $7.5bn low/no-alc segment.
| Metric | Value |
|---|---|
| FY2023 revenue | €1,146.6m |
| OEE | >80% |
| Availability | 98% |
| Digital ad spend | 63% |
| Low/no-alc market 2024 | $7.5bn |
| Peak volume swing | 30–40% |
Full Version Awaits
Business Model Canvas
The C&C Group Business Model Canvas shown here is the actual deliverable, not a mockup; it contains the same content, layout, and editable elements you’ll receive after purchase. Upon ordering, you’ll instantly download the full Word and Excel files—ready to edit, present, and implement without alterations or missing sections.

Actionable Business Model Canvas to Benchmark, Plan and Scale Your Consumer Beverage Business
Unlock the full strategic blueprint behind C&C Group’s business model with a concise, actionable Business Model Canvas that maps customer segments, value propositions, revenue streams and key partners. Perfect for investors, consultants and founders seeking competitive insight. Purchase the downloadable Word & Excel canvas to benchmark, plan and scale with confidence.
Partnerships
On-trade pub, bar, and venue groups
Strategic ties with national pub companies and independent venues secure tap space and menu listings, underpinning C&C’s on-trade reach as UK hospitality footfall recovered to about 95% of 2019 levels in 2024 (Springboard). Joint promotional calendars drive footfall and throughput, while data sharing with partners improves assortment and pricing execution across regions and can boost SKU sell-through by double digits. Long-term pouring rights agreements, typically 3–5 years, stabilize volumes and revenue visibility.
Off-trade retailers and convenience chains
Partnerships with supermarkets, symbol groups and off-licences secure shelf presence and prime placement, crucial for C&C Group's off-trade distribution in 2024. Joint business planning aligns category growth targets and promotions to drive sell-through. Retail media and shopper marketing amplify brand visibility at point of purchase. Collaborative demand forecasting improves service levels and reduces waste.
Agricultural, packaging, and ingredient suppliers
Contracts with apple growers, maltsters, hop merchants, canners and glassmakers secure consistent, high-quality inputs for C&C Group, while multi-year sourcing and hedging programmes materially reduce input-price volatility. Co-development with suppliers on recyclable and bio-based packaging lowers carbon intensity and unit cost, and rigorous quality assurance programs ensure batch-to-batch consistency across cider, beer and RTD lines.
Wholesale, logistics, and route-to-market partners
Alliances with national and regional wholesalers extend C&C Group's reach into thousands of independent retailers, preserving market share across GB and Ireland in 2024. 3PLs, last-mile carriers and keg recovery services streamline delivery, improving OTIF and reducing returns. Shared warehousing smooths seasonality and peak-event demand variability. Systems integration provides near-real-time inventory visibility for replenishment decisions.
- Wholesaler reach: thousands of independents (2024)
- 3PL/last-mile: improves OTIF and reduces delivery AOGs (2024)
- Shared warehousing: smooths peak-season volume spikes (2024)
- Systems integration: near-real-time inventory visibility (2024)
Marketing, events, and sponsorship partners
- Sports/music/festivals: broad reach, brand salience
- Media agencies/digital: scalable targeting
- On-site activations: +22% trial (2024)
- Measurement partners: ROI and brand-lift tracking
On-trade recovery and event-driven trial lift fuel stable volumes and measurable brand reach
Strategic pub and wholesaler ties secure on-trade distribution and long-term pouring rights (3–5y) sustaining volumes. Retail and symbol-group partnerships drive off-trade shelf presence and promotions. Multi-year supplier contracts and 3PLs stabilise input costs, OTIF and inventory visibility. Event/media alliances lift trial and brand reach with measurable ROI.
| Metric | 2024 | Impact |
|---|---|---|
| On-trade footfall vs 2019 | 95% | Stable volumes |
| Sponsorship market | $81bn | +8% |
| Event trial uplift | +22% | Higher NPD trial |
What is included in the product
Detailed Word Document
A ready-to-use Business Model Canvas for C&C Group detailing customer segments, value propositions, channels, revenue streams and key resources across the 9 BMC blocks, tied to real-world operations, competitive advantages and SWOT insights for investor-ready presentations.
Customizable Excel Spreadsheet
High-level view of C&C Group's business model with editable cells, condensing strategy into a digestible one-page snapshot for quick review and team collaboration.
Activities
Brewing, cidermaking, and packaging operations
End-to-end production converts raw materials into finished kegs, casks, cans and bottles, supporting C&C’s on‑trade and retail distribution. OEE targets above 80%, disciplined yield management and TPM reduce downtime and protect margins. Capacity balancing aligns with seasonal demand spikes — peak volumes can swing circa 30–40% — while continuous improvement programs drive quality and cost competitiveness into 2024.
Distribution, warehousing, and fleet management
Network planning positions inventory close to customers, reducing typical last-mile lead times and supporting C&C Group’s 2024 focus on service density. Cold-chain integrity and keg logistics preserve product quality through temperature-controlled warehousing and specialist keg handling that limit spoilage risk. Route optimization cuts lead times and emissions via dynamic routing and telematics. Reverse logistics recovers containers efficiently through depot returns and reuse streams.
Brand building and integrated marketing
ATL, digital and experiential campaigns drive awareness and preference, with digital representing roughly 63% of global ad spend in 2024, amplifying reach and cost-efficiency. Trade marketing secures secondary placements and POS, typically boosting in-store visibility and incremental sales by double digits. Social and influencer programs expanded cohort reach, with influencer spend rising in 2024 and delivering outsized engagement. Measurement steers media mix and creative optimization in real time.
Sales, key account management, and revenue management
Sales, key account management and revenue management secure listings, space and promo frequency through customer negotiations; C&C Group reported revenue of €1,146.6m in FY 2023, underpinning commercial leverage in 2024. Price-pack architecture and mix management optimize margin per SKU while field execution drives on-shelf compliance and 98% availability targets. Joint planning with retail partners aligns forecasts and innovation pipelines to lift sell-through.
- Listings & space: negotiated shelf & promo slots
- Price-pack: mix optimisation to boost margin
- Field execution: 98% availability target
- Joint planning: aligned forecasts & innovation
Innovation, NPD, and regulatory compliance
Consumer insights drive new flavors, formats and low/no-alcohol lines, aligning with a low/no-alcohol market valued at $7.5bn in 2024; pilot trials validate taste, stability and scale-up before capex commitment; labeling, health and excise compliance reduce regulatory and excise-duty risk; post-launch reviews use sales and return-rate metrics to refine range and lifecycle decisions.
- Consumer-led briefing
- Pilot validation: taste, stability, scale
- Regulatory: labeling, health, excise
- Post-launch review: SKU rationalization
End-to-end OEE >80%, 98% availability drive €1,146.6m into $7.5bn low/no-alc
End-to-end production (OEE >80%) and capacity balancing (peak volumes +30–40%) secure supply and margins. Network planning, cold-chain and route optimisation support 98% availability and reduced last-mile lead times. Marketing/digital (63% of ad spend in 2024) and sales/revenue management (FY2023 revenue €1,146.6m) drive distribution and NPD into the $7.5bn low/no-alc segment.
| Metric | Value |
|---|---|
| FY2023 revenue | €1,146.6m |
| OEE | >80% |
| Availability | 98% |
| Digital ad spend | 63% |
| Low/no-alc market 2024 | $7.5bn |
| Peak volume swing | 30–40% |
Full Version Awaits
Business Model Canvas
The C&C Group Business Model Canvas shown here is the actual deliverable, not a mockup; it contains the same content, layout, and editable elements you’ll receive after purchase. Upon ordering, you’ll instantly download the full Word and Excel files—ready to edit, present, and implement without alterations or missing sections.
Original: $10.00
-65%$10.00
$3.50Description
Actionable Business Model Canvas to Benchmark, Plan and Scale Your Consumer Beverage Business
Unlock the full strategic blueprint behind C&C Group’s business model with a concise, actionable Business Model Canvas that maps customer segments, value propositions, revenue streams and key partners. Perfect for investors, consultants and founders seeking competitive insight. Purchase the downloadable Word & Excel canvas to benchmark, plan and scale with confidence.
Partnerships
On-trade pub, bar, and venue groups
Strategic ties with national pub companies and independent venues secure tap space and menu listings, underpinning C&C’s on-trade reach as UK hospitality footfall recovered to about 95% of 2019 levels in 2024 (Springboard). Joint promotional calendars drive footfall and throughput, while data sharing with partners improves assortment and pricing execution across regions and can boost SKU sell-through by double digits. Long-term pouring rights agreements, typically 3–5 years, stabilize volumes and revenue visibility.
Off-trade retailers and convenience chains
Partnerships with supermarkets, symbol groups and off-licences secure shelf presence and prime placement, crucial for C&C Group's off-trade distribution in 2024. Joint business planning aligns category growth targets and promotions to drive sell-through. Retail media and shopper marketing amplify brand visibility at point of purchase. Collaborative demand forecasting improves service levels and reduces waste.
Agricultural, packaging, and ingredient suppliers
Contracts with apple growers, maltsters, hop merchants, canners and glassmakers secure consistent, high-quality inputs for C&C Group, while multi-year sourcing and hedging programmes materially reduce input-price volatility. Co-development with suppliers on recyclable and bio-based packaging lowers carbon intensity and unit cost, and rigorous quality assurance programs ensure batch-to-batch consistency across cider, beer and RTD lines.
Wholesale, logistics, and route-to-market partners
Alliances with national and regional wholesalers extend C&C Group's reach into thousands of independent retailers, preserving market share across GB and Ireland in 2024. 3PLs, last-mile carriers and keg recovery services streamline delivery, improving OTIF and reducing returns. Shared warehousing smooths seasonality and peak-event demand variability. Systems integration provides near-real-time inventory visibility for replenishment decisions.
- Wholesaler reach: thousands of independents (2024)
- 3PL/last-mile: improves OTIF and reduces delivery AOGs (2024)
- Shared warehousing: smooths peak-season volume spikes (2024)
- Systems integration: near-real-time inventory visibility (2024)
Marketing, events, and sponsorship partners
- Sports/music/festivals: broad reach, brand salience
- Media agencies/digital: scalable targeting
- On-site activations: +22% trial (2024)
- Measurement partners: ROI and brand-lift tracking
On-trade recovery and event-driven trial lift fuel stable volumes and measurable brand reach
Strategic pub and wholesaler ties secure on-trade distribution and long-term pouring rights (3–5y) sustaining volumes. Retail and symbol-group partnerships drive off-trade shelf presence and promotions. Multi-year supplier contracts and 3PLs stabilise input costs, OTIF and inventory visibility. Event/media alliances lift trial and brand reach with measurable ROI.
| Metric | 2024 | Impact |
|---|---|---|
| On-trade footfall vs 2019 | 95% | Stable volumes |
| Sponsorship market | $81bn | +8% |
| Event trial uplift | +22% | Higher NPD trial |
What is included in the product
Detailed Word Document
A ready-to-use Business Model Canvas for C&C Group detailing customer segments, value propositions, channels, revenue streams and key resources across the 9 BMC blocks, tied to real-world operations, competitive advantages and SWOT insights for investor-ready presentations.
Customizable Excel Spreadsheet
High-level view of C&C Group's business model with editable cells, condensing strategy into a digestible one-page snapshot for quick review and team collaboration.
Activities
Brewing, cidermaking, and packaging operations
End-to-end production converts raw materials into finished kegs, casks, cans and bottles, supporting C&C’s on‑trade and retail distribution. OEE targets above 80%, disciplined yield management and TPM reduce downtime and protect margins. Capacity balancing aligns with seasonal demand spikes — peak volumes can swing circa 30–40% — while continuous improvement programs drive quality and cost competitiveness into 2024.
Distribution, warehousing, and fleet management
Network planning positions inventory close to customers, reducing typical last-mile lead times and supporting C&C Group’s 2024 focus on service density. Cold-chain integrity and keg logistics preserve product quality through temperature-controlled warehousing and specialist keg handling that limit spoilage risk. Route optimization cuts lead times and emissions via dynamic routing and telematics. Reverse logistics recovers containers efficiently through depot returns and reuse streams.
Brand building and integrated marketing
ATL, digital and experiential campaigns drive awareness and preference, with digital representing roughly 63% of global ad spend in 2024, amplifying reach and cost-efficiency. Trade marketing secures secondary placements and POS, typically boosting in-store visibility and incremental sales by double digits. Social and influencer programs expanded cohort reach, with influencer spend rising in 2024 and delivering outsized engagement. Measurement steers media mix and creative optimization in real time.
Sales, key account management, and revenue management
Sales, key account management and revenue management secure listings, space and promo frequency through customer negotiations; C&C Group reported revenue of €1,146.6m in FY 2023, underpinning commercial leverage in 2024. Price-pack architecture and mix management optimize margin per SKU while field execution drives on-shelf compliance and 98% availability targets. Joint planning with retail partners aligns forecasts and innovation pipelines to lift sell-through.
- Listings & space: negotiated shelf & promo slots
- Price-pack: mix optimisation to boost margin
- Field execution: 98% availability target
- Joint planning: aligned forecasts & innovation
Innovation, NPD, and regulatory compliance
Consumer insights drive new flavors, formats and low/no-alcohol lines, aligning with a low/no-alcohol market valued at $7.5bn in 2024; pilot trials validate taste, stability and scale-up before capex commitment; labeling, health and excise compliance reduce regulatory and excise-duty risk; post-launch reviews use sales and return-rate metrics to refine range and lifecycle decisions.
- Consumer-led briefing
- Pilot validation: taste, stability, scale
- Regulatory: labeling, health, excise
- Post-launch review: SKU rationalization
End-to-end OEE >80%, 98% availability drive €1,146.6m into $7.5bn low/no-alc
End-to-end production (OEE >80%) and capacity balancing (peak volumes +30–40%) secure supply and margins. Network planning, cold-chain and route optimisation support 98% availability and reduced last-mile lead times. Marketing/digital (63% of ad spend in 2024) and sales/revenue management (FY2023 revenue €1,146.6m) drive distribution and NPD into the $7.5bn low/no-alc segment.
| Metric | Value |
|---|---|
| FY2023 revenue | €1,146.6m |
| OEE | >80% |
| Availability | 98% |
| Digital ad spend | 63% |
| Low/no-alc market 2024 | $7.5bn |
| Peak volume swing | 30–40% |
Full Version Awaits
Business Model Canvas
The C&C Group Business Model Canvas shown here is the actual deliverable, not a mockup; it contains the same content, layout, and editable elements you’ll receive after purchase. Upon ordering, you’ll instantly download the full Word and Excel files—ready to edit, present, and implement without alterations or missing sections.











