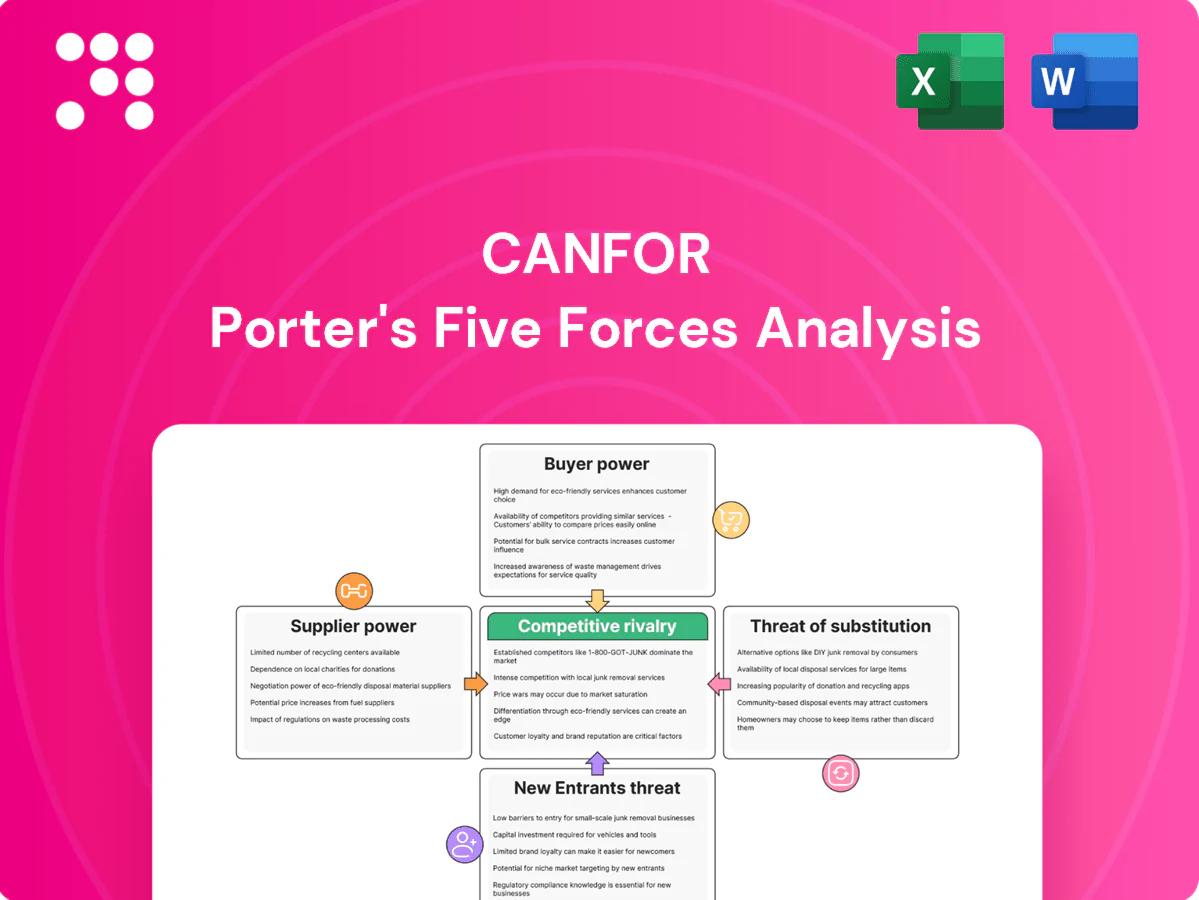
Canfor Porter's Five Forces Analysis

Go Beyond the Preview—Access the Full Strategic Report
Canfor faces moderate supplier power from timber availability and pulp markets while buyer power is elevated by large construction and export customers; rivalry is intense among North American producers with persistent pricing pressure, and substitutes like engineered wood and imports increase risk. This brief snapshot only scratches the surface. Unlock the full Porter's Five Forces Analysis to explore Canfor’s competitive dynamics, market pressures, and strategic advantages in detail.
Suppliers Bargaining Power

Timberland and stumpage concentration
Access to high-quality fibre hinges on government stumpage auctions and large private timberland owners that concentrate regional supply; British Columbia's allowable annual cut was about 68 million m3 in 2024, underscoring regional dependence.
Long-term tenure and supply agreements reduce volatility but often include price escalators linked to market indices, transferring cost risk to buyers.
Supply shocks from wildfires, pests or conservation set-asides tighten availability and raise costs—BC burned roughly 1.2 million ha in 2023, pressuring 2024 supplies.
Canfor's SFI/PEFC-certified sourcing diversifies sources and supports access, but certification cannot fully offset regional scarcity or systemic stumpage concentration.
Logging, trucking, and rail capacity
In 2024 specialized harvesting contractors and limited trucking and rail slots in peak season created clear bottlenecks that increased supplier leverage over Canfor. Rising fuel and labor pressures in 2024 prompted frequent surcharges and contract rate resets, amplifying supplier bargaining power. Disruptions to key rail corridors or ports forced higher-cost rerouting, and while multi-carrier contracts and in-house logistics mitigated risk, capacity remained a chokepoint.

Chemicals, energy, and consumables
Canfor sources pulping chemicals, resins and energy from a relatively consolidated supplier base, giving suppliers moderate bargaining power and exposure to supply tightness in specialty chemicals.
Input price pass-throughs and index-linked contracts in 2024 have limited short-term relief but can increase cost volatility for Canfor when indices swing.
Co-generation and bioenergy at key mills partially hedge electricity and steam needs, reducing dependence on grid power, yet sudden spikes in natural gas or specialty chemical prices can still compress margins.

Equipment and maintenance OEMs
Capital equipment for mills and continuous digesters is supplied by a small number of OEMs with proprietary parts, giving suppliers high leverage; long lead times (commonly 6–18 months in 2024) and mandatory service agreements further strengthen supplier power. Predictive maintenance and on-site parts inventories reduce downtime risk but lock up working capital and increase carrying costs. Upgrades to boost yield and energy efficiency raise switching costs by embedding OEM-specific technology and spare parts.
- Few OEMs — concentrated supplier base
- 6–18 month lead times (2024)
- Service agreements increase dependency
- Inventory & predictive maintenance tie up working capital
- Efficiency upgrades raise switching costs
Environmental and compliance services
Environmental and compliance service providers—third-party certifiers and monitoring firms—hold notable leverage over Canfor by affecting license-to-operate; in 2024 forest certification audits averaged CAD 25–40k per major audit and expedited services carried premiums up to 30% during tight regulatory windows. Ongoing external verification reduces emergency remediation spend but adds recurring Opex, and specialized vendors can extend timelines, raising capex and schedule risk.
- 2024 audit fees: CAD 25–40k per major certification
- Expedited premium: up to 30%
- Verification lowers emergency spend but increases recurring Opex
High supplier leverage as BC AAC 68M m3, OEM lead times 6–18 months
Supplier leverage is high: regional stumpage concentration and BC AAC ~68 million m3 (2024) limit fibre availability. OEMs and specialty chemical providers exert strong pricing power with 6–18 month lead times and concentrated supply. Logistics bottlenecks, wildfire-driven shortages (BC ~1.2M ha burned in 2023) and 2024 audit fees (CAD25–40k) further tighten margins.
| Metric | 2024 value |
|---|---|
| BC AAC | 68M m3 |
| OEM lead times | 6–18 months |
| Wildfire area (2023) | 1.2M ha |
| Audit fees | CAD25–40k |
What is included in the product
 Detailed Word Document
Concise Porter's Five Forces analysis for Canfor that evaluates competitive rivalry, supplier and buyer power, threat of substitutes and new entrants, and highlights disruptive risks and strategic levers to protect margins.

 Customizable Excel Spreadsheet
A concise one-sheet Porter's Five Forces for Canfor—clarifies competitive pressures and supplier/buyer leverage for quick strategic decisions.
Customers Bargaining Power

Concentrated wholesale and retail buyers
Large buyers such as Home Depot and Lowe’s, which together capture roughly 60% of US DIY/home improvement retail sales, plus national distributors and truss manufacturers purchase at scale with sophisticated sourcing, demanding volume rebates, tight specs and JIT delivery. Their ease of switching among qualified mills keeps lumber prices competitive, while long-term supply programs reduce churn but compress margins for Canfor.
Homebuilder and industrial end-users
Homebuilder and industrial demand drives sensitivity to residential cycles: North American housing starts were about 1.3 million annualized in 2024, amplifying price negotiations when starts slow.
Builders commonly substitute species and grades within code limits, shifting volumes across SPF and hem-fir categories and pressuring specific lumber grades.
Value-added services such as pre-cut packages and EWP integration reduce pure price competition, but downturns in 2024 shifted leverage to buyers seeking concessions.

Pulp customers in tissue and packaging
Tissue, hygiene and packaging buyers practice multi-sourcing and global price benchmarking, with tissue/hygiene estimated to represent roughly 35% of global pulp demand in 2024; quality and delivery consistency are decisive despite product standardization. Buyers leverage alternate mills/regions to extract typical discounts of 5–10%, pressuring Canfor margins. Offering technical service and joint product development has allowed pulp suppliers to secure share and premium contracts.

Export market intermediaries
- Concentration of logistics/FX control
- ~50% drop in container freight vs 2021 → CIF pressure
- 2024 destination regulatory changes → renegotiations
- Relationship depth + hedging tools = term stability
ESG-driven procurement standards
Customers in 2024 increasingly require certified sustainable wood and low-carbon products, raising switching costs in Canfor’s favor where it meets higher standards; buyers now demand verifiable chain-of-custody documentation and may impose price holds tied to ESG claims, while failure to meet criteria can cause rapid disqualification from large contracts.
- Higher switching costs when certified
- Documentation and price holds enforced
- Rapid disqualification if criteria unmet
Major buyers and exporters squeeze margins as freight falls 50% and housing cycles rise
Large national buyers (Home Depot, Lowe’s ~60% US DIY) and exporters/traders exert high price leverage via scale, switching and CIF demands; 2024 container rates ~50% below 2021 intensified margin pressure. Housing starts ~1.3M (2024) raise cyclic sensitivity; tissue/pulp buyers (~35% of pulp demand) extract 5–10% discounts. Certification raises switching costs where met, supporting premiums.
| Category | 2024 metric | Impact |
|---|---|---|
| Home improvement share | ~60% | High buyer leverage |
| Housing starts | ~1.3M | Cyclic price sensitivity |
| Pulp demand (tissue) | ~35% | 5–10% buyer discounts |
| Container freight vs 2021 | ~-50% | CIF/margin pressure |
Preview the Actual Deliverable
Canfor Porter's Five Forces Analysis
This Canfor Porter's Five Forces analysis provides a concise, professional assessment of competitive intensity, supplier and buyer power, threat of entry and substitutes, and industry rivalry. This preview is the exact document you’ll receive upon purchase—fully formatted and ready for immediate download. No placeholders or samples, just the complete deliverable for your use.

Go Beyond the Preview—Access the Full Strategic Report
Canfor faces moderate supplier power from timber availability and pulp markets while buyer power is elevated by large construction and export customers; rivalry is intense among North American producers with persistent pricing pressure, and substitutes like engineered wood and imports increase risk. This brief snapshot only scratches the surface. Unlock the full Porter's Five Forces Analysis to explore Canfor’s competitive dynamics, market pressures, and strategic advantages in detail.
Suppliers Bargaining Power
Timberland and stumpage concentration
Access to high-quality fibre hinges on government stumpage auctions and large private timberland owners that concentrate regional supply; British Columbia's allowable annual cut was about 68 million m3 in 2024, underscoring regional dependence.
Long-term tenure and supply agreements reduce volatility but often include price escalators linked to market indices, transferring cost risk to buyers.
Supply shocks from wildfires, pests or conservation set-asides tighten availability and raise costs—BC burned roughly 1.2 million ha in 2023, pressuring 2024 supplies.
Canfor's SFI/PEFC-certified sourcing diversifies sources and supports access, but certification cannot fully offset regional scarcity or systemic stumpage concentration.
Logging, trucking, and rail capacity
In 2024 specialized harvesting contractors and limited trucking and rail slots in peak season created clear bottlenecks that increased supplier leverage over Canfor. Rising fuel and labor pressures in 2024 prompted frequent surcharges and contract rate resets, amplifying supplier bargaining power. Disruptions to key rail corridors or ports forced higher-cost rerouting, and while multi-carrier contracts and in-house logistics mitigated risk, capacity remained a chokepoint.
Chemicals, energy, and consumables
Canfor sources pulping chemicals, resins and energy from a relatively consolidated supplier base, giving suppliers moderate bargaining power and exposure to supply tightness in specialty chemicals.
Input price pass-throughs and index-linked contracts in 2024 have limited short-term relief but can increase cost volatility for Canfor when indices swing.
Co-generation and bioenergy at key mills partially hedge electricity and steam needs, reducing dependence on grid power, yet sudden spikes in natural gas or specialty chemical prices can still compress margins.
Equipment and maintenance OEMs
Capital equipment for mills and continuous digesters is supplied by a small number of OEMs with proprietary parts, giving suppliers high leverage; long lead times (commonly 6–18 months in 2024) and mandatory service agreements further strengthen supplier power. Predictive maintenance and on-site parts inventories reduce downtime risk but lock up working capital and increase carrying costs. Upgrades to boost yield and energy efficiency raise switching costs by embedding OEM-specific technology and spare parts.
- Few OEMs — concentrated supplier base
- 6–18 month lead times (2024)
- Service agreements increase dependency
- Inventory & predictive maintenance tie up working capital
- Efficiency upgrades raise switching costs
Environmental and compliance services
Environmental and compliance service providers—third-party certifiers and monitoring firms—hold notable leverage over Canfor by affecting license-to-operate; in 2024 forest certification audits averaged CAD 25–40k per major audit and expedited services carried premiums up to 30% during tight regulatory windows. Ongoing external verification reduces emergency remediation spend but adds recurring Opex, and specialized vendors can extend timelines, raising capex and schedule risk.
- 2024 audit fees: CAD 25–40k per major certification
- Expedited premium: up to 30%
- Verification lowers emergency spend but increases recurring Opex
High supplier leverage as BC AAC 68M m3, OEM lead times 6–18 months
Supplier leverage is high: regional stumpage concentration and BC AAC ~68 million m3 (2024) limit fibre availability. OEMs and specialty chemical providers exert strong pricing power with 6–18 month lead times and concentrated supply. Logistics bottlenecks, wildfire-driven shortages (BC ~1.2M ha burned in 2023) and 2024 audit fees (CAD25–40k) further tighten margins.
| Metric | 2024 value |
|---|---|
| BC AAC | 68M m3 |
| OEM lead times | 6–18 months |
| Wildfire area (2023) | 1.2M ha |
| Audit fees | CAD25–40k |
What is included in the product
Detailed Word Document
Concise Porter's Five Forces analysis for Canfor that evaluates competitive rivalry, supplier and buyer power, threat of substitutes and new entrants, and highlights disruptive risks and strategic levers to protect margins.
Customizable Excel Spreadsheet
A concise one-sheet Porter's Five Forces for Canfor—clarifies competitive pressures and supplier/buyer leverage for quick strategic decisions.
Customers Bargaining Power
Concentrated wholesale and retail buyers
Large buyers such as Home Depot and Lowe’s, which together capture roughly 60% of US DIY/home improvement retail sales, plus national distributors and truss manufacturers purchase at scale with sophisticated sourcing, demanding volume rebates, tight specs and JIT delivery. Their ease of switching among qualified mills keeps lumber prices competitive, while long-term supply programs reduce churn but compress margins for Canfor.
Homebuilder and industrial end-users
Homebuilder and industrial demand drives sensitivity to residential cycles: North American housing starts were about 1.3 million annualized in 2024, amplifying price negotiations when starts slow.
Builders commonly substitute species and grades within code limits, shifting volumes across SPF and hem-fir categories and pressuring specific lumber grades.
Value-added services such as pre-cut packages and EWP integration reduce pure price competition, but downturns in 2024 shifted leverage to buyers seeking concessions.
Pulp customers in tissue and packaging
Tissue, hygiene and packaging buyers practice multi-sourcing and global price benchmarking, with tissue/hygiene estimated to represent roughly 35% of global pulp demand in 2024; quality and delivery consistency are decisive despite product standardization. Buyers leverage alternate mills/regions to extract typical discounts of 5–10%, pressuring Canfor margins. Offering technical service and joint product development has allowed pulp suppliers to secure share and premium contracts.
Export market intermediaries
- Concentration of logistics/FX control
- ~50% drop in container freight vs 2021 → CIF pressure
- 2024 destination regulatory changes → renegotiations
- Relationship depth + hedging tools = term stability
ESG-driven procurement standards
Customers in 2024 increasingly require certified sustainable wood and low-carbon products, raising switching costs in Canfor’s favor where it meets higher standards; buyers now demand verifiable chain-of-custody documentation and may impose price holds tied to ESG claims, while failure to meet criteria can cause rapid disqualification from large contracts.
- Higher switching costs when certified
- Documentation and price holds enforced
- Rapid disqualification if criteria unmet
Major buyers and exporters squeeze margins as freight falls 50% and housing cycles rise
Large national buyers (Home Depot, Lowe’s ~60% US DIY) and exporters/traders exert high price leverage via scale, switching and CIF demands; 2024 container rates ~50% below 2021 intensified margin pressure. Housing starts ~1.3M (2024) raise cyclic sensitivity; tissue/pulp buyers (~35% of pulp demand) extract 5–10% discounts. Certification raises switching costs where met, supporting premiums.
| Category | 2024 metric | Impact |
|---|---|---|
| Home improvement share | ~60% | High buyer leverage |
| Housing starts | ~1.3M | Cyclic price sensitivity |
| Pulp demand (tissue) | ~35% | 5–10% buyer discounts |
| Container freight vs 2021 | ~-50% | CIF/margin pressure |
Preview the Actual Deliverable
Canfor Porter's Five Forces Analysis
This Canfor Porter's Five Forces analysis provides a concise, professional assessment of competitive intensity, supplier and buyer power, threat of entry and substitutes, and industry rivalry. This preview is the exact document you’ll receive upon purchase—fully formatted and ready for immediate download. No placeholders or samples, just the complete deliverable for your use.
Original: $10.00
-65%$10.00
$3.50Description
Go Beyond the Preview—Access the Full Strategic Report
Canfor faces moderate supplier power from timber availability and pulp markets while buyer power is elevated by large construction and export customers; rivalry is intense among North American producers with persistent pricing pressure, and substitutes like engineered wood and imports increase risk. This brief snapshot only scratches the surface. Unlock the full Porter's Five Forces Analysis to explore Canfor’s competitive dynamics, market pressures, and strategic advantages in detail.
Suppliers Bargaining Power
Timberland and stumpage concentration
Access to high-quality fibre hinges on government stumpage auctions and large private timberland owners that concentrate regional supply; British Columbia's allowable annual cut was about 68 million m3 in 2024, underscoring regional dependence.
Long-term tenure and supply agreements reduce volatility but often include price escalators linked to market indices, transferring cost risk to buyers.
Supply shocks from wildfires, pests or conservation set-asides tighten availability and raise costs—BC burned roughly 1.2 million ha in 2023, pressuring 2024 supplies.
Canfor's SFI/PEFC-certified sourcing diversifies sources and supports access, but certification cannot fully offset regional scarcity or systemic stumpage concentration.
Logging, trucking, and rail capacity
In 2024 specialized harvesting contractors and limited trucking and rail slots in peak season created clear bottlenecks that increased supplier leverage over Canfor. Rising fuel and labor pressures in 2024 prompted frequent surcharges and contract rate resets, amplifying supplier bargaining power. Disruptions to key rail corridors or ports forced higher-cost rerouting, and while multi-carrier contracts and in-house logistics mitigated risk, capacity remained a chokepoint.
Chemicals, energy, and consumables
Canfor sources pulping chemicals, resins and energy from a relatively consolidated supplier base, giving suppliers moderate bargaining power and exposure to supply tightness in specialty chemicals.
Input price pass-throughs and index-linked contracts in 2024 have limited short-term relief but can increase cost volatility for Canfor when indices swing.
Co-generation and bioenergy at key mills partially hedge electricity and steam needs, reducing dependence on grid power, yet sudden spikes in natural gas or specialty chemical prices can still compress margins.
Equipment and maintenance OEMs
Capital equipment for mills and continuous digesters is supplied by a small number of OEMs with proprietary parts, giving suppliers high leverage; long lead times (commonly 6–18 months in 2024) and mandatory service agreements further strengthen supplier power. Predictive maintenance and on-site parts inventories reduce downtime risk but lock up working capital and increase carrying costs. Upgrades to boost yield and energy efficiency raise switching costs by embedding OEM-specific technology and spare parts.
- Few OEMs — concentrated supplier base
- 6–18 month lead times (2024)
- Service agreements increase dependency
- Inventory & predictive maintenance tie up working capital
- Efficiency upgrades raise switching costs
Environmental and compliance services
Environmental and compliance service providers—third-party certifiers and monitoring firms—hold notable leverage over Canfor by affecting license-to-operate; in 2024 forest certification audits averaged CAD 25–40k per major audit and expedited services carried premiums up to 30% during tight regulatory windows. Ongoing external verification reduces emergency remediation spend but adds recurring Opex, and specialized vendors can extend timelines, raising capex and schedule risk.
- 2024 audit fees: CAD 25–40k per major certification
- Expedited premium: up to 30%
- Verification lowers emergency spend but increases recurring Opex
High supplier leverage as BC AAC 68M m3, OEM lead times 6–18 months
Supplier leverage is high: regional stumpage concentration and BC AAC ~68 million m3 (2024) limit fibre availability. OEMs and specialty chemical providers exert strong pricing power with 6–18 month lead times and concentrated supply. Logistics bottlenecks, wildfire-driven shortages (BC ~1.2M ha burned in 2023) and 2024 audit fees (CAD25–40k) further tighten margins.
| Metric | 2024 value |
|---|---|
| BC AAC | 68M m3 |
| OEM lead times | 6–18 months |
| Wildfire area (2023) | 1.2M ha |
| Audit fees | CAD25–40k |
What is included in the product
Detailed Word Document
Concise Porter's Five Forces analysis for Canfor that evaluates competitive rivalry, supplier and buyer power, threat of substitutes and new entrants, and highlights disruptive risks and strategic levers to protect margins.
Customizable Excel Spreadsheet
A concise one-sheet Porter's Five Forces for Canfor—clarifies competitive pressures and supplier/buyer leverage for quick strategic decisions.
Customers Bargaining Power
Concentrated wholesale and retail buyers
Large buyers such as Home Depot and Lowe’s, which together capture roughly 60% of US DIY/home improvement retail sales, plus national distributors and truss manufacturers purchase at scale with sophisticated sourcing, demanding volume rebates, tight specs and JIT delivery. Their ease of switching among qualified mills keeps lumber prices competitive, while long-term supply programs reduce churn but compress margins for Canfor.
Homebuilder and industrial end-users
Homebuilder and industrial demand drives sensitivity to residential cycles: North American housing starts were about 1.3 million annualized in 2024, amplifying price negotiations when starts slow.
Builders commonly substitute species and grades within code limits, shifting volumes across SPF and hem-fir categories and pressuring specific lumber grades.
Value-added services such as pre-cut packages and EWP integration reduce pure price competition, but downturns in 2024 shifted leverage to buyers seeking concessions.
Pulp customers in tissue and packaging
Tissue, hygiene and packaging buyers practice multi-sourcing and global price benchmarking, with tissue/hygiene estimated to represent roughly 35% of global pulp demand in 2024; quality and delivery consistency are decisive despite product standardization. Buyers leverage alternate mills/regions to extract typical discounts of 5–10%, pressuring Canfor margins. Offering technical service and joint product development has allowed pulp suppliers to secure share and premium contracts.
Export market intermediaries
- Concentration of logistics/FX control
- ~50% drop in container freight vs 2021 → CIF pressure
- 2024 destination regulatory changes → renegotiations
- Relationship depth + hedging tools = term stability
ESG-driven procurement standards
Customers in 2024 increasingly require certified sustainable wood and low-carbon products, raising switching costs in Canfor’s favor where it meets higher standards; buyers now demand verifiable chain-of-custody documentation and may impose price holds tied to ESG claims, while failure to meet criteria can cause rapid disqualification from large contracts.
- Higher switching costs when certified
- Documentation and price holds enforced
- Rapid disqualification if criteria unmet
Major buyers and exporters squeeze margins as freight falls 50% and housing cycles rise
Large national buyers (Home Depot, Lowe’s ~60% US DIY) and exporters/traders exert high price leverage via scale, switching and CIF demands; 2024 container rates ~50% below 2021 intensified margin pressure. Housing starts ~1.3M (2024) raise cyclic sensitivity; tissue/pulp buyers (~35% of pulp demand) extract 5–10% discounts. Certification raises switching costs where met, supporting premiums.
| Category | 2024 metric | Impact |
|---|---|---|
| Home improvement share | ~60% | High buyer leverage |
| Housing starts | ~1.3M | Cyclic price sensitivity |
| Pulp demand (tissue) | ~35% | 5–10% buyer discounts |
| Container freight vs 2021 | ~-50% | CIF/margin pressure |
Preview the Actual Deliverable
Canfor Porter's Five Forces Analysis
This Canfor Porter's Five Forces analysis provides a concise, professional assessment of competitive intensity, supplier and buyer power, threat of entry and substitutes, and industry rivalry. This preview is the exact document you’ll receive upon purchase—fully formatted and ready for immediate download. No placeholders or samples, just the complete deliverable for your use.











