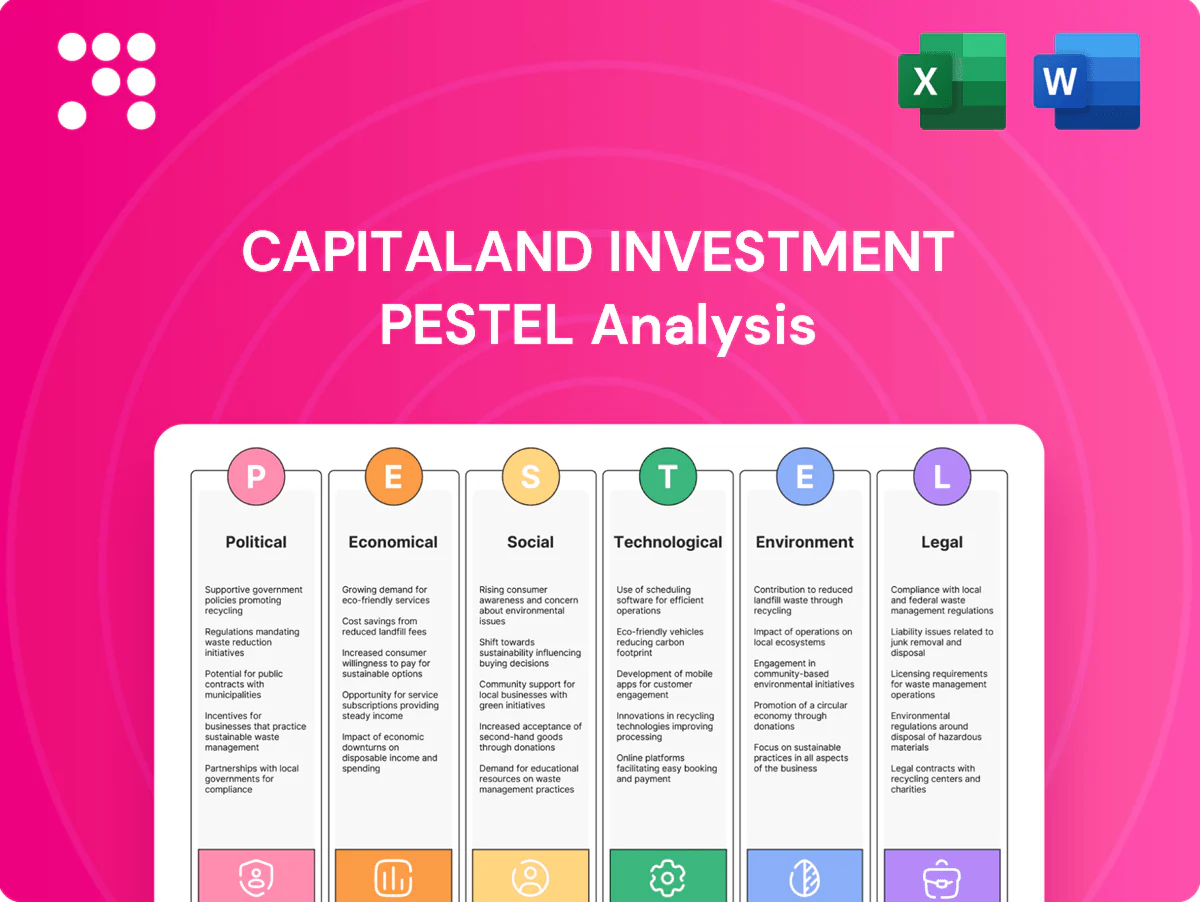
CapitaLand Investment PESTLE Analysis

Your Competitive Advantage Starts with This Report
Our CapitaLand Investment PESTLE Analysis reveals how political shifts, economic cycles, social trends, technological advances, legal frameworks, and environmental pressures shape the company’s outlook. Packed with up-to-date, actionable insights, it’s ideal for investors and strategists. Purchase the full report to access the complete breakdown and ready-to-use recommendations.
Political factors

Policy shifts in key markets
CLI’s exposure to Singapore (GDP +2.5% in 2024), China (+5.2%), India (+7.5%) and developed markets (US +2.6%) makes it sensitive to fiscal, monetary and urban policies. Shifts in housing, retail or office revitalisation programs can change demand and incentives; government transit and infrastructure spending can unlock asset value, while austerity or anti‑speculation moves can slow leasing and capital recycling. Continuous policy monitoring is vital for pipeline and fund strategy.
Geopolitical tensions and supply chains
US–China frictions, regional conflicts and reshoring trends have tightened cross-border capital flows and occupier choices, pushing risk premiums up by roughly 50–150 basis points in higher-risk jurisdictions since 2022; data centres and logistics assets face heightened scrutiny under technology export controls and resilience requirements. Portfolio diversification and scenario planning—including geographic caps and stress tests—are being used to mitigate concentration risk.

Foreign investment and ownership rules
Restrictions on land acquisition, capital repatriation and beneficial ownership disclosure across China, India and SEA force CapitaLand Investment to tailor JV and SPV structures, affecting deal pricing and tax outcomes. Jurisdictional REIT/fund permissions shape fee-income growth — CLI managed over S$150bn AUM by mid-2024, concentrating product launches in REIT-friendly markets. Preferential regimes attract fund vehicles but risk reversal with elections, so robust compliance and local partnerships secure approvals and continuity.

Public–private partnerships and incentives
Public–private partnership incentives for urban renewal, sustainability retrofits and digital infrastructure can improve project IRRs and scale placemaking; CapitaLand Investment (AUM ~S$120bn in 2024) leverages such programs to de-risk integrated developments. Securing PPPs enables masterplanned mixed-use delivery; competitive grant schemes demand proven operating credentials and measurable outcomes. Policy reversals can delay pipelines and compress returns.
- Incentives: uplift IRR, access to grants
- PPPs: enable integrated placemaking
- Grants: require track record, KPIs
- Risks: policy reversals affect timing/returns
Travel and mobility policies
Visa regimes and public‑health rules directly shift lodging occupancy and retail footfall; Singapore saw 9.61M visitors in 2023 and Changi handled ~55.8M pax in 2023, underpinning demand. Tourism promotion and improved air connectivity helped Asia‑Pacific RevPAR recover to ~88% of 2019 levels in 2023 (STR), boosting mall sales and RevPAR, while new restrictions or taxes can quickly suppress cross‑border demand; diversified lodging brands and markets reduce volatility for CapitaLand Investment.
- Visa & health rules: immediate occupancy/footfall impact
- Air connectivity: drives RevPAR and retail sales (Changi 55.8M, 2023)
- Risks: travel restrictions/new taxes cut cross‑border demand
- Diversification: multi‑brand, multi‑market mix lowers revenue volatility
Asia policy shocks, trade frictions lift risk premia; S$120bn AUM under scrutiny
CLI’s exposure across Singapore (GDP +2.5% 2024), China (+5.2%), India (+7.5%) and developed markets makes it sensitive to fiscal/urban policy, trade frictions (risk premia +50–150bps since 2022) and land/capital controls; PPPs and grants (AUM ~S$120bn 2024) boost IRRs but policy reversals threaten pipelines.
| Item | Key stat |
|---|---|
| AUM | S$120bn (2024) |
| Risk premia | +50–150bps since 2022 |
| Changi pax | 55.8M (2023) |
What is included in the product
 Detailed Word Document
Explores how external macro-environmental factors uniquely affect CapitaLand Investment across Political, Economic, Social, Technological, Environmental and Legal dimensions, with data-backed trends and region-specific regulatory context. Designed for executives, investors and advisors, it provides actionable risks, opportunities and forward-looking insights ready for business plans, pitch decks and scenario planning.

 Customizable Excel Spreadsheet
A concise, visually segmented PESTLE summary for CapitaLand Investment that streamlines stakeholder briefings, supports external risk and market positioning discussions, and can be dropped into presentations or shared across teams for quick alignment.
Economic factors

Interest rates and cap rates
Global rate paths drive financing costs, valuation yields and fundraising appetite: US federal funds at 5.25–5.50% and the 10-year Treasury near 4.3% (mid‑2025) have pushed borrowing costs materially higher.
Higher rates pressure cap rates and NAVs, constraining fee‑bearing AUM growth as pricing yields reprice upward and valuations mark down.
Refinancing risk rises for leveraged assets while dry powder benefits from repricing; active hedging and capital recycling are therefore essential risk‑management and value‑capture tools.
GDP growth and occupier demand
Office, retail and industrial absorption closely follow macro growth and employment—IMF projected global growth near 3.0%–3.3% for 2024–25, supporting leasing in major markets. New-economy uses and data centre demand have outpaced legacy segments, with hyperscale take-up tightening vacancy in key APAC hubs. Slowing growth compresses rent reversion and boosts landlord concessions, so market selection and sector rotation sustain NOI.

FX volatility and earnings translation
CapitaLand Investment faces translation and transaction risk from multi-currency revenues and costs across USD, SGD, CNY and INR, which can compress fee income and distributions when major currencies move against reporting currency. Hedging programs and local-currency financing are deployed to dampen portfolio volatility and protect distributions. Fund mandates often prefer currency-matched assets to reduce FX mismatch.

Inflation and operating expenses
Utility, labor, and maintenance inflation compress CapitaLand Investment property margins as rising input costs erode operating income; CPI-linked lease escalations in many commercial and logistics contracts provide partial offset where clauses exist.
Scale procurement and energy-efficiency retrofits have demonstrably reduced opex in CLI portfolios, while transparent cost pass-through mechanisms strengthen NOI resilience during inflationary periods.
- Utility and labor inflation squeeze margins
- CPI-linked escalations partially offset costs
- Energy efficiency and procurement scale lower opex
- Transparent pass-throughs bolster NOI resilience
Capital market liquidity
Capital market liquidity shapes CLI exits: tight windows lengthen holds and raise target returns, while active IPO/REIT markets and deep secondaries enable faster monetisation; CLI reported AUM ~SGD 150bn (2024) and benefits when REIT issuance and secondary depth recover.
- Fundraising cycles: variable; dry powder ~USD 430bn (2024)
- IPO/REIT windows: dictate timing
- Strong track records attract institutional capital
- Co-invests/club deals bridge gaps
Asia policy shocks, trade frictions lift risk premia; S$120bn AUM under scrutiny
Higher global rates (Fed 5.25–5.50%, 10y ~4.3% mid‑2025) raise financing costs, cap‑rate pressure and NAV markdowns; IMF global growth ~3.1% (2024–25) supports selective leasing while slowing demand raises concessions. CLI AUM ~SGD150bn (2024) and dry powder ~USD430bn (2024) drive deal pacing; FX, utility and labor inflation remain core margin risks mitigated by hedging and efficiency.
| Metric | Value | Implication |
|---|---|---|
| Fed funds | 5.25–5.50% | Higher borrowing costs |
| 10‑yr US | ~4.3% | Cap‑rate pressure |
| Global growth | ~3.1% | Leasing support |
| CLI AUM | ~SGD150bn | Scale advantage |
| Dry powder | ~USD430bn | Deal flexibility |
Preview the Actual Deliverable
CapitaLand Investment PESTLE Analysis
This CapitaLand Investment PESTLE analysis provides a concise assessment of political, economic, social, technological, legal and environmental factors affecting the company. The preview shown here is the exact document you’ll receive after purchase—fully formatted and ready to use. No placeholders or teasers; the layout and content visible are the final file delivered immediately after payment.

Your Competitive Advantage Starts with This Report
Our CapitaLand Investment PESTLE Analysis reveals how political shifts, economic cycles, social trends, technological advances, legal frameworks, and environmental pressures shape the company’s outlook. Packed with up-to-date, actionable insights, it’s ideal for investors and strategists. Purchase the full report to access the complete breakdown and ready-to-use recommendations.
Political factors
Policy shifts in key markets
CLI’s exposure to Singapore (GDP +2.5% in 2024), China (+5.2%), India (+7.5%) and developed markets (US +2.6%) makes it sensitive to fiscal, monetary and urban policies. Shifts in housing, retail or office revitalisation programs can change demand and incentives; government transit and infrastructure spending can unlock asset value, while austerity or anti‑speculation moves can slow leasing and capital recycling. Continuous policy monitoring is vital for pipeline and fund strategy.
Geopolitical tensions and supply chains
US–China frictions, regional conflicts and reshoring trends have tightened cross-border capital flows and occupier choices, pushing risk premiums up by roughly 50–150 basis points in higher-risk jurisdictions since 2022; data centres and logistics assets face heightened scrutiny under technology export controls and resilience requirements. Portfolio diversification and scenario planning—including geographic caps and stress tests—are being used to mitigate concentration risk.
Foreign investment and ownership rules
Restrictions on land acquisition, capital repatriation and beneficial ownership disclosure across China, India and SEA force CapitaLand Investment to tailor JV and SPV structures, affecting deal pricing and tax outcomes. Jurisdictional REIT/fund permissions shape fee-income growth — CLI managed over S$150bn AUM by mid-2024, concentrating product launches in REIT-friendly markets. Preferential regimes attract fund vehicles but risk reversal with elections, so robust compliance and local partnerships secure approvals and continuity.
Public–private partnerships and incentives
Public–private partnership incentives for urban renewal, sustainability retrofits and digital infrastructure can improve project IRRs and scale placemaking; CapitaLand Investment (AUM ~S$120bn in 2024) leverages such programs to de-risk integrated developments. Securing PPPs enables masterplanned mixed-use delivery; competitive grant schemes demand proven operating credentials and measurable outcomes. Policy reversals can delay pipelines and compress returns.
- Incentives: uplift IRR, access to grants
- PPPs: enable integrated placemaking
- Grants: require track record, KPIs
- Risks: policy reversals affect timing/returns
Travel and mobility policies
Visa regimes and public‑health rules directly shift lodging occupancy and retail footfall; Singapore saw 9.61M visitors in 2023 and Changi handled ~55.8M pax in 2023, underpinning demand. Tourism promotion and improved air connectivity helped Asia‑Pacific RevPAR recover to ~88% of 2019 levels in 2023 (STR), boosting mall sales and RevPAR, while new restrictions or taxes can quickly suppress cross‑border demand; diversified lodging brands and markets reduce volatility for CapitaLand Investment.
- Visa & health rules: immediate occupancy/footfall impact
- Air connectivity: drives RevPAR and retail sales (Changi 55.8M, 2023)
- Risks: travel restrictions/new taxes cut cross‑border demand
- Diversification: multi‑brand, multi‑market mix lowers revenue volatility
Asia policy shocks, trade frictions lift risk premia; S$120bn AUM under scrutiny
CLI’s exposure across Singapore (GDP +2.5% 2024), China (+5.2%), India (+7.5%) and developed markets makes it sensitive to fiscal/urban policy, trade frictions (risk premia +50–150bps since 2022) and land/capital controls; PPPs and grants (AUM ~S$120bn 2024) boost IRRs but policy reversals threaten pipelines.
| Item | Key stat |
|---|---|
| AUM | S$120bn (2024) |
| Risk premia | +50–150bps since 2022 |
| Changi pax | 55.8M (2023) |
What is included in the product
Detailed Word Document
Explores how external macro-environmental factors uniquely affect CapitaLand Investment across Political, Economic, Social, Technological, Environmental and Legal dimensions, with data-backed trends and region-specific regulatory context. Designed for executives, investors and advisors, it provides actionable risks, opportunities and forward-looking insights ready for business plans, pitch decks and scenario planning.
Customizable Excel Spreadsheet
A concise, visually segmented PESTLE summary for CapitaLand Investment that streamlines stakeholder briefings, supports external risk and market positioning discussions, and can be dropped into presentations or shared across teams for quick alignment.
Economic factors
Interest rates and cap rates
Global rate paths drive financing costs, valuation yields and fundraising appetite: US federal funds at 5.25–5.50% and the 10-year Treasury near 4.3% (mid‑2025) have pushed borrowing costs materially higher.
Higher rates pressure cap rates and NAVs, constraining fee‑bearing AUM growth as pricing yields reprice upward and valuations mark down.
Refinancing risk rises for leveraged assets while dry powder benefits from repricing; active hedging and capital recycling are therefore essential risk‑management and value‑capture tools.
GDP growth and occupier demand
Office, retail and industrial absorption closely follow macro growth and employment—IMF projected global growth near 3.0%–3.3% for 2024–25, supporting leasing in major markets. New-economy uses and data centre demand have outpaced legacy segments, with hyperscale take-up tightening vacancy in key APAC hubs. Slowing growth compresses rent reversion and boosts landlord concessions, so market selection and sector rotation sustain NOI.
FX volatility and earnings translation
CapitaLand Investment faces translation and transaction risk from multi-currency revenues and costs across USD, SGD, CNY and INR, which can compress fee income and distributions when major currencies move against reporting currency. Hedging programs and local-currency financing are deployed to dampen portfolio volatility and protect distributions. Fund mandates often prefer currency-matched assets to reduce FX mismatch.
Inflation and operating expenses
Utility, labor, and maintenance inflation compress CapitaLand Investment property margins as rising input costs erode operating income; CPI-linked lease escalations in many commercial and logistics contracts provide partial offset where clauses exist.
Scale procurement and energy-efficiency retrofits have demonstrably reduced opex in CLI portfolios, while transparent cost pass-through mechanisms strengthen NOI resilience during inflationary periods.
- Utility and labor inflation squeeze margins
- CPI-linked escalations partially offset costs
- Energy efficiency and procurement scale lower opex
- Transparent pass-throughs bolster NOI resilience
Capital market liquidity
Capital market liquidity shapes CLI exits: tight windows lengthen holds and raise target returns, while active IPO/REIT markets and deep secondaries enable faster monetisation; CLI reported AUM ~SGD 150bn (2024) and benefits when REIT issuance and secondary depth recover.
- Fundraising cycles: variable; dry powder ~USD 430bn (2024)
- IPO/REIT windows: dictate timing
- Strong track records attract institutional capital
- Co-invests/club deals bridge gaps
Asia policy shocks, trade frictions lift risk premia; S$120bn AUM under scrutiny
Higher global rates (Fed 5.25–5.50%, 10y ~4.3% mid‑2025) raise financing costs, cap‑rate pressure and NAV markdowns; IMF global growth ~3.1% (2024–25) supports selective leasing while slowing demand raises concessions. CLI AUM ~SGD150bn (2024) and dry powder ~USD430bn (2024) drive deal pacing; FX, utility and labor inflation remain core margin risks mitigated by hedging and efficiency.
| Metric | Value | Implication |
|---|---|---|
| Fed funds | 5.25–5.50% | Higher borrowing costs |
| 10‑yr US | ~4.3% | Cap‑rate pressure |
| Global growth | ~3.1% | Leasing support |
| CLI AUM | ~SGD150bn | Scale advantage |
| Dry powder | ~USD430bn | Deal flexibility |
Preview the Actual Deliverable
CapitaLand Investment PESTLE Analysis
This CapitaLand Investment PESTLE analysis provides a concise assessment of political, economic, social, technological, legal and environmental factors affecting the company. The preview shown here is the exact document you’ll receive after purchase—fully formatted and ready to use. No placeholders or teasers; the layout and content visible are the final file delivered immediately after payment.
Original: $10.00
-65%$10.00
$3.50Description
Your Competitive Advantage Starts with This Report
Our CapitaLand Investment PESTLE Analysis reveals how political shifts, economic cycles, social trends, technological advances, legal frameworks, and environmental pressures shape the company’s outlook. Packed with up-to-date, actionable insights, it’s ideal for investors and strategists. Purchase the full report to access the complete breakdown and ready-to-use recommendations.
Political factors
Policy shifts in key markets
CLI’s exposure to Singapore (GDP +2.5% in 2024), China (+5.2%), India (+7.5%) and developed markets (US +2.6%) makes it sensitive to fiscal, monetary and urban policies. Shifts in housing, retail or office revitalisation programs can change demand and incentives; government transit and infrastructure spending can unlock asset value, while austerity or anti‑speculation moves can slow leasing and capital recycling. Continuous policy monitoring is vital for pipeline and fund strategy.
Geopolitical tensions and supply chains
US–China frictions, regional conflicts and reshoring trends have tightened cross-border capital flows and occupier choices, pushing risk premiums up by roughly 50–150 basis points in higher-risk jurisdictions since 2022; data centres and logistics assets face heightened scrutiny under technology export controls and resilience requirements. Portfolio diversification and scenario planning—including geographic caps and stress tests—are being used to mitigate concentration risk.
Foreign investment and ownership rules
Restrictions on land acquisition, capital repatriation and beneficial ownership disclosure across China, India and SEA force CapitaLand Investment to tailor JV and SPV structures, affecting deal pricing and tax outcomes. Jurisdictional REIT/fund permissions shape fee-income growth — CLI managed over S$150bn AUM by mid-2024, concentrating product launches in REIT-friendly markets. Preferential regimes attract fund vehicles but risk reversal with elections, so robust compliance and local partnerships secure approvals and continuity.
Public–private partnerships and incentives
Public–private partnership incentives for urban renewal, sustainability retrofits and digital infrastructure can improve project IRRs and scale placemaking; CapitaLand Investment (AUM ~S$120bn in 2024) leverages such programs to de-risk integrated developments. Securing PPPs enables masterplanned mixed-use delivery; competitive grant schemes demand proven operating credentials and measurable outcomes. Policy reversals can delay pipelines and compress returns.
- Incentives: uplift IRR, access to grants
- PPPs: enable integrated placemaking
- Grants: require track record, KPIs
- Risks: policy reversals affect timing/returns
Travel and mobility policies
Visa regimes and public‑health rules directly shift lodging occupancy and retail footfall; Singapore saw 9.61M visitors in 2023 and Changi handled ~55.8M pax in 2023, underpinning demand. Tourism promotion and improved air connectivity helped Asia‑Pacific RevPAR recover to ~88% of 2019 levels in 2023 (STR), boosting mall sales and RevPAR, while new restrictions or taxes can quickly suppress cross‑border demand; diversified lodging brands and markets reduce volatility for CapitaLand Investment.
- Visa & health rules: immediate occupancy/footfall impact
- Air connectivity: drives RevPAR and retail sales (Changi 55.8M, 2023)
- Risks: travel restrictions/new taxes cut cross‑border demand
- Diversification: multi‑brand, multi‑market mix lowers revenue volatility
Asia policy shocks, trade frictions lift risk premia; S$120bn AUM under scrutiny
CLI’s exposure across Singapore (GDP +2.5% 2024), China (+5.2%), India (+7.5%) and developed markets makes it sensitive to fiscal/urban policy, trade frictions (risk premia +50–150bps since 2022) and land/capital controls; PPPs and grants (AUM ~S$120bn 2024) boost IRRs but policy reversals threaten pipelines.
| Item | Key stat |
|---|---|
| AUM | S$120bn (2024) |
| Risk premia | +50–150bps since 2022 |
| Changi pax | 55.8M (2023) |
What is included in the product
Detailed Word Document
Explores how external macro-environmental factors uniquely affect CapitaLand Investment across Political, Economic, Social, Technological, Environmental and Legal dimensions, with data-backed trends and region-specific regulatory context. Designed for executives, investors and advisors, it provides actionable risks, opportunities and forward-looking insights ready for business plans, pitch decks and scenario planning.
Customizable Excel Spreadsheet
A concise, visually segmented PESTLE summary for CapitaLand Investment that streamlines stakeholder briefings, supports external risk and market positioning discussions, and can be dropped into presentations or shared across teams for quick alignment.
Economic factors
Interest rates and cap rates
Global rate paths drive financing costs, valuation yields and fundraising appetite: US federal funds at 5.25–5.50% and the 10-year Treasury near 4.3% (mid‑2025) have pushed borrowing costs materially higher.
Higher rates pressure cap rates and NAVs, constraining fee‑bearing AUM growth as pricing yields reprice upward and valuations mark down.
Refinancing risk rises for leveraged assets while dry powder benefits from repricing; active hedging and capital recycling are therefore essential risk‑management and value‑capture tools.
GDP growth and occupier demand
Office, retail and industrial absorption closely follow macro growth and employment—IMF projected global growth near 3.0%–3.3% for 2024–25, supporting leasing in major markets. New-economy uses and data centre demand have outpaced legacy segments, with hyperscale take-up tightening vacancy in key APAC hubs. Slowing growth compresses rent reversion and boosts landlord concessions, so market selection and sector rotation sustain NOI.
FX volatility and earnings translation
CapitaLand Investment faces translation and transaction risk from multi-currency revenues and costs across USD, SGD, CNY and INR, which can compress fee income and distributions when major currencies move against reporting currency. Hedging programs and local-currency financing are deployed to dampen portfolio volatility and protect distributions. Fund mandates often prefer currency-matched assets to reduce FX mismatch.
Inflation and operating expenses
Utility, labor, and maintenance inflation compress CapitaLand Investment property margins as rising input costs erode operating income; CPI-linked lease escalations in many commercial and logistics contracts provide partial offset where clauses exist.
Scale procurement and energy-efficiency retrofits have demonstrably reduced opex in CLI portfolios, while transparent cost pass-through mechanisms strengthen NOI resilience during inflationary periods.
- Utility and labor inflation squeeze margins
- CPI-linked escalations partially offset costs
- Energy efficiency and procurement scale lower opex
- Transparent pass-throughs bolster NOI resilience
Capital market liquidity
Capital market liquidity shapes CLI exits: tight windows lengthen holds and raise target returns, while active IPO/REIT markets and deep secondaries enable faster monetisation; CLI reported AUM ~SGD 150bn (2024) and benefits when REIT issuance and secondary depth recover.
- Fundraising cycles: variable; dry powder ~USD 430bn (2024)
- IPO/REIT windows: dictate timing
- Strong track records attract institutional capital
- Co-invests/club deals bridge gaps
Asia policy shocks, trade frictions lift risk premia; S$120bn AUM under scrutiny
Higher global rates (Fed 5.25–5.50%, 10y ~4.3% mid‑2025) raise financing costs, cap‑rate pressure and NAV markdowns; IMF global growth ~3.1% (2024–25) supports selective leasing while slowing demand raises concessions. CLI AUM ~SGD150bn (2024) and dry powder ~USD430bn (2024) drive deal pacing; FX, utility and labor inflation remain core margin risks mitigated by hedging and efficiency.
| Metric | Value | Implication |
|---|---|---|
| Fed funds | 5.25–5.50% | Higher borrowing costs |
| 10‑yr US | ~4.3% | Cap‑rate pressure |
| Global growth | ~3.1% | Leasing support |
| CLI AUM | ~SGD150bn | Scale advantage |
| Dry powder | ~USD430bn | Deal flexibility |
Preview the Actual Deliverable
CapitaLand Investment PESTLE Analysis
This CapitaLand Investment PESTLE analysis provides a concise assessment of political, economic, social, technological, legal and environmental factors affecting the company. The preview shown here is the exact document you’ll receive after purchase—fully formatted and ready to use. No placeholders or teasers; the layout and content visible are the final file delivered immediately after payment.











