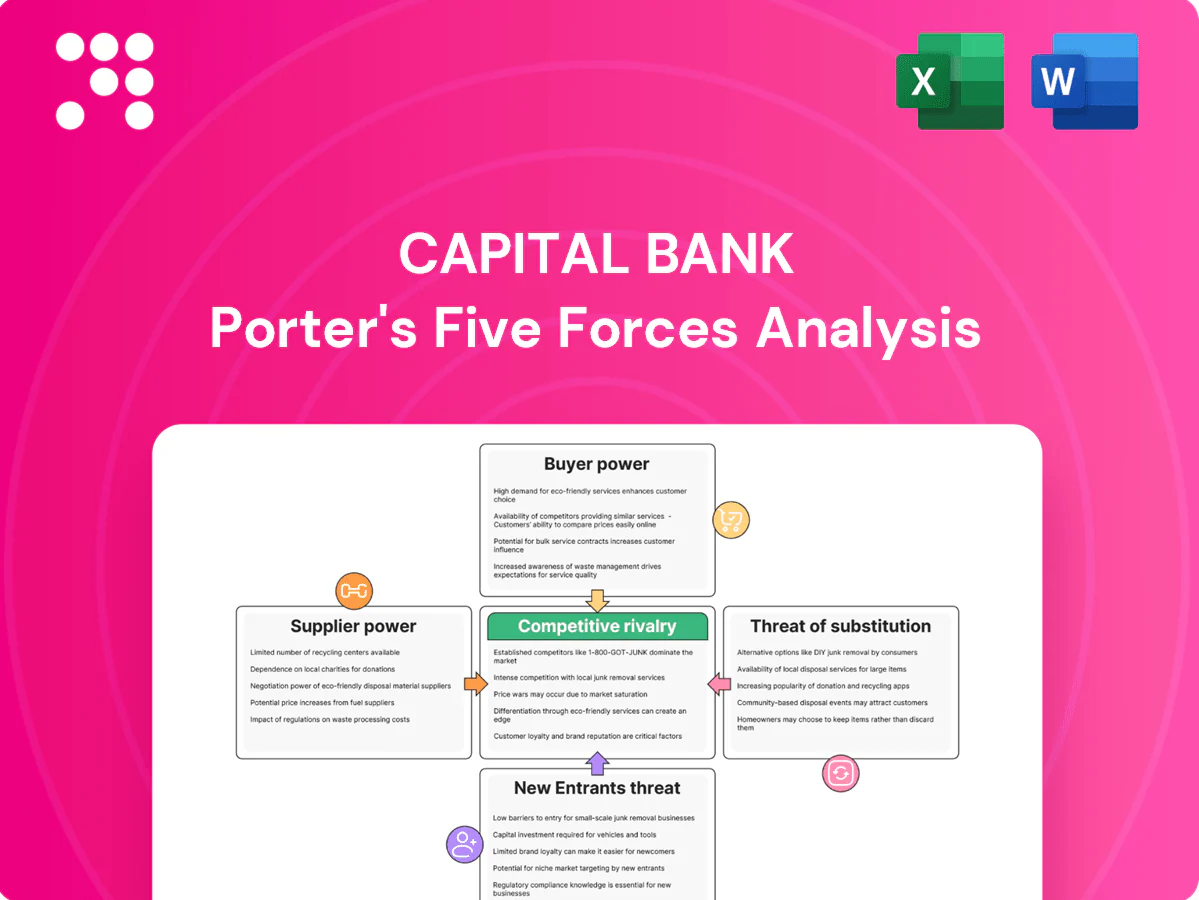
Capital Bank Porter's Five Forces Analysis

Don't Miss the Bigger Picture
Capital Bank faces nuanced competitive pressures—from moderate buyer bargaining to emerging fintech substitutes—that shape profitability and strategic choices. This brief overview surfaces key risks and advantages but only scratches the surface of market structure, supplier dynamics, and regulatory impacts. Unlock the full Porter's Five Forces Analysis for force-by-force ratings, visuals, and actionable insights to guide investment or strategic decisions.
Suppliers Bargaining Power

Dependence on core deposits
Depositors are the bank’s primary funding suppliers and can push rate expectations higher; with the federal funds rate at 5.25–5.50% through much of 2024, depositor yield demands materially raised funding costs. During tight liquidity cycles, customers demanded higher yields, and concentration in large accounts amplifies this leverage over banks. A diversified, sticky retail deposit base reduces supplier power and stabilizes funding.
Wholesale funding optionality
Access to FHLB lines, brokered certificates of deposit, and interbank markets gives Capital Bank funding flexibility but at market-driven rates and terms. In stress episodes 2023–24, spreads on wholesale paper widened and FHLB covenants tightened, increasing supplier leverage. Heavy reliance on short-term wholesale funding raises rollover risk; a balanced tenor mix reduces that supplier power.

Concentrated tech vendors
Core banking platforms, payment processors and cloud providers are highly concentrated: AWS (32.5%), Azure (23.6%), GCP (11.2%) in global cloud share (2024) and Visa+Mastercard ~80% of card network volume, giving vendors strong pricing and contractual leverage. High switching costs and integration risk create durable stickiness; bundled services deepen lock-in. Robust vendor management and multi-vendor strategies reduce supplier power and operational concentration risk.

Regulatory “license” as constraint
Regulators effectively supply Capital Bank’s license to operate, enforcing capital and liquidity standards (LCR ≥100% and many supervisors targeting CET1 >10% in 2024) that constrain balance-sheet flexibility. Compliance demands—banks allocating over 5% of operating expenses to compliance in 2024—raise costs and limit strategic maneuvering. During examinations remediation priorities can crowd out discretionary initiatives, while a strong compliance culture reduces adverse leverage and supervisory penalties.
- Regulatory control: license to operate
- Capital/LCR: binding constraints (LCR ≥100%)
- Compliance cost: >5% OPEX (2024)
- Exams: remediation crowds out strategy
- Compliance culture: lowers adverse leverage
Specialized talent supply
- 3.4M cyber workforce gap (ISC2 2023)
- Wage inflation raises hiring costs
- Local pools dictate branch staffing
- Training/retention lower supplier power
Fed funds 5.25-5.50%, vendor concentration & talent gap squeeze liquidity
Depositors and wholesale funders tightened funding costs (fed funds 5.25–5.50% in 2024), while wholesale spread spikes in 2023–24 raised rollover risk. Concentrated tech/payment vendors (AWS 32.5%, Visa+Mastercard ~80%) and scarce talent (ISC2 3.4M gap) increase supplier leverage. Regulatory constraints (LCR ≥100%, compliance >5% OPEX) further limit flexibility.
| Metric | 2024 |
|---|---|
| Fed funds | 5.25–5.50% |
| AWS share | 32.5% |
| Visa+MC | ~80% |
| Cyber gap | 3.4M |
| LCR | ≥100% |
What is included in the product
 Detailed Word Document
Concise Porter’s Five Forces analysis tailored to Capital Bank, detailing rivalry, buyer/supplier power, threat of entrants and substitutes, plus emerging disruptors and strategic implications for pricing and market positioning.

 Customizable Excel Spreadsheet
One-sheet Porter's Five Forces for Capital Bank simplifies competitive dynamics into an actionable snapshot, speeding executive decisions. Customizable pressure levels and clean visuals make it easy to drop into decks or dashboards for immediate strategic clarity.
Customers Bargaining Power

Rate-sensitive customers
Retail and SMB clients increasingly shop rates across banks and fintechs, with 2024 surveys showing about 60% of consumers using rate-comparison or aggregator tools to check deposits and lending options. Aggregators and mobile apps raise transparency and boost negotiating power by shortening search times and highlighting better offers. Corporate clients still secure bespoke pricing through volume, covenants and RFPs, often extracting spreads below standard retail margins. Relationship bundling (cash management, trade, advisory) can offset pure price sensitivity and retain balances.
Low switching costs
Digital account opening and payments portability have lowered switching friction—over 50% of customers used mobile banking by 2024—making rapid moves between banks feasible. Treasury management and merchant services add stickiness through cash-flow integrations, but these services remain replicateable by competitors. Multi-banking practices (around 40% of SMEs in 2024) enable customers to arbitrage offers. Superior UX and service further deepen lock-in.

Product commoditization
Checking, savings, CDs and standard loans are highly standardized; in 2024 the national average checking APY remained near 0.01% while average savings APY hovered around 0.40%, driving customers to choose on price and convenience.
Minimal product differentiation makes fee waivers and incentives common—most banks routinely waive monthly fees for balances or direct deposit—intensifying buyer bargaining power.
Offering advisory services and industry-specific lending solutions demonstrably reduces churn and buyer leverage by shifting competition from price to relationship-based value.

Corporate concentration
- Concentration risk
- Bespoke covenants
- Mandate competition
- Diversification mitigates
Service quality expectations
Customers now demand 24/7 digital access, instant payments, and rapid credit decisions; service lapses drive churn and amplified negative reviews, with digital-first customers representing over 60% of account activity in 2024. SLAs and dedicated support teams are table stakes, while continuous UX upgrades (quarterly releases) are critical to curb defections and protect NPS and deposit balances.
- 24/7 access
- Instant payments
- SLA + support teams
- Quarterly UX upgrades
Customers Drive Price Pressure: Aggregators, Mobile Banking and Low APYs Fuel Rapid Switching
Customers wield high price-driven bargaining power: ~60% used rate-comparison tools in 2024 and mobile banking adoption reached ~50%, enabling rapid switching. Corporate clients extract bespoke pricing (mandates pressured spreads ~30 bps in 2024) but relationship bundling and advisory reduce churn. Standardized retail products (checking APY ~0.01%, savings APY ~0.40% in 2024) amplify fee/incentive sensitivity.
| Metric | 2024 |
|---|---|
| Consumers using aggregators | ~60% |
| Mobile banking users | ~50% |
| SMEs multi-banking | ~40% |
| Checking APY | ~0.01% |
| Savings APY | ~0.40% |
| Corporate spread pressure | ~30 bps |
What You See Is What You Get
Capital Bank Porter's Five Forces Analysis
This preview shows the exact Capital Bank Porter's Five Forces Analysis you'll receive immediately after purchase—no placeholders or mockups. The file is fully formatted and ready for download and use the moment you buy. You’re viewing the final, deliverable document in its entirety.

Don't Miss the Bigger Picture
Capital Bank faces nuanced competitive pressures—from moderate buyer bargaining to emerging fintech substitutes—that shape profitability and strategic choices. This brief overview surfaces key risks and advantages but only scratches the surface of market structure, supplier dynamics, and regulatory impacts. Unlock the full Porter's Five Forces Analysis for force-by-force ratings, visuals, and actionable insights to guide investment or strategic decisions.
Suppliers Bargaining Power
Dependence on core deposits
Depositors are the bank’s primary funding suppliers and can push rate expectations higher; with the federal funds rate at 5.25–5.50% through much of 2024, depositor yield demands materially raised funding costs. During tight liquidity cycles, customers demanded higher yields, and concentration in large accounts amplifies this leverage over banks. A diversified, sticky retail deposit base reduces supplier power and stabilizes funding.
Wholesale funding optionality
Access to FHLB lines, brokered certificates of deposit, and interbank markets gives Capital Bank funding flexibility but at market-driven rates and terms. In stress episodes 2023–24, spreads on wholesale paper widened and FHLB covenants tightened, increasing supplier leverage. Heavy reliance on short-term wholesale funding raises rollover risk; a balanced tenor mix reduces that supplier power.
Concentrated tech vendors
Core banking platforms, payment processors and cloud providers are highly concentrated: AWS (32.5%), Azure (23.6%), GCP (11.2%) in global cloud share (2024) and Visa+Mastercard ~80% of card network volume, giving vendors strong pricing and contractual leverage. High switching costs and integration risk create durable stickiness; bundled services deepen lock-in. Robust vendor management and multi-vendor strategies reduce supplier power and operational concentration risk.
Regulatory “license” as constraint
Regulators effectively supply Capital Bank’s license to operate, enforcing capital and liquidity standards (LCR ≥100% and many supervisors targeting CET1 >10% in 2024) that constrain balance-sheet flexibility. Compliance demands—banks allocating over 5% of operating expenses to compliance in 2024—raise costs and limit strategic maneuvering. During examinations remediation priorities can crowd out discretionary initiatives, while a strong compliance culture reduces adverse leverage and supervisory penalties.
- Regulatory control: license to operate
- Capital/LCR: binding constraints (LCR ≥100%)
- Compliance cost: >5% OPEX (2024)
- Exams: remediation crowds out strategy
- Compliance culture: lowers adverse leverage
Specialized talent supply
- 3.4M cyber workforce gap (ISC2 2023)
- Wage inflation raises hiring costs
- Local pools dictate branch staffing
- Training/retention lower supplier power
Fed funds 5.25-5.50%, vendor concentration & talent gap squeeze liquidity
Depositors and wholesale funders tightened funding costs (fed funds 5.25–5.50% in 2024), while wholesale spread spikes in 2023–24 raised rollover risk. Concentrated tech/payment vendors (AWS 32.5%, Visa+Mastercard ~80%) and scarce talent (ISC2 3.4M gap) increase supplier leverage. Regulatory constraints (LCR ≥100%, compliance >5% OPEX) further limit flexibility.
| Metric | 2024 |
|---|---|
| Fed funds | 5.25–5.50% |
| AWS share | 32.5% |
| Visa+MC | ~80% |
| Cyber gap | 3.4M |
| LCR | ≥100% |
What is included in the product
Detailed Word Document
Concise Porter’s Five Forces analysis tailored to Capital Bank, detailing rivalry, buyer/supplier power, threat of entrants and substitutes, plus emerging disruptors and strategic implications for pricing and market positioning.
Customizable Excel Spreadsheet
One-sheet Porter's Five Forces for Capital Bank simplifies competitive dynamics into an actionable snapshot, speeding executive decisions. Customizable pressure levels and clean visuals make it easy to drop into decks or dashboards for immediate strategic clarity.
Customers Bargaining Power
Rate-sensitive customers
Retail and SMB clients increasingly shop rates across banks and fintechs, with 2024 surveys showing about 60% of consumers using rate-comparison or aggregator tools to check deposits and lending options. Aggregators and mobile apps raise transparency and boost negotiating power by shortening search times and highlighting better offers. Corporate clients still secure bespoke pricing through volume, covenants and RFPs, often extracting spreads below standard retail margins. Relationship bundling (cash management, trade, advisory) can offset pure price sensitivity and retain balances.
Low switching costs
Digital account opening and payments portability have lowered switching friction—over 50% of customers used mobile banking by 2024—making rapid moves between banks feasible. Treasury management and merchant services add stickiness through cash-flow integrations, but these services remain replicateable by competitors. Multi-banking practices (around 40% of SMEs in 2024) enable customers to arbitrage offers. Superior UX and service further deepen lock-in.
Product commoditization
Checking, savings, CDs and standard loans are highly standardized; in 2024 the national average checking APY remained near 0.01% while average savings APY hovered around 0.40%, driving customers to choose on price and convenience.
Minimal product differentiation makes fee waivers and incentives common—most banks routinely waive monthly fees for balances or direct deposit—intensifying buyer bargaining power.
Offering advisory services and industry-specific lending solutions demonstrably reduces churn and buyer leverage by shifting competition from price to relationship-based value.
Corporate concentration
- Concentration risk
- Bespoke covenants
- Mandate competition
- Diversification mitigates
Service quality expectations
Customers now demand 24/7 digital access, instant payments, and rapid credit decisions; service lapses drive churn and amplified negative reviews, with digital-first customers representing over 60% of account activity in 2024. SLAs and dedicated support teams are table stakes, while continuous UX upgrades (quarterly releases) are critical to curb defections and protect NPS and deposit balances.
- 24/7 access
- Instant payments
- SLA + support teams
- Quarterly UX upgrades
Customers Drive Price Pressure: Aggregators, Mobile Banking and Low APYs Fuel Rapid Switching
Customers wield high price-driven bargaining power: ~60% used rate-comparison tools in 2024 and mobile banking adoption reached ~50%, enabling rapid switching. Corporate clients extract bespoke pricing (mandates pressured spreads ~30 bps in 2024) but relationship bundling and advisory reduce churn. Standardized retail products (checking APY ~0.01%, savings APY ~0.40% in 2024) amplify fee/incentive sensitivity.
| Metric | 2024 |
|---|---|
| Consumers using aggregators | ~60% |
| Mobile banking users | ~50% |
| SMEs multi-banking | ~40% |
| Checking APY | ~0.01% |
| Savings APY | ~0.40% |
| Corporate spread pressure | ~30 bps |
What You See Is What You Get
Capital Bank Porter's Five Forces Analysis
This preview shows the exact Capital Bank Porter's Five Forces Analysis you'll receive immediately after purchase—no placeholders or mockups. The file is fully formatted and ready for download and use the moment you buy. You’re viewing the final, deliverable document in its entirety.
Description
Don't Miss the Bigger Picture
Capital Bank faces nuanced competitive pressures—from moderate buyer bargaining to emerging fintech substitutes—that shape profitability and strategic choices. This brief overview surfaces key risks and advantages but only scratches the surface of market structure, supplier dynamics, and regulatory impacts. Unlock the full Porter's Five Forces Analysis for force-by-force ratings, visuals, and actionable insights to guide investment or strategic decisions.
Suppliers Bargaining Power
Dependence on core deposits
Depositors are the bank’s primary funding suppliers and can push rate expectations higher; with the federal funds rate at 5.25–5.50% through much of 2024, depositor yield demands materially raised funding costs. During tight liquidity cycles, customers demanded higher yields, and concentration in large accounts amplifies this leverage over banks. A diversified, sticky retail deposit base reduces supplier power and stabilizes funding.
Wholesale funding optionality
Access to FHLB lines, brokered certificates of deposit, and interbank markets gives Capital Bank funding flexibility but at market-driven rates and terms. In stress episodes 2023–24, spreads on wholesale paper widened and FHLB covenants tightened, increasing supplier leverage. Heavy reliance on short-term wholesale funding raises rollover risk; a balanced tenor mix reduces that supplier power.
Concentrated tech vendors
Core banking platforms, payment processors and cloud providers are highly concentrated: AWS (32.5%), Azure (23.6%), GCP (11.2%) in global cloud share (2024) and Visa+Mastercard ~80% of card network volume, giving vendors strong pricing and contractual leverage. High switching costs and integration risk create durable stickiness; bundled services deepen lock-in. Robust vendor management and multi-vendor strategies reduce supplier power and operational concentration risk.
Regulatory “license” as constraint
Regulators effectively supply Capital Bank’s license to operate, enforcing capital and liquidity standards (LCR ≥100% and many supervisors targeting CET1 >10% in 2024) that constrain balance-sheet flexibility. Compliance demands—banks allocating over 5% of operating expenses to compliance in 2024—raise costs and limit strategic maneuvering. During examinations remediation priorities can crowd out discretionary initiatives, while a strong compliance culture reduces adverse leverage and supervisory penalties.
- Regulatory control: license to operate
- Capital/LCR: binding constraints (LCR ≥100%)
- Compliance cost: >5% OPEX (2024)
- Exams: remediation crowds out strategy
- Compliance culture: lowers adverse leverage
Specialized talent supply
- 3.4M cyber workforce gap (ISC2 2023)
- Wage inflation raises hiring costs
- Local pools dictate branch staffing
- Training/retention lower supplier power
Fed funds 5.25-5.50%, vendor concentration & talent gap squeeze liquidity
Depositors and wholesale funders tightened funding costs (fed funds 5.25–5.50% in 2024), while wholesale spread spikes in 2023–24 raised rollover risk. Concentrated tech/payment vendors (AWS 32.5%, Visa+Mastercard ~80%) and scarce talent (ISC2 3.4M gap) increase supplier leverage. Regulatory constraints (LCR ≥100%, compliance >5% OPEX) further limit flexibility.
| Metric | 2024 |
|---|---|
| Fed funds | 5.25–5.50% |
| AWS share | 32.5% |
| Visa+MC | ~80% |
| Cyber gap | 3.4M |
| LCR | ≥100% |
What is included in the product
Detailed Word Document
Concise Porter’s Five Forces analysis tailored to Capital Bank, detailing rivalry, buyer/supplier power, threat of entrants and substitutes, plus emerging disruptors and strategic implications for pricing and market positioning.
Customizable Excel Spreadsheet
One-sheet Porter's Five Forces for Capital Bank simplifies competitive dynamics into an actionable snapshot, speeding executive decisions. Customizable pressure levels and clean visuals make it easy to drop into decks or dashboards for immediate strategic clarity.
Customers Bargaining Power
Rate-sensitive customers
Retail and SMB clients increasingly shop rates across banks and fintechs, with 2024 surveys showing about 60% of consumers using rate-comparison or aggregator tools to check deposits and lending options. Aggregators and mobile apps raise transparency and boost negotiating power by shortening search times and highlighting better offers. Corporate clients still secure bespoke pricing through volume, covenants and RFPs, often extracting spreads below standard retail margins. Relationship bundling (cash management, trade, advisory) can offset pure price sensitivity and retain balances.
Low switching costs
Digital account opening and payments portability have lowered switching friction—over 50% of customers used mobile banking by 2024—making rapid moves between banks feasible. Treasury management and merchant services add stickiness through cash-flow integrations, but these services remain replicateable by competitors. Multi-banking practices (around 40% of SMEs in 2024) enable customers to arbitrage offers. Superior UX and service further deepen lock-in.
Product commoditization
Checking, savings, CDs and standard loans are highly standardized; in 2024 the national average checking APY remained near 0.01% while average savings APY hovered around 0.40%, driving customers to choose on price and convenience.
Minimal product differentiation makes fee waivers and incentives common—most banks routinely waive monthly fees for balances or direct deposit—intensifying buyer bargaining power.
Offering advisory services and industry-specific lending solutions demonstrably reduces churn and buyer leverage by shifting competition from price to relationship-based value.
Corporate concentration
- Concentration risk
- Bespoke covenants
- Mandate competition
- Diversification mitigates
Service quality expectations
Customers now demand 24/7 digital access, instant payments, and rapid credit decisions; service lapses drive churn and amplified negative reviews, with digital-first customers representing over 60% of account activity in 2024. SLAs and dedicated support teams are table stakes, while continuous UX upgrades (quarterly releases) are critical to curb defections and protect NPS and deposit balances.
- 24/7 access
- Instant payments
- SLA + support teams
- Quarterly UX upgrades
Customers Drive Price Pressure: Aggregators, Mobile Banking and Low APYs Fuel Rapid Switching
Customers wield high price-driven bargaining power: ~60% used rate-comparison tools in 2024 and mobile banking adoption reached ~50%, enabling rapid switching. Corporate clients extract bespoke pricing (mandates pressured spreads ~30 bps in 2024) but relationship bundling and advisory reduce churn. Standardized retail products (checking APY ~0.01%, savings APY ~0.40% in 2024) amplify fee/incentive sensitivity.
| Metric | 2024 |
|---|---|
| Consumers using aggregators | ~60% |
| Mobile banking users | ~50% |
| SMEs multi-banking | ~40% |
| Checking APY | ~0.01% |
| Savings APY | ~0.40% |
| Corporate spread pressure | ~30 bps |
What You See Is What You Get
Capital Bank Porter's Five Forces Analysis
This preview shows the exact Capital Bank Porter's Five Forces Analysis you'll receive immediately after purchase—no placeholders or mockups. The file is fully formatted and ready for download and use the moment you buy. You’re viewing the final, deliverable document in its entirety.











