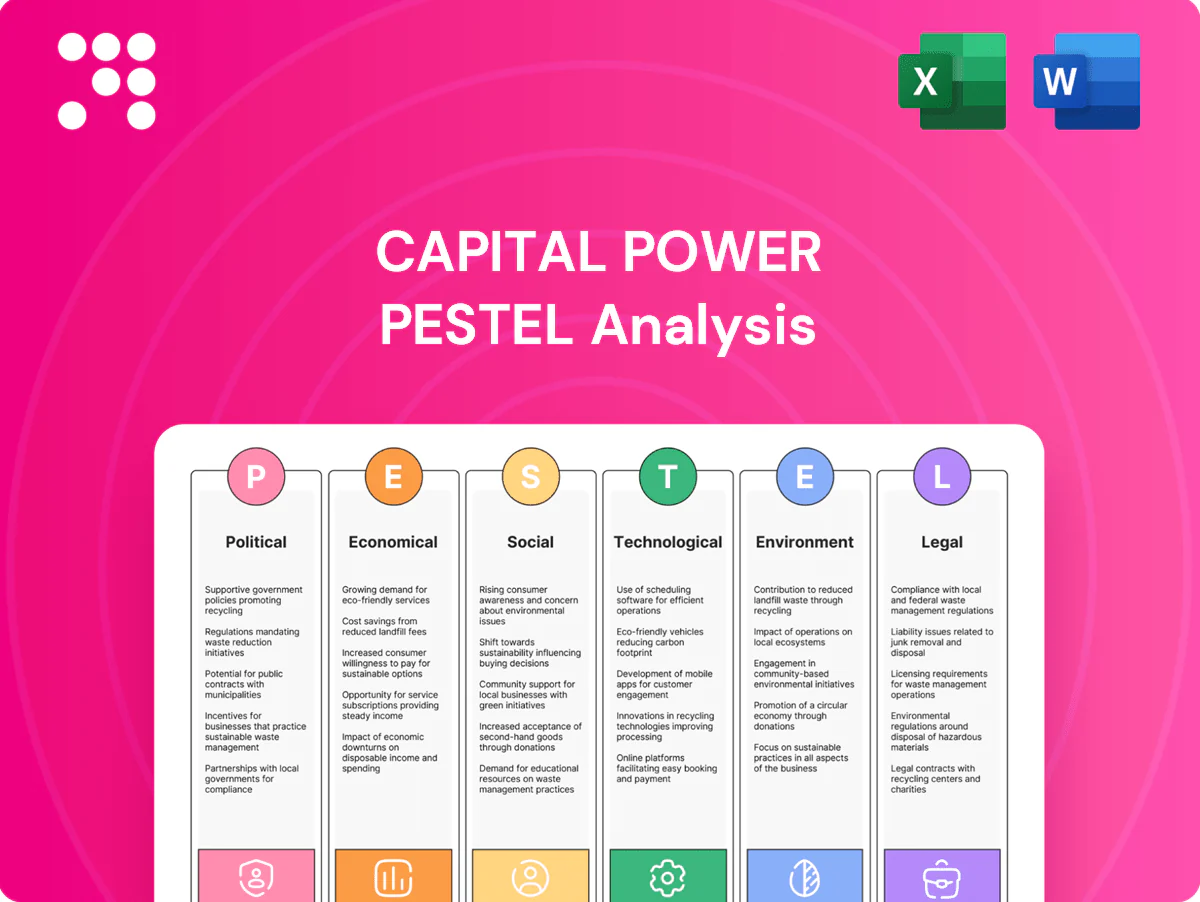
Capital Power PESTLE Analysis

Skip the Research. Get the Strategy.
Gain a strategic edge with our PESTLE Analysis of Capital Power, revealing how political, economic, social, technological, legal, and environmental forces will shape its outlook. Ideal for investors, advisors, and strategists, this concise briefing highlights risks and opportunities you can act on immediately. Purchase the full report for detailed, ready-to-use insights and downloadable templates.
Political factors

Cross-border energy policy alignment
Operating across U.S. and Canadian markets exposes Capital Power to shifting federal and provincial/state priorities. The U.S. Inflation Reduction Act mobilized about 369 billion USD for clean energy while Canada’s federal carbon price is on a path to 170 CAD/tonne by 2030; alignment of carbon policy, tax credits and reliability standards can accelerate or delay projects. Election cycles may alter support for gas, CCS and renewables, so active policy monitoring and advocacy are required to safeguard returns.
Provincial/state procurement and capacity mechanisms
Provincial/state market-design choices—for example Alberta launching a capacity market in 2023—and long‑term procurement programs materially increase revenue certainty for generators like Capital Power, whose fleet stood near 7,700 MW in 2024. Jurisdictions prioritizing reliability procurements tilt demand toward dispatchable gas and hydro, raising asset value. Movement away from regulated-style contracts increases merchant exposure and price volatility. Securing offtake via policy-driven auctions has become a strategic imperative.

Grid reliability and energy security priorities
Policymaker focus on resilience after extreme weather elevates capacity value for generators, with blackouts costing the global economy about $150 billion annually. Baseload and fast-ramping gas assets increasingly receive favorable recognition in resource planning and capacity auctions. Scrutiny on fuel security and winterization mandates can add capital and O&M costs, sometimes rising into the tens–hundreds of millions for large fleets. Positioning assets explicitly as reliability solutions mitigates political risk.

Public funding and incentives competition
Inflation Reduction Act–style credits and Canadian tax incentives are steering capital flows; the IRA included about 369 billion USD for clean energy provisions (2022 enactment), and DOE hydrogen hub funding programs mobilized roughly 7 billion USD, shifting where investors target projects. Access to grants for storage, hydrogen and CCS materially alters project IRRs, while competitive regions push bidding up and compress margins, making timely applications and partnership structuring decisive.
- IRA funding scale: 369 billion USD
- DOE hydrogen hubs: ~7 billion USD
- Fast applications and JV structuring mitigate margin erosion
Community and Indigenous engagement expectations
Political norms now mandate meaningful community and Indigenous consultation and benefit-sharing; Canada’s Impact Assessment Act (2019) and evolving federal guidance have strengthened this duty, making early engagement critical to expedite permitting and interconnection approvals and reduce risk of opposition and delays.
- Early engagement: speeds permitting
- Misalignment: triggers political opposition, delays
- Co-development: improves legitimacy, site access
IRA incentives and Canada carbon pricing reshape dispatchable asset economics and timelines
Operating in US/Canada ties Capital Power to IRA incentives (≈369 billion USD) and Canada’s carbon price path (170 CAD/tonne by 2030), affecting IRRs and timelines. Capacity markets and procurements (Alberta capacity market launched 2023) boost dispatchable asset value, while resilience mandates and Indigenous consultation raise capex and permitting lead times.
| Metric | Value |
|---|---|
| IRA funding | ≈369 billion USD |
| Canada carbon price | 170 CAD/tonne by 2030 |
| Capital Power fleet | ≈7,700 MW (2024) |
| DOE hydrogen hubs | ≈7 billion USD |
What is included in the product
 Detailed Word Document
Explores how macro-environmental factors uniquely affect Capital Power across Political, Economic, Social, Technological, Environmental and Legal dimensions, with data-backed trends and region-specific regulatory context. Designed for executives and investors, it highlights risks, opportunities and forward-looking scenarios for strategy and funding decisions.

 Customizable Excel Spreadsheet
A concise, presentation-ready PESTLE summary for Capital Power that’s visually segmented by category, easily editable for regional or business-line notes, and shareable across teams to streamline risk discussions and strategic planning.
Economic factors

Power price volatility and merchant exposure
Wholesale price swings materially drive earnings for Capital Power's uncontracted assets, with merchant volatility evident as regional real-time prices swung >50% year-over-year in several North American hubs. Gas dynamics — Henry Hub ~3–4 USD/MMBtu in H1 2024 — plus load growth and rising renewables (wind+solar ~21% of U.S. generation in 2023) compress or widen spark spreads. Hedging strategy and contract tenor balance upside versus downside risk, while node and fuel diversification across Alberta, MISO and other markets reduces portfolio variance.
Interest rates and capital intensity
Rising global rates (Fed funds ~5.25–5.50% mid‑2025; Canada 10‑yr ~3.6%) pressure project NPVs and have pushed utility WACCs roughly 200 basis points versus 2021, heightening capital costs for Capital Power’s build/own/operate model and demanding disciplined leverage. Tight tax‑equity and project‑finance markets continue to pace pipeline execution, so prioritizing incentive‑rich, fully contracted projects preserves returns.

Capacity value of dispatchable generation
With variable renewables supplying about 30% of global electricity in 2023 (IEA), capacity payments and scarcity pricing have surged in importance, with Alberta’s energy-only market showing price spikes up to several thousand dollars per MWh at tight supply. Gas-fired and storage assets can capture flexibility premiums—battery pack costs fell roughly 89% since 2010 to about $125/kWh in 2023 (BNEF), improving returns. Reliability adders and capacity credits raise project NPV versus pure energy-only revenue, and investment in fast-start gas units or flexible storage supports outsized peak-period earnings.

Input fuel and carbon cost pass-through
Input fuel and carbon cost pass-through materially alters Capital Power margins: natural gas price volatility (sharp swings in 2022–23) and carbon costs drive merchant and contracted plant economics, while long-term fuel supply and basis hedges stabilize cash flows. Canada’s federal carbon price is scheduled to reach CAD 170/tonne by 2030, making carbon recovery in PPAs and market structures critical. Efficiency upgrades reduce variable costs and carbon exposure, improving margin resilience.
- Gas volatility: hedges stabilize revenue
- Carbon: CAD 170/t by 2030 impacts recovery
- PPAs: pass-through depends on contract/market
- Efficiency: lowers variable cost and exposure
Supply chain and equipment inflation
Turbines, transformers and panels face cost and lead-time pressure: turbine lead times rose to roughly 12–24 months, transformer delivery 6–12 months and module prices averaged about 0.20–0.30 USD/W in 2024, squeezing project margins and capex timing for Capital Power.
Geopolitics and tariffs have shifted procurement windows; multi-sourcing and framework agreements protect schedules, while inventory planning limits outage risk and delay penalties.
- Lead times: turbines 12–24m, transformers 6–12m
- Module prices: ≈0.20–0.30 USD/W (2024)
- Mitigation: multi-sourcing, framework contracts, strategic inventory
IRA incentives and Canada carbon pricing reshape dispatchable asset economics and timelines
Wholesale price swings, gas price moves (Henry Hub ~3–4 USD/MMBtu H1 2024) and carbon policy (Canada CAD 170/t by 2030) drive earnings volatility; hedging and contract tenor mitigate merchant risk. Higher rates (Fed funds ~5.25–5.50% mid‑2025) raise WACC and capex costs, stressing disciplined leverage. Lead times and equipment prices (modules ~0.20–0.30 USD/W in 2024) compress project margins.
| Metric | Value |
|---|---|
| Henry Hub | 3–4 USD/MMBtu (H1 2024) |
| Fed funds | 5.25–5.50% (mid‑2025) |
| Carbon | CAD 170/t by 2030 |
| Module price | 0.20–0.30 USD/W (2024) |
What You See Is What You Get
Capital Power PESTLE Analysis
The Capital Power PESTLE Analysis preview shown here is the exact document you’ll receive after purchase—fully formatted and ready to use. It provides a structured review of political, economic, social, technological, legal, and environmental factors affecting Capital Power. No placeholders or surprises—download the final file immediately after checkout.

Skip the Research. Get the Strategy.
Gain a strategic edge with our PESTLE Analysis of Capital Power, revealing how political, economic, social, technological, legal, and environmental forces will shape its outlook. Ideal for investors, advisors, and strategists, this concise briefing highlights risks and opportunities you can act on immediately. Purchase the full report for detailed, ready-to-use insights and downloadable templates.
Political factors
Cross-border energy policy alignment
Operating across U.S. and Canadian markets exposes Capital Power to shifting federal and provincial/state priorities. The U.S. Inflation Reduction Act mobilized about 369 billion USD for clean energy while Canada’s federal carbon price is on a path to 170 CAD/tonne by 2030; alignment of carbon policy, tax credits and reliability standards can accelerate or delay projects. Election cycles may alter support for gas, CCS and renewables, so active policy monitoring and advocacy are required to safeguard returns.
Provincial/state procurement and capacity mechanisms
Provincial/state market-design choices—for example Alberta launching a capacity market in 2023—and long‑term procurement programs materially increase revenue certainty for generators like Capital Power, whose fleet stood near 7,700 MW in 2024. Jurisdictions prioritizing reliability procurements tilt demand toward dispatchable gas and hydro, raising asset value. Movement away from regulated-style contracts increases merchant exposure and price volatility. Securing offtake via policy-driven auctions has become a strategic imperative.
Grid reliability and energy security priorities
Policymaker focus on resilience after extreme weather elevates capacity value for generators, with blackouts costing the global economy about $150 billion annually. Baseload and fast-ramping gas assets increasingly receive favorable recognition in resource planning and capacity auctions. Scrutiny on fuel security and winterization mandates can add capital and O&M costs, sometimes rising into the tens–hundreds of millions for large fleets. Positioning assets explicitly as reliability solutions mitigates political risk.
Public funding and incentives competition
Inflation Reduction Act–style credits and Canadian tax incentives are steering capital flows; the IRA included about 369 billion USD for clean energy provisions (2022 enactment), and DOE hydrogen hub funding programs mobilized roughly 7 billion USD, shifting where investors target projects. Access to grants for storage, hydrogen and CCS materially alters project IRRs, while competitive regions push bidding up and compress margins, making timely applications and partnership structuring decisive.
- IRA funding scale: 369 billion USD
- DOE hydrogen hubs: ~7 billion USD
- Fast applications and JV structuring mitigate margin erosion
Community and Indigenous engagement expectations
Political norms now mandate meaningful community and Indigenous consultation and benefit-sharing; Canada’s Impact Assessment Act (2019) and evolving federal guidance have strengthened this duty, making early engagement critical to expedite permitting and interconnection approvals and reduce risk of opposition and delays.
- Early engagement: speeds permitting
- Misalignment: triggers political opposition, delays
- Co-development: improves legitimacy, site access
IRA incentives and Canada carbon pricing reshape dispatchable asset economics and timelines
Operating in US/Canada ties Capital Power to IRA incentives (≈369 billion USD) and Canada’s carbon price path (170 CAD/tonne by 2030), affecting IRRs and timelines. Capacity markets and procurements (Alberta capacity market launched 2023) boost dispatchable asset value, while resilience mandates and Indigenous consultation raise capex and permitting lead times.
| Metric | Value |
|---|---|
| IRA funding | ≈369 billion USD |
| Canada carbon price | 170 CAD/tonne by 2030 |
| Capital Power fleet | ≈7,700 MW (2024) |
| DOE hydrogen hubs | ≈7 billion USD |
What is included in the product
Detailed Word Document
Explores how macro-environmental factors uniquely affect Capital Power across Political, Economic, Social, Technological, Environmental and Legal dimensions, with data-backed trends and region-specific regulatory context. Designed for executives and investors, it highlights risks, opportunities and forward-looking scenarios for strategy and funding decisions.
Customizable Excel Spreadsheet
A concise, presentation-ready PESTLE summary for Capital Power that’s visually segmented by category, easily editable for regional or business-line notes, and shareable across teams to streamline risk discussions and strategic planning.
Economic factors
Power price volatility and merchant exposure
Wholesale price swings materially drive earnings for Capital Power's uncontracted assets, with merchant volatility evident as regional real-time prices swung >50% year-over-year in several North American hubs. Gas dynamics — Henry Hub ~3–4 USD/MMBtu in H1 2024 — plus load growth and rising renewables (wind+solar ~21% of U.S. generation in 2023) compress or widen spark spreads. Hedging strategy and contract tenor balance upside versus downside risk, while node and fuel diversification across Alberta, MISO and other markets reduces portfolio variance.
Interest rates and capital intensity
Rising global rates (Fed funds ~5.25–5.50% mid‑2025; Canada 10‑yr ~3.6%) pressure project NPVs and have pushed utility WACCs roughly 200 basis points versus 2021, heightening capital costs for Capital Power’s build/own/operate model and demanding disciplined leverage. Tight tax‑equity and project‑finance markets continue to pace pipeline execution, so prioritizing incentive‑rich, fully contracted projects preserves returns.
Capacity value of dispatchable generation
With variable renewables supplying about 30% of global electricity in 2023 (IEA), capacity payments and scarcity pricing have surged in importance, with Alberta’s energy-only market showing price spikes up to several thousand dollars per MWh at tight supply. Gas-fired and storage assets can capture flexibility premiums—battery pack costs fell roughly 89% since 2010 to about $125/kWh in 2023 (BNEF), improving returns. Reliability adders and capacity credits raise project NPV versus pure energy-only revenue, and investment in fast-start gas units or flexible storage supports outsized peak-period earnings.
Input fuel and carbon cost pass-through
Input fuel and carbon cost pass-through materially alters Capital Power margins: natural gas price volatility (sharp swings in 2022–23) and carbon costs drive merchant and contracted plant economics, while long-term fuel supply and basis hedges stabilize cash flows. Canada’s federal carbon price is scheduled to reach CAD 170/tonne by 2030, making carbon recovery in PPAs and market structures critical. Efficiency upgrades reduce variable costs and carbon exposure, improving margin resilience.
- Gas volatility: hedges stabilize revenue
- Carbon: CAD 170/t by 2030 impacts recovery
- PPAs: pass-through depends on contract/market
- Efficiency: lowers variable cost and exposure
Supply chain and equipment inflation
Turbines, transformers and panels face cost and lead-time pressure: turbine lead times rose to roughly 12–24 months, transformer delivery 6–12 months and module prices averaged about 0.20–0.30 USD/W in 2024, squeezing project margins and capex timing for Capital Power.
Geopolitics and tariffs have shifted procurement windows; multi-sourcing and framework agreements protect schedules, while inventory planning limits outage risk and delay penalties.
- Lead times: turbines 12–24m, transformers 6–12m
- Module prices: ≈0.20–0.30 USD/W (2024)
- Mitigation: multi-sourcing, framework contracts, strategic inventory
IRA incentives and Canada carbon pricing reshape dispatchable asset economics and timelines
Wholesale price swings, gas price moves (Henry Hub ~3–4 USD/MMBtu H1 2024) and carbon policy (Canada CAD 170/t by 2030) drive earnings volatility; hedging and contract tenor mitigate merchant risk. Higher rates (Fed funds ~5.25–5.50% mid‑2025) raise WACC and capex costs, stressing disciplined leverage. Lead times and equipment prices (modules ~0.20–0.30 USD/W in 2024) compress project margins.
| Metric | Value |
|---|---|
| Henry Hub | 3–4 USD/MMBtu (H1 2024) |
| Fed funds | 5.25–5.50% (mid‑2025) |
| Carbon | CAD 170/t by 2030 |
| Module price | 0.20–0.30 USD/W (2024) |
What You See Is What You Get
Capital Power PESTLE Analysis
The Capital Power PESTLE Analysis preview shown here is the exact document you’ll receive after purchase—fully formatted and ready to use. It provides a structured review of political, economic, social, technological, legal, and environmental factors affecting Capital Power. No placeholders or surprises—download the final file immediately after checkout.
Original: $10.00
-65%$10.00
$3.50Description
Skip the Research. Get the Strategy.
Gain a strategic edge with our PESTLE Analysis of Capital Power, revealing how political, economic, social, technological, legal, and environmental forces will shape its outlook. Ideal for investors, advisors, and strategists, this concise briefing highlights risks and opportunities you can act on immediately. Purchase the full report for detailed, ready-to-use insights and downloadable templates.
Political factors
Cross-border energy policy alignment
Operating across U.S. and Canadian markets exposes Capital Power to shifting federal and provincial/state priorities. The U.S. Inflation Reduction Act mobilized about 369 billion USD for clean energy while Canada’s federal carbon price is on a path to 170 CAD/tonne by 2030; alignment of carbon policy, tax credits and reliability standards can accelerate or delay projects. Election cycles may alter support for gas, CCS and renewables, so active policy monitoring and advocacy are required to safeguard returns.
Provincial/state procurement and capacity mechanisms
Provincial/state market-design choices—for example Alberta launching a capacity market in 2023—and long‑term procurement programs materially increase revenue certainty for generators like Capital Power, whose fleet stood near 7,700 MW in 2024. Jurisdictions prioritizing reliability procurements tilt demand toward dispatchable gas and hydro, raising asset value. Movement away from regulated-style contracts increases merchant exposure and price volatility. Securing offtake via policy-driven auctions has become a strategic imperative.
Grid reliability and energy security priorities
Policymaker focus on resilience after extreme weather elevates capacity value for generators, with blackouts costing the global economy about $150 billion annually. Baseload and fast-ramping gas assets increasingly receive favorable recognition in resource planning and capacity auctions. Scrutiny on fuel security and winterization mandates can add capital and O&M costs, sometimes rising into the tens–hundreds of millions for large fleets. Positioning assets explicitly as reliability solutions mitigates political risk.
Public funding and incentives competition
Inflation Reduction Act–style credits and Canadian tax incentives are steering capital flows; the IRA included about 369 billion USD for clean energy provisions (2022 enactment), and DOE hydrogen hub funding programs mobilized roughly 7 billion USD, shifting where investors target projects. Access to grants for storage, hydrogen and CCS materially alters project IRRs, while competitive regions push bidding up and compress margins, making timely applications and partnership structuring decisive.
- IRA funding scale: 369 billion USD
- DOE hydrogen hubs: ~7 billion USD
- Fast applications and JV structuring mitigate margin erosion
Community and Indigenous engagement expectations
Political norms now mandate meaningful community and Indigenous consultation and benefit-sharing; Canada’s Impact Assessment Act (2019) and evolving federal guidance have strengthened this duty, making early engagement critical to expedite permitting and interconnection approvals and reduce risk of opposition and delays.
- Early engagement: speeds permitting
- Misalignment: triggers political opposition, delays
- Co-development: improves legitimacy, site access
IRA incentives and Canada carbon pricing reshape dispatchable asset economics and timelines
Operating in US/Canada ties Capital Power to IRA incentives (≈369 billion USD) and Canada’s carbon price path (170 CAD/tonne by 2030), affecting IRRs and timelines. Capacity markets and procurements (Alberta capacity market launched 2023) boost dispatchable asset value, while resilience mandates and Indigenous consultation raise capex and permitting lead times.
| Metric | Value |
|---|---|
| IRA funding | ≈369 billion USD |
| Canada carbon price | 170 CAD/tonne by 2030 |
| Capital Power fleet | ≈7,700 MW (2024) |
| DOE hydrogen hubs | ≈7 billion USD |
What is included in the product
Detailed Word Document
Explores how macro-environmental factors uniquely affect Capital Power across Political, Economic, Social, Technological, Environmental and Legal dimensions, with data-backed trends and region-specific regulatory context. Designed for executives and investors, it highlights risks, opportunities and forward-looking scenarios for strategy and funding decisions.
Customizable Excel Spreadsheet
A concise, presentation-ready PESTLE summary for Capital Power that’s visually segmented by category, easily editable for regional or business-line notes, and shareable across teams to streamline risk discussions and strategic planning.
Economic factors
Power price volatility and merchant exposure
Wholesale price swings materially drive earnings for Capital Power's uncontracted assets, with merchant volatility evident as regional real-time prices swung >50% year-over-year in several North American hubs. Gas dynamics — Henry Hub ~3–4 USD/MMBtu in H1 2024 — plus load growth and rising renewables (wind+solar ~21% of U.S. generation in 2023) compress or widen spark spreads. Hedging strategy and contract tenor balance upside versus downside risk, while node and fuel diversification across Alberta, MISO and other markets reduces portfolio variance.
Interest rates and capital intensity
Rising global rates (Fed funds ~5.25–5.50% mid‑2025; Canada 10‑yr ~3.6%) pressure project NPVs and have pushed utility WACCs roughly 200 basis points versus 2021, heightening capital costs for Capital Power’s build/own/operate model and demanding disciplined leverage. Tight tax‑equity and project‑finance markets continue to pace pipeline execution, so prioritizing incentive‑rich, fully contracted projects preserves returns.
Capacity value of dispatchable generation
With variable renewables supplying about 30% of global electricity in 2023 (IEA), capacity payments and scarcity pricing have surged in importance, with Alberta’s energy-only market showing price spikes up to several thousand dollars per MWh at tight supply. Gas-fired and storage assets can capture flexibility premiums—battery pack costs fell roughly 89% since 2010 to about $125/kWh in 2023 (BNEF), improving returns. Reliability adders and capacity credits raise project NPV versus pure energy-only revenue, and investment in fast-start gas units or flexible storage supports outsized peak-period earnings.
Input fuel and carbon cost pass-through
Input fuel and carbon cost pass-through materially alters Capital Power margins: natural gas price volatility (sharp swings in 2022–23) and carbon costs drive merchant and contracted plant economics, while long-term fuel supply and basis hedges stabilize cash flows. Canada’s federal carbon price is scheduled to reach CAD 170/tonne by 2030, making carbon recovery in PPAs and market structures critical. Efficiency upgrades reduce variable costs and carbon exposure, improving margin resilience.
- Gas volatility: hedges stabilize revenue
- Carbon: CAD 170/t by 2030 impacts recovery
- PPAs: pass-through depends on contract/market
- Efficiency: lowers variable cost and exposure
Supply chain and equipment inflation
Turbines, transformers and panels face cost and lead-time pressure: turbine lead times rose to roughly 12–24 months, transformer delivery 6–12 months and module prices averaged about 0.20–0.30 USD/W in 2024, squeezing project margins and capex timing for Capital Power.
Geopolitics and tariffs have shifted procurement windows; multi-sourcing and framework agreements protect schedules, while inventory planning limits outage risk and delay penalties.
- Lead times: turbines 12–24m, transformers 6–12m
- Module prices: ≈0.20–0.30 USD/W (2024)
- Mitigation: multi-sourcing, framework contracts, strategic inventory
IRA incentives and Canada carbon pricing reshape dispatchable asset economics and timelines
Wholesale price swings, gas price moves (Henry Hub ~3–4 USD/MMBtu H1 2024) and carbon policy (Canada CAD 170/t by 2030) drive earnings volatility; hedging and contract tenor mitigate merchant risk. Higher rates (Fed funds ~5.25–5.50% mid‑2025) raise WACC and capex costs, stressing disciplined leverage. Lead times and equipment prices (modules ~0.20–0.30 USD/W in 2024) compress project margins.
| Metric | Value |
|---|---|
| Henry Hub | 3–4 USD/MMBtu (H1 2024) |
| Fed funds | 5.25–5.50% (mid‑2025) |
| Carbon | CAD 170/t by 2030 |
| Module price | 0.20–0.30 USD/W (2024) |
What You See Is What You Get
Capital Power PESTLE Analysis
The Capital Power PESTLE Analysis preview shown here is the exact document you’ll receive after purchase—fully formatted and ready to use. It provides a structured review of political, economic, social, technological, legal, and environmental factors affecting Capital Power. No placeholders or surprises—download the final file immediately after checkout.











