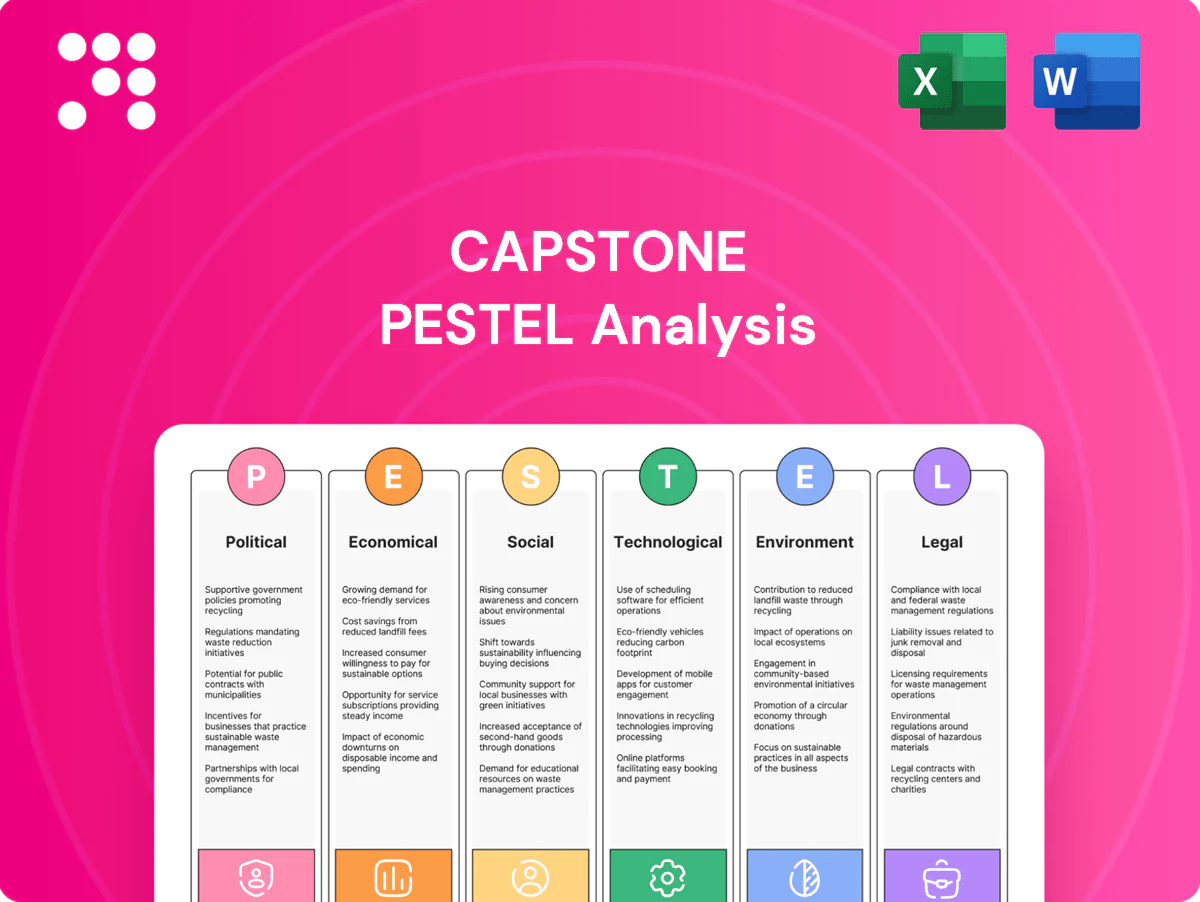
Capstone PESTLE Analysis

Skip the Research. Get the Strategy.
Unlock strategic foresight with our Capstone PESTLE Analysis—three to five expert-level insights into the political, economic, social, technological, legal, and environmental forces shaping Capstone's future. Ready-made and fully editable, it’s ideal for investors, consultants, and planners. Purchase the full report now for the complete, actionable breakdown you need to make smarter decisions.
Political factors

Host-country stability
Capstone operates across multiple Latin American and North American jurisdictions where political transitions frequently reshape mining priorities; World Bank 2023 political stability indicator for Latin America averaged -0.28, signaling elevated transition risk.
Policy shifts can change taxes, royalties and permitting timelines—Fraser Institute 2023 notes permitting delays commonly exceed 12 months in several regional jurisdictions.
Stable administrations enable multi-year capital planning, while heightened instability raises sovereign risk and social license exposure, increasing project financing costs and timeline uncertainty.
Resource nationalism
Debates over capturing more mineral wealth have prompted proposals for higher royalties and windfall taxes as copper prices averaged roughly $9,000/ton in 2024 and supply comes chiefly from Chile (about 28% of global mined copper) and Peru (~12%).
Copper’s strategic role in the energy transition has increased scrutiny over foreign ownership and led governments to demand negotiated frameworks and community benefit agreements to secure local stakes.
Transparent ESG reporting and verified community investments help sustain social license to operate and reduce the risk of abrupt policy shifts.

Permitting and approvals
Complex, multi-agency permitting routinely delays projects—median permitting for US energy infrastructure is 3–5 years (DOE reports), and EIAs commonly add 6–24 months; such delays often raise capital costs by roughly 20–30%. Political focus on environmental safeguards increases data and consultation requirements; early engagement and robust baseline studies cut rework and change orders materially, while clear timelines and regulatory predictability preserve capital efficiency.

Infrastructure and public investment
Trade and geopolitical dynamics
Global copper trade is exposed to tariffs, sanctions and export controls; Chile produced about 5.6 Mt refined copper in 2023 and China holds roughly 45% of smelting capacity, concentrating geopolitical risk and equipment supply-chain disruption. Favorable trade deals boost concentrate and cathode access while diversified offtake reduces counterparty concentration; LME 2024 average copper roughly $9,200/t.
- Tariffs/sanctions: supply disruption risk
- China ~45% smelting: concentration
- Chile ~5.6 Mt (2023): major exporter
- Diversified offtake limits counterparty risk
- LME 2024 avg ≈ $9,200/t
Permitting delays in Americas >12m lift capex ~20–30%
Political transitions across Latin and North America raise permitting, royalty and social-license risks; World Bank 2023 political stability −0.28. Permitting delays commonly exceed 12 months, lifting capex and financing costs ~20–30%. Copper strategic importance spurs scrutiny on foreign ownership as LME 2024 avg ≈ $9,200/t.
| Metric | Value |
|---|---|
| World Bank Pol. Stability (LATAM 2023) | −0.28 |
| LME avg copper (2024) | $9,200/t |
| Chile mined copper (2023) | 5.6 Mt |
| China smelting share (2024) | ≈45% |
What is included in the product
 Detailed Word Document
Explores how Political, Economic, Social, Technological, Environmental, and Legal factors uniquely affect the Capstone, with each section backed by current data and industry-specific examples to identify threats and opportunities for executives, consultants, and entrepreneurs. Delivered in clean, ready-to-use format with forward-looking insights to support scenario planning, funding pitches, and strategic decision-making.

 Customizable Excel Spreadsheet
The Capstone PESTLE Analysis distills complex external insights into a clean, visually segmented summary for quick reference in meetings or presentations. Editable notes and a shareable format let teams align fast, tailor context by region or business line, and use the concise output directly in decks or planning sessions.
Economic factors

Copper price volatility
Revenue is highly sensitive to LME copper, which averaged about 9,000 USD/tonne in mid-2025, so price swings materially move top-line. Cyclical construction and manufacturing demand now intersects secular EV and grid electrification growth, supporting medium-term demand. Active hedging smooths cash flows but caps upside exposure. A robust balance sheet with >1.5x net debt/EBITDA capacity enables through-cycle investment.
Input cost inflation
Diesel, grid power, reagents and labor are the core drivers of operating cost: diesel spiked ~25% during 2021–22, and energy can account for 15–30% of opex in heavy industries. Inflation and adverse FX moves have eroded margins in 2023–24, with CPI remaining elevated in many markets. Long‑term power contracts and onsite renewables smooth volatility, while continuous improvement and automation routinely cut unit costs by double digits.

Exchange rate exposure
Mines earn USD but incur local-currency costs, so a 10% depreciation of the local currency increases USD-equivalent margins by roughly 0.10 times the local-cost share (eg, with 60% local-costs that equals ~6 percentage points of margin uplift).
Appreciation compresses margins symmetrically; miners use FX hedging and natural offsets (USD-linked royalties, export receipts) to stabilize cash flow.
Localizing procurement reduces FX exposure but can raise supply-chain risk, so firms balance currency risk versus supplier resilience and cost-to-serve.

Capital intensity and funding
Large upfront capex and ongoing sustaining capital are intrinsic to copper projects, with major greenfield mines commonly requiring upfront investment exceeding $1 billion and substantial multi‑year sustaining spend. Access to credit and project finance in 2024–25 hinges on cost‑curve positioning and ESG credentials, as lenders prefer lower‑quartile costs and credible decarbonization plans. Phased expansions improve IRR and derisk execution, while strong free cash flow supports dividends and growth capital.
- Capex: upfront > $1 billion
- Funding: credit linked to cost‑curve quartile + ESG
- Expansion: phased = higher returns, lower execution risk
- Cash flow: underpins dividends and reinvestment
China and global demand
China remains the marginal buyer, accounting for roughly 50% of global refined copper demand; global refined copper demand totaled about 26 Mt in 2024, with China central to marginal moves. Rebalancing toward ex-China electrification (EVs, grids) broadens demand sources and reduces single-market exposure. Exchange inventory cycles (LME/SHFE) still drive short-term price swings, while long-term deficits depend on permitting pace versus energy-transition tapering.
- China share ~50%
- Global demand ~26 Mt (2024)
- Electrification shifts demand ex-China
- Inventories drive short-term prices
- Long-term deficit tied to permitting vs transition
Permitting delays in Americas >12m lift capex ~20–30%
Revenue sensitive to LME copper (~9,000 USD/tonne mid‑2025) with cyclical demand offset by EV/grid secular growth; active hedging smooths cash flow but limits upside. Operating costs driven by diesel, power and labor; energy can be 15–30% of opex and inflation/FX squeezed margins in 2023–24. Large greenfield capex commonly >1 billion USD; balance sheets with >1.5x net debt/EBITDA enable through‑cycle investment.
| Metric | Value |
|---|---|
| LME copper (mid‑2025) | ~9,000 USD/tonne |
| Global refined demand (2024) | ~26 Mt |
| China share | ~50% |
| Greenfield capex | >1 billion USD |
| Net debt/EBITDA capacity | >1.5x |
Same Document Delivered
Capstone PESTLE Analysis
The preview shown here is the exact Capstone PESTLE Analysis document you’ll receive after purchase—fully formatted and ready to use. The content, layout, and insights visible are the final version with no placeholders or teasers. After checkout you can immediately download this ready-to-use, professionally structured file.

Skip the Research. Get the Strategy.
Unlock strategic foresight with our Capstone PESTLE Analysis—three to five expert-level insights into the political, economic, social, technological, legal, and environmental forces shaping Capstone's future. Ready-made and fully editable, it’s ideal for investors, consultants, and planners. Purchase the full report now for the complete, actionable breakdown you need to make smarter decisions.
Political factors
Host-country stability
Capstone operates across multiple Latin American and North American jurisdictions where political transitions frequently reshape mining priorities; World Bank 2023 political stability indicator for Latin America averaged -0.28, signaling elevated transition risk.
Policy shifts can change taxes, royalties and permitting timelines—Fraser Institute 2023 notes permitting delays commonly exceed 12 months in several regional jurisdictions.
Stable administrations enable multi-year capital planning, while heightened instability raises sovereign risk and social license exposure, increasing project financing costs and timeline uncertainty.
Resource nationalism
Debates over capturing more mineral wealth have prompted proposals for higher royalties and windfall taxes as copper prices averaged roughly $9,000/ton in 2024 and supply comes chiefly from Chile (about 28% of global mined copper) and Peru (~12%).
Copper’s strategic role in the energy transition has increased scrutiny over foreign ownership and led governments to demand negotiated frameworks and community benefit agreements to secure local stakes.
Transparent ESG reporting and verified community investments help sustain social license to operate and reduce the risk of abrupt policy shifts.
Permitting and approvals
Complex, multi-agency permitting routinely delays projects—median permitting for US energy infrastructure is 3–5 years (DOE reports), and EIAs commonly add 6–24 months; such delays often raise capital costs by roughly 20–30%. Political focus on environmental safeguards increases data and consultation requirements; early engagement and robust baseline studies cut rework and change orders materially, while clear timelines and regulatory predictability preserve capital efficiency.
Infrastructure and public investment
Trade and geopolitical dynamics
Global copper trade is exposed to tariffs, sanctions and export controls; Chile produced about 5.6 Mt refined copper in 2023 and China holds roughly 45% of smelting capacity, concentrating geopolitical risk and equipment supply-chain disruption. Favorable trade deals boost concentrate and cathode access while diversified offtake reduces counterparty concentration; LME 2024 average copper roughly $9,200/t.
- Tariffs/sanctions: supply disruption risk
- China ~45% smelting: concentration
- Chile ~5.6 Mt (2023): major exporter
- Diversified offtake limits counterparty risk
- LME 2024 avg ≈ $9,200/t
Permitting delays in Americas >12m lift capex ~20–30%
Political transitions across Latin and North America raise permitting, royalty and social-license risks; World Bank 2023 political stability −0.28. Permitting delays commonly exceed 12 months, lifting capex and financing costs ~20–30%. Copper strategic importance spurs scrutiny on foreign ownership as LME 2024 avg ≈ $9,200/t.
| Metric | Value |
|---|---|
| World Bank Pol. Stability (LATAM 2023) | −0.28 |
| LME avg copper (2024) | $9,200/t |
| Chile mined copper (2023) | 5.6 Mt |
| China smelting share (2024) | ≈45% |
What is included in the product
Detailed Word Document
Explores how Political, Economic, Social, Technological, Environmental, and Legal factors uniquely affect the Capstone, with each section backed by current data and industry-specific examples to identify threats and opportunities for executives, consultants, and entrepreneurs. Delivered in clean, ready-to-use format with forward-looking insights to support scenario planning, funding pitches, and strategic decision-making.
Customizable Excel Spreadsheet
The Capstone PESTLE Analysis distills complex external insights into a clean, visually segmented summary for quick reference in meetings or presentations. Editable notes and a shareable format let teams align fast, tailor context by region or business line, and use the concise output directly in decks or planning sessions.
Economic factors
Copper price volatility
Revenue is highly sensitive to LME copper, which averaged about 9,000 USD/tonne in mid-2025, so price swings materially move top-line. Cyclical construction and manufacturing demand now intersects secular EV and grid electrification growth, supporting medium-term demand. Active hedging smooths cash flows but caps upside exposure. A robust balance sheet with >1.5x net debt/EBITDA capacity enables through-cycle investment.
Input cost inflation
Diesel, grid power, reagents and labor are the core drivers of operating cost: diesel spiked ~25% during 2021–22, and energy can account for 15–30% of opex in heavy industries. Inflation and adverse FX moves have eroded margins in 2023–24, with CPI remaining elevated in many markets. Long‑term power contracts and onsite renewables smooth volatility, while continuous improvement and automation routinely cut unit costs by double digits.
Exchange rate exposure
Mines earn USD but incur local-currency costs, so a 10% depreciation of the local currency increases USD-equivalent margins by roughly 0.10 times the local-cost share (eg, with 60% local-costs that equals ~6 percentage points of margin uplift).
Appreciation compresses margins symmetrically; miners use FX hedging and natural offsets (USD-linked royalties, export receipts) to stabilize cash flow.
Localizing procurement reduces FX exposure but can raise supply-chain risk, so firms balance currency risk versus supplier resilience and cost-to-serve.
Capital intensity and funding
Large upfront capex and ongoing sustaining capital are intrinsic to copper projects, with major greenfield mines commonly requiring upfront investment exceeding $1 billion and substantial multi‑year sustaining spend. Access to credit and project finance in 2024–25 hinges on cost‑curve positioning and ESG credentials, as lenders prefer lower‑quartile costs and credible decarbonization plans. Phased expansions improve IRR and derisk execution, while strong free cash flow supports dividends and growth capital.
- Capex: upfront > $1 billion
- Funding: credit linked to cost‑curve quartile + ESG
- Expansion: phased = higher returns, lower execution risk
- Cash flow: underpins dividends and reinvestment
China and global demand
China remains the marginal buyer, accounting for roughly 50% of global refined copper demand; global refined copper demand totaled about 26 Mt in 2024, with China central to marginal moves. Rebalancing toward ex-China electrification (EVs, grids) broadens demand sources and reduces single-market exposure. Exchange inventory cycles (LME/SHFE) still drive short-term price swings, while long-term deficits depend on permitting pace versus energy-transition tapering.
- China share ~50%
- Global demand ~26 Mt (2024)
- Electrification shifts demand ex-China
- Inventories drive short-term prices
- Long-term deficit tied to permitting vs transition
Permitting delays in Americas >12m lift capex ~20–30%
Revenue sensitive to LME copper (~9,000 USD/tonne mid‑2025) with cyclical demand offset by EV/grid secular growth; active hedging smooths cash flow but limits upside. Operating costs driven by diesel, power and labor; energy can be 15–30% of opex and inflation/FX squeezed margins in 2023–24. Large greenfield capex commonly >1 billion USD; balance sheets with >1.5x net debt/EBITDA enable through‑cycle investment.
| Metric | Value |
|---|---|
| LME copper (mid‑2025) | ~9,000 USD/tonne |
| Global refined demand (2024) | ~26 Mt |
| China share | ~50% |
| Greenfield capex | >1 billion USD |
| Net debt/EBITDA capacity | >1.5x |
Same Document Delivered
Capstone PESTLE Analysis
The preview shown here is the exact Capstone PESTLE Analysis document you’ll receive after purchase—fully formatted and ready to use. The content, layout, and insights visible are the final version with no placeholders or teasers. After checkout you can immediately download this ready-to-use, professionally structured file.
Original: $10.00
-65%$10.00
$3.50Description
Skip the Research. Get the Strategy.
Unlock strategic foresight with our Capstone PESTLE Analysis—three to five expert-level insights into the political, economic, social, technological, legal, and environmental forces shaping Capstone's future. Ready-made and fully editable, it’s ideal for investors, consultants, and planners. Purchase the full report now for the complete, actionable breakdown you need to make smarter decisions.
Political factors
Host-country stability
Capstone operates across multiple Latin American and North American jurisdictions where political transitions frequently reshape mining priorities; World Bank 2023 political stability indicator for Latin America averaged -0.28, signaling elevated transition risk.
Policy shifts can change taxes, royalties and permitting timelines—Fraser Institute 2023 notes permitting delays commonly exceed 12 months in several regional jurisdictions.
Stable administrations enable multi-year capital planning, while heightened instability raises sovereign risk and social license exposure, increasing project financing costs and timeline uncertainty.
Resource nationalism
Debates over capturing more mineral wealth have prompted proposals for higher royalties and windfall taxes as copper prices averaged roughly $9,000/ton in 2024 and supply comes chiefly from Chile (about 28% of global mined copper) and Peru (~12%).
Copper’s strategic role in the energy transition has increased scrutiny over foreign ownership and led governments to demand negotiated frameworks and community benefit agreements to secure local stakes.
Transparent ESG reporting and verified community investments help sustain social license to operate and reduce the risk of abrupt policy shifts.
Permitting and approvals
Complex, multi-agency permitting routinely delays projects—median permitting for US energy infrastructure is 3–5 years (DOE reports), and EIAs commonly add 6–24 months; such delays often raise capital costs by roughly 20–30%. Political focus on environmental safeguards increases data and consultation requirements; early engagement and robust baseline studies cut rework and change orders materially, while clear timelines and regulatory predictability preserve capital efficiency.
Infrastructure and public investment
Trade and geopolitical dynamics
Global copper trade is exposed to tariffs, sanctions and export controls; Chile produced about 5.6 Mt refined copper in 2023 and China holds roughly 45% of smelting capacity, concentrating geopolitical risk and equipment supply-chain disruption. Favorable trade deals boost concentrate and cathode access while diversified offtake reduces counterparty concentration; LME 2024 average copper roughly $9,200/t.
- Tariffs/sanctions: supply disruption risk
- China ~45% smelting: concentration
- Chile ~5.6 Mt (2023): major exporter
- Diversified offtake limits counterparty risk
- LME 2024 avg ≈ $9,200/t
Permitting delays in Americas >12m lift capex ~20–30%
Political transitions across Latin and North America raise permitting, royalty and social-license risks; World Bank 2023 political stability −0.28. Permitting delays commonly exceed 12 months, lifting capex and financing costs ~20–30%. Copper strategic importance spurs scrutiny on foreign ownership as LME 2024 avg ≈ $9,200/t.
| Metric | Value |
|---|---|
| World Bank Pol. Stability (LATAM 2023) | −0.28 |
| LME avg copper (2024) | $9,200/t |
| Chile mined copper (2023) | 5.6 Mt |
| China smelting share (2024) | ≈45% |
What is included in the product
Detailed Word Document
Explores how Political, Economic, Social, Technological, Environmental, and Legal factors uniquely affect the Capstone, with each section backed by current data and industry-specific examples to identify threats and opportunities for executives, consultants, and entrepreneurs. Delivered in clean, ready-to-use format with forward-looking insights to support scenario planning, funding pitches, and strategic decision-making.
Customizable Excel Spreadsheet
The Capstone PESTLE Analysis distills complex external insights into a clean, visually segmented summary for quick reference in meetings or presentations. Editable notes and a shareable format let teams align fast, tailor context by region or business line, and use the concise output directly in decks or planning sessions.
Economic factors
Copper price volatility
Revenue is highly sensitive to LME copper, which averaged about 9,000 USD/tonne in mid-2025, so price swings materially move top-line. Cyclical construction and manufacturing demand now intersects secular EV and grid electrification growth, supporting medium-term demand. Active hedging smooths cash flows but caps upside exposure. A robust balance sheet with >1.5x net debt/EBITDA capacity enables through-cycle investment.
Input cost inflation
Diesel, grid power, reagents and labor are the core drivers of operating cost: diesel spiked ~25% during 2021–22, and energy can account for 15–30% of opex in heavy industries. Inflation and adverse FX moves have eroded margins in 2023–24, with CPI remaining elevated in many markets. Long‑term power contracts and onsite renewables smooth volatility, while continuous improvement and automation routinely cut unit costs by double digits.
Exchange rate exposure
Mines earn USD but incur local-currency costs, so a 10% depreciation of the local currency increases USD-equivalent margins by roughly 0.10 times the local-cost share (eg, with 60% local-costs that equals ~6 percentage points of margin uplift).
Appreciation compresses margins symmetrically; miners use FX hedging and natural offsets (USD-linked royalties, export receipts) to stabilize cash flow.
Localizing procurement reduces FX exposure but can raise supply-chain risk, so firms balance currency risk versus supplier resilience and cost-to-serve.
Capital intensity and funding
Large upfront capex and ongoing sustaining capital are intrinsic to copper projects, with major greenfield mines commonly requiring upfront investment exceeding $1 billion and substantial multi‑year sustaining spend. Access to credit and project finance in 2024–25 hinges on cost‑curve positioning and ESG credentials, as lenders prefer lower‑quartile costs and credible decarbonization plans. Phased expansions improve IRR and derisk execution, while strong free cash flow supports dividends and growth capital.
- Capex: upfront > $1 billion
- Funding: credit linked to cost‑curve quartile + ESG
- Expansion: phased = higher returns, lower execution risk
- Cash flow: underpins dividends and reinvestment
China and global demand
China remains the marginal buyer, accounting for roughly 50% of global refined copper demand; global refined copper demand totaled about 26 Mt in 2024, with China central to marginal moves. Rebalancing toward ex-China electrification (EVs, grids) broadens demand sources and reduces single-market exposure. Exchange inventory cycles (LME/SHFE) still drive short-term price swings, while long-term deficits depend on permitting pace versus energy-transition tapering.
- China share ~50%
- Global demand ~26 Mt (2024)
- Electrification shifts demand ex-China
- Inventories drive short-term prices
- Long-term deficit tied to permitting vs transition
Permitting delays in Americas >12m lift capex ~20–30%
Revenue sensitive to LME copper (~9,000 USD/tonne mid‑2025) with cyclical demand offset by EV/grid secular growth; active hedging smooths cash flow but limits upside. Operating costs driven by diesel, power and labor; energy can be 15–30% of opex and inflation/FX squeezed margins in 2023–24. Large greenfield capex commonly >1 billion USD; balance sheets with >1.5x net debt/EBITDA enable through‑cycle investment.
| Metric | Value |
|---|---|
| LME copper (mid‑2025) | ~9,000 USD/tonne |
| Global refined demand (2024) | ~26 Mt |
| China share | ~50% |
| Greenfield capex | >1 billion USD |
| Net debt/EBITDA capacity | >1.5x |
Same Document Delivered
Capstone PESTLE Analysis
The preview shown here is the exact Capstone PESTLE Analysis document you’ll receive after purchase—fully formatted and ready to use. The content, layout, and insights visible are the final version with no placeholders or teasers. After checkout you can immediately download this ready-to-use, professionally structured file.











