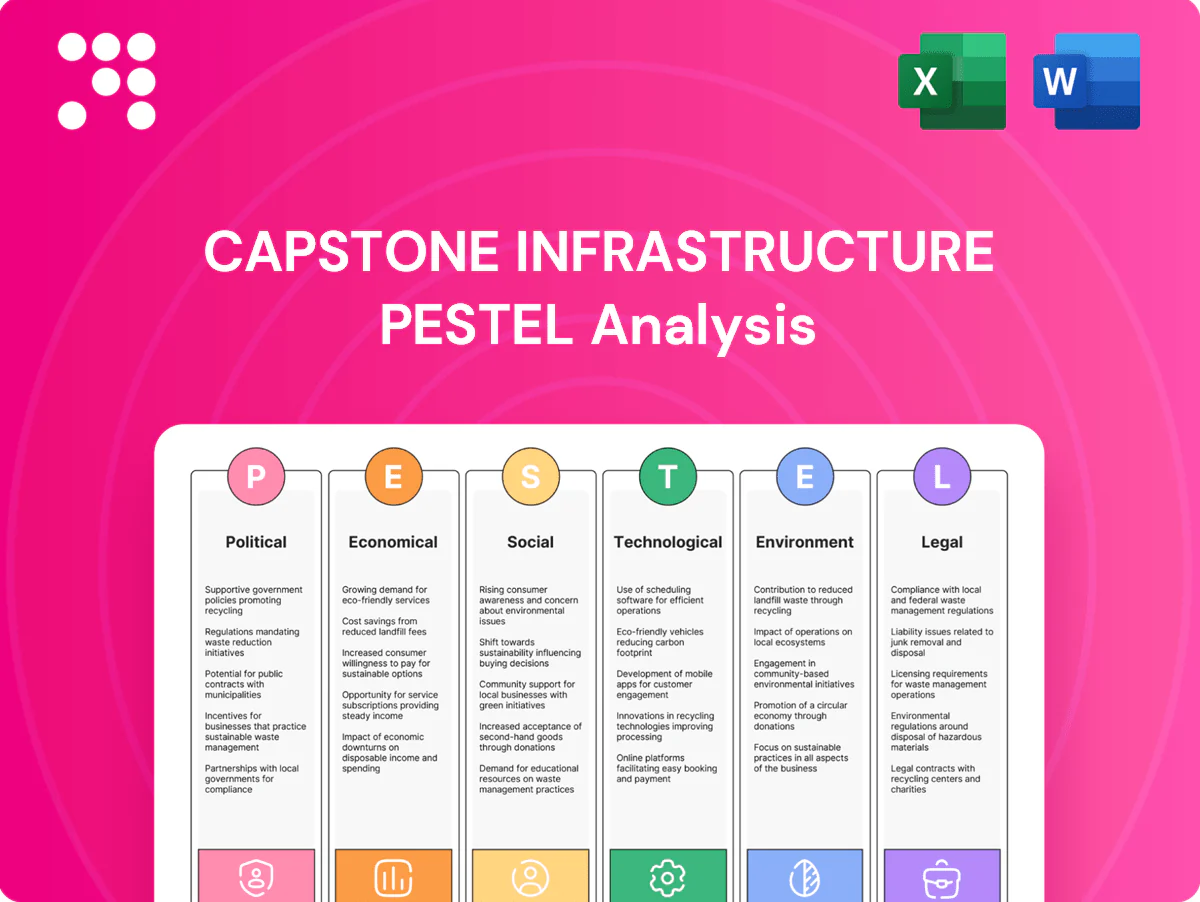
Capstone Infrastructure PESTLE Analysis

Your Competitive Advantage Starts with This Report
Gain a competitive edge with our PESTLE Analysis of Capstone Infrastructure—concise, timely, and focused on the external forces shaping future performance. Learn how political, economic, social, technological, legal, and environmental trends create risks and opportunities for the company. Purchase the full report to access the complete deep-dive, data tables, and actionable recommendations for investors and strategists.
Political factors

Energy policy shifts
Government priorities across federal and provincial levels drive renewable procurement, gas peaker roles and transmission funding, with the US Bipartisan Infrastructure Law allocating about $65 billion for grid modernization and Canada targeting net-zero by 2050.
Policy reversals or subsidy changes can rapidly shift project pipelines and IRRs for developers.
Capstone must monitor IESO, AESO, BC Hydro and FERC initiatives to align growth.
Stable bipartisan support for reliability continues to favor essential utilities.
Carbon pricing
Canada’s federal carbon price sits at about CAD 65/t (2023) and is scheduled to rise toward roughly CAD 170/t by 2030, while provincial programs (e.g., Alberta TIER, BC carbon tax) create patchwork impacts on gas-fired margins and renewable competitiveness. Rising carbon costs lift PPA economics for wind, solar and hydro, improving bid prices and contract availability. Compliance costs and limited offset supply can raise dispatch costs and compress gas asset margins; strategic hedging and a diversified portfolio mix reduce net exposure.

Permitting priorities
Political emphasis on fast-tracking critical infrastructure tied to large national packages — US Bipartisan Infrastructure Law $1.2 trillion and Canada’s $180 billion Investing in Canada Plan — can shorten project timelines, while local opposition still routinely stalls developments. Streamlined permitting for clean energy and transmission, driven by net-zero by 2050 targets, is a clear tailwind. Municipal zoning and provincial approvals remain decisive in siting outcomes. Capstone’s proactive stakeholder engagement limits political friction and accelerates approvals.

Indigenous partnerships
Federal Impact Assessment Act (2019) and growing provincial policies increasingly require Indigenous consultation and benefit‑sharing; 2021 Census records 1.8 million Indigenous people (5.0% of Canada), increasing political weight. Partnerships can enhance social licence, access to financing and bid competitiveness, and political support favors projects with Indigenous equity participation. Capstone’s co‑development models can help de‑risk approvals.
- Policy: IAA 2019 — mandatory consultation
- Demographics: 1.8M Indigenous (2021 Census)
- Benefit: equity participation improves approvals/financing
U.S.-Canada dynamics
U.S.-Canada dynamics drive Capstone: cross-border trade exceeding US$700 billion annually and IRA's roughly US$369 billion in clean energy incentives reshape supply chains, while Buy American rules and IRA-linked incentives tilt equipment pricing and availability for Canadian projects, altering capital flows and timelines; transmission interties and export markets (several GW of cross-border capacity) depend on bilateral cooperation, so aligning procurement to prevailing incentives preserves margin and market access.
- Trade: >US$700B
- IRA: ~US$369B
- Buy American: impacts sourcing/costs
- Interties: several GW, require bilateral policy
- Capstone: alignment = tax credits, supply reliability
Policy drive: federal funds, carbon pricing and Buy American reshape power procurement
Federal and provincial priorities (US BIL $1.2T, IRA ~$369B; Canada Investing in Canada ~$180B) accelerate grid and clean-energy procurement, favoring utilities.
Carbon policy (CA CAD65/t 2023 → ~CAD170/t by 2030) and provincial schemes compress gas margins and improve PPA economics for renewables.
Indigenous consultation (1.8M, 2021) and IAA 2019 raise approval requirements; equity partnerships ease financing.
Buy American, cross‑border trade >US$700B and intertie rules shift sourcing, tax credits and timelines.
| Metric | Value |
|---|---|
| US IRA/BIL | $369B / $1.2T |
| Canada carbon | CAD65/t (2023) → ~CAD170/t (2030) |
What is included in the product
 Detailed Word Document
Explores how Political, Economic, Social, Technological, Environmental and Legal factors uniquely affect Capstone Infrastructure, with data-backed trends and region-specific examples; delivered in clean, ready-to-use format to support executives, investors and scenario planning with forward-looking insights.

 Customizable Excel Spreadsheet
A concise, visually segmented PESTLE summary for Capstone Infrastructure that clarifies external risks and opportunities, is easily droppable into presentations, shareable across teams, and editable with region- or business-line–specific notes for faster planning and alignment.
Economic factors

Interest rates
Higher interest rates (Bank of Canada policy rate ~5.00% and 10-year Canada yield ~3.5% in mid-2025) lift WACC and compress project IRRs; long-duration PPAs (typically 15–25 years) and CPI-linked contracts help offset rising financing costs. Refinancing windows and staggered debt maturities are critical to cash-flow stability for Capstone, which can pace asset growth to align with rate cycles.
PPA pricing
Corporate and utility demand anchors long-term offtake prices, with rising corporate PPA activity tightening forward curves and supporting contract premiums. Greater merchant price volatility elevates the value of contracted revenue, reducing exposure to short-term spikes and troughs. Counterparty credit quality directly impacts financing costs and asset valuation through rating-driven covenants and tenor availability. Capstone’s disciplined contracting strategy prioritizes high-credit counterparties and staggered tenors to secure predictable returns.

Inflation and costs
Turbine, panel and EPC costs remain highly sensitive to commodity and logistics trends, driving capex volatility across projects. Index-linked PPAs and O&M escalators are commonly used to protect margins against inflationary pressure. Supply-chain localization can reduce exposure to global shocks but typically increases near-term capex. Focused asset optimization programs raise energy output per dollar invested, improving project economics.

Power demand growth
Data centers, electrification and rising EV adoption are driving load growth; data centers account for roughly 1% of global electricity use (~200 TWh annually) and EV market share has climbed into double digits, lifting long‑run demand forecasts. Tight supply elevates capacity and ancillary services; gas peakers retain value in scarcity events while storage arbitrage expands as battery costs fall and dispatch value rises. Capstone can prioritize provinces with stronger demand trajectories and constrained reserve margins.
- Data centers ~1% global electricity (~200 TWh)
- EVs: double‑digit global market share
- Capacity & ancillary services pricier in tight markets
- Gas peakers benefit in scarcity; storage grows via arbitrage
- Target provinces with robust demand and tight reserves
FX exposure
CAD-USD volatility directly alters imported equipment costs and U.S.-linked revenues; USD/CAD averaged about 1.34 in 2024 after a ~6% CAD depreciation versus 2022–23, raising dollar-denominated capex. Active hedging policies during construction can lock-in rates and stabilize project IRRs. Aligning debt currency with cash flows and jurisdictional diversification smooths earnings volatility.
- FX rate (USD/CAD 2024 avg) 1.34
- CAD change 2022–24 ≈ -6%
- Hedging reduces construction-rate risk
- Currency-aligned debt lowers FX mismatch
- Diversification smooths revenue swings
Policy drive: federal funds, carbon pricing and Buy American reshape power procurement
Higher rates (BoC ~5.00%, Canada 10y ~3.5% mid‑2025) lift WACC; long PPAs/CPI links mitigate. Corporate PPA growth tightens curves; counterparty credit affects financing costs. Capex inflation and USD/CAD (2024 avg 1.34; CAD ≈ -6% 2022–24) raise project costs; hedging and currency‑aligned debt reduce risk.
| Metric | Value |
|---|---|
| BoC policy rate | ~5.00% (mid‑2025) |
| Canada 10y | ~3.5% |
| USD/CAD | 1.34 (2024 avg) |
| Data centers | ~200 TWh (~1% global) |
Same Document Delivered
Capstone Infrastructure PESTLE Analysis
The Capstone Infrastructure PESTLE Analysis provides a concise evaluation of political, economic, social, technological, legal and environmental factors affecting operations. The preview shown here is the exact document you’ll receive after purchase—fully formatted and ready to use. It is practitioner-focused, data-driven, and immediately actionable.

Your Competitive Advantage Starts with This Report
Gain a competitive edge with our PESTLE Analysis of Capstone Infrastructure—concise, timely, and focused on the external forces shaping future performance. Learn how political, economic, social, technological, legal, and environmental trends create risks and opportunities for the company. Purchase the full report to access the complete deep-dive, data tables, and actionable recommendations for investors and strategists.
Political factors
Energy policy shifts
Government priorities across federal and provincial levels drive renewable procurement, gas peaker roles and transmission funding, with the US Bipartisan Infrastructure Law allocating about $65 billion for grid modernization and Canada targeting net-zero by 2050.
Policy reversals or subsidy changes can rapidly shift project pipelines and IRRs for developers.
Capstone must monitor IESO, AESO, BC Hydro and FERC initiatives to align growth.
Stable bipartisan support for reliability continues to favor essential utilities.
Carbon pricing
Canada’s federal carbon price sits at about CAD 65/t (2023) and is scheduled to rise toward roughly CAD 170/t by 2030, while provincial programs (e.g., Alberta TIER, BC carbon tax) create patchwork impacts on gas-fired margins and renewable competitiveness. Rising carbon costs lift PPA economics for wind, solar and hydro, improving bid prices and contract availability. Compliance costs and limited offset supply can raise dispatch costs and compress gas asset margins; strategic hedging and a diversified portfolio mix reduce net exposure.
Permitting priorities
Political emphasis on fast-tracking critical infrastructure tied to large national packages — US Bipartisan Infrastructure Law $1.2 trillion and Canada’s $180 billion Investing in Canada Plan — can shorten project timelines, while local opposition still routinely stalls developments. Streamlined permitting for clean energy and transmission, driven by net-zero by 2050 targets, is a clear tailwind. Municipal zoning and provincial approvals remain decisive in siting outcomes. Capstone’s proactive stakeholder engagement limits political friction and accelerates approvals.
Indigenous partnerships
Federal Impact Assessment Act (2019) and growing provincial policies increasingly require Indigenous consultation and benefit‑sharing; 2021 Census records 1.8 million Indigenous people (5.0% of Canada), increasing political weight. Partnerships can enhance social licence, access to financing and bid competitiveness, and political support favors projects with Indigenous equity participation. Capstone’s co‑development models can help de‑risk approvals.
- Policy: IAA 2019 — mandatory consultation
- Demographics: 1.8M Indigenous (2021 Census)
- Benefit: equity participation improves approvals/financing
U.S.-Canada dynamics
U.S.-Canada dynamics drive Capstone: cross-border trade exceeding US$700 billion annually and IRA's roughly US$369 billion in clean energy incentives reshape supply chains, while Buy American rules and IRA-linked incentives tilt equipment pricing and availability for Canadian projects, altering capital flows and timelines; transmission interties and export markets (several GW of cross-border capacity) depend on bilateral cooperation, so aligning procurement to prevailing incentives preserves margin and market access.
- Trade: >US$700B
- IRA: ~US$369B
- Buy American: impacts sourcing/costs
- Interties: several GW, require bilateral policy
- Capstone: alignment = tax credits, supply reliability
Policy drive: federal funds, carbon pricing and Buy American reshape power procurement
Federal and provincial priorities (US BIL $1.2T, IRA ~$369B; Canada Investing in Canada ~$180B) accelerate grid and clean-energy procurement, favoring utilities.
Carbon policy (CA CAD65/t 2023 → ~CAD170/t by 2030) and provincial schemes compress gas margins and improve PPA economics for renewables.
Indigenous consultation (1.8M, 2021) and IAA 2019 raise approval requirements; equity partnerships ease financing.
Buy American, cross‑border trade >US$700B and intertie rules shift sourcing, tax credits and timelines.
| Metric | Value |
|---|---|
| US IRA/BIL | $369B / $1.2T |
| Canada carbon | CAD65/t (2023) → ~CAD170/t (2030) |
What is included in the product
Detailed Word Document
Explores how Political, Economic, Social, Technological, Environmental and Legal factors uniquely affect Capstone Infrastructure, with data-backed trends and region-specific examples; delivered in clean, ready-to-use format to support executives, investors and scenario planning with forward-looking insights.
Customizable Excel Spreadsheet
A concise, visually segmented PESTLE summary for Capstone Infrastructure that clarifies external risks and opportunities, is easily droppable into presentations, shareable across teams, and editable with region- or business-line–specific notes for faster planning and alignment.
Economic factors
Interest rates
Higher interest rates (Bank of Canada policy rate ~5.00% and 10-year Canada yield ~3.5% in mid-2025) lift WACC and compress project IRRs; long-duration PPAs (typically 15–25 years) and CPI-linked contracts help offset rising financing costs. Refinancing windows and staggered debt maturities are critical to cash-flow stability for Capstone, which can pace asset growth to align with rate cycles.
PPA pricing
Corporate and utility demand anchors long-term offtake prices, with rising corporate PPA activity tightening forward curves and supporting contract premiums. Greater merchant price volatility elevates the value of contracted revenue, reducing exposure to short-term spikes and troughs. Counterparty credit quality directly impacts financing costs and asset valuation through rating-driven covenants and tenor availability. Capstone’s disciplined contracting strategy prioritizes high-credit counterparties and staggered tenors to secure predictable returns.
Inflation and costs
Turbine, panel and EPC costs remain highly sensitive to commodity and logistics trends, driving capex volatility across projects. Index-linked PPAs and O&M escalators are commonly used to protect margins against inflationary pressure. Supply-chain localization can reduce exposure to global shocks but typically increases near-term capex. Focused asset optimization programs raise energy output per dollar invested, improving project economics.
Power demand growth
Data centers, electrification and rising EV adoption are driving load growth; data centers account for roughly 1% of global electricity use (~200 TWh annually) and EV market share has climbed into double digits, lifting long‑run demand forecasts. Tight supply elevates capacity and ancillary services; gas peakers retain value in scarcity events while storage arbitrage expands as battery costs fall and dispatch value rises. Capstone can prioritize provinces with stronger demand trajectories and constrained reserve margins.
- Data centers ~1% global electricity (~200 TWh)
- EVs: double‑digit global market share
- Capacity & ancillary services pricier in tight markets
- Gas peakers benefit in scarcity; storage grows via arbitrage
- Target provinces with robust demand and tight reserves
FX exposure
CAD-USD volatility directly alters imported equipment costs and U.S.-linked revenues; USD/CAD averaged about 1.34 in 2024 after a ~6% CAD depreciation versus 2022–23, raising dollar-denominated capex. Active hedging policies during construction can lock-in rates and stabilize project IRRs. Aligning debt currency with cash flows and jurisdictional diversification smooths earnings volatility.
- FX rate (USD/CAD 2024 avg) 1.34
- CAD change 2022–24 ≈ -6%
- Hedging reduces construction-rate risk
- Currency-aligned debt lowers FX mismatch
- Diversification smooths revenue swings
Policy drive: federal funds, carbon pricing and Buy American reshape power procurement
Higher rates (BoC ~5.00%, Canada 10y ~3.5% mid‑2025) lift WACC; long PPAs/CPI links mitigate. Corporate PPA growth tightens curves; counterparty credit affects financing costs. Capex inflation and USD/CAD (2024 avg 1.34; CAD ≈ -6% 2022–24) raise project costs; hedging and currency‑aligned debt reduce risk.
| Metric | Value |
|---|---|
| BoC policy rate | ~5.00% (mid‑2025) |
| Canada 10y | ~3.5% |
| USD/CAD | 1.34 (2024 avg) |
| Data centers | ~200 TWh (~1% global) |
Same Document Delivered
Capstone Infrastructure PESTLE Analysis
The Capstone Infrastructure PESTLE Analysis provides a concise evaluation of political, economic, social, technological, legal and environmental factors affecting operations. The preview shown here is the exact document you’ll receive after purchase—fully formatted and ready to use. It is practitioner-focused, data-driven, and immediately actionable.
Description
Your Competitive Advantage Starts with This Report
Gain a competitive edge with our PESTLE Analysis of Capstone Infrastructure—concise, timely, and focused on the external forces shaping future performance. Learn how political, economic, social, technological, legal, and environmental trends create risks and opportunities for the company. Purchase the full report to access the complete deep-dive, data tables, and actionable recommendations for investors and strategists.
Political factors
Energy policy shifts
Government priorities across federal and provincial levels drive renewable procurement, gas peaker roles and transmission funding, with the US Bipartisan Infrastructure Law allocating about $65 billion for grid modernization and Canada targeting net-zero by 2050.
Policy reversals or subsidy changes can rapidly shift project pipelines and IRRs for developers.
Capstone must monitor IESO, AESO, BC Hydro and FERC initiatives to align growth.
Stable bipartisan support for reliability continues to favor essential utilities.
Carbon pricing
Canada’s federal carbon price sits at about CAD 65/t (2023) and is scheduled to rise toward roughly CAD 170/t by 2030, while provincial programs (e.g., Alberta TIER, BC carbon tax) create patchwork impacts on gas-fired margins and renewable competitiveness. Rising carbon costs lift PPA economics for wind, solar and hydro, improving bid prices and contract availability. Compliance costs and limited offset supply can raise dispatch costs and compress gas asset margins; strategic hedging and a diversified portfolio mix reduce net exposure.
Permitting priorities
Political emphasis on fast-tracking critical infrastructure tied to large national packages — US Bipartisan Infrastructure Law $1.2 trillion and Canada’s $180 billion Investing in Canada Plan — can shorten project timelines, while local opposition still routinely stalls developments. Streamlined permitting for clean energy and transmission, driven by net-zero by 2050 targets, is a clear tailwind. Municipal zoning and provincial approvals remain decisive in siting outcomes. Capstone’s proactive stakeholder engagement limits political friction and accelerates approvals.
Indigenous partnerships
Federal Impact Assessment Act (2019) and growing provincial policies increasingly require Indigenous consultation and benefit‑sharing; 2021 Census records 1.8 million Indigenous people (5.0% of Canada), increasing political weight. Partnerships can enhance social licence, access to financing and bid competitiveness, and political support favors projects with Indigenous equity participation. Capstone’s co‑development models can help de‑risk approvals.
- Policy: IAA 2019 — mandatory consultation
- Demographics: 1.8M Indigenous (2021 Census)
- Benefit: equity participation improves approvals/financing
U.S.-Canada dynamics
U.S.-Canada dynamics drive Capstone: cross-border trade exceeding US$700 billion annually and IRA's roughly US$369 billion in clean energy incentives reshape supply chains, while Buy American rules and IRA-linked incentives tilt equipment pricing and availability for Canadian projects, altering capital flows and timelines; transmission interties and export markets (several GW of cross-border capacity) depend on bilateral cooperation, so aligning procurement to prevailing incentives preserves margin and market access.
- Trade: >US$700B
- IRA: ~US$369B
- Buy American: impacts sourcing/costs
- Interties: several GW, require bilateral policy
- Capstone: alignment = tax credits, supply reliability
Policy drive: federal funds, carbon pricing and Buy American reshape power procurement
Federal and provincial priorities (US BIL $1.2T, IRA ~$369B; Canada Investing in Canada ~$180B) accelerate grid and clean-energy procurement, favoring utilities.
Carbon policy (CA CAD65/t 2023 → ~CAD170/t by 2030) and provincial schemes compress gas margins and improve PPA economics for renewables.
Indigenous consultation (1.8M, 2021) and IAA 2019 raise approval requirements; equity partnerships ease financing.
Buy American, cross‑border trade >US$700B and intertie rules shift sourcing, tax credits and timelines.
| Metric | Value |
|---|---|
| US IRA/BIL | $369B / $1.2T |
| Canada carbon | CAD65/t (2023) → ~CAD170/t (2030) |
What is included in the product
Detailed Word Document
Explores how Political, Economic, Social, Technological, Environmental and Legal factors uniquely affect Capstone Infrastructure, with data-backed trends and region-specific examples; delivered in clean, ready-to-use format to support executives, investors and scenario planning with forward-looking insights.
Customizable Excel Spreadsheet
A concise, visually segmented PESTLE summary for Capstone Infrastructure that clarifies external risks and opportunities, is easily droppable into presentations, shareable across teams, and editable with region- or business-line–specific notes for faster planning and alignment.
Economic factors
Interest rates
Higher interest rates (Bank of Canada policy rate ~5.00% and 10-year Canada yield ~3.5% in mid-2025) lift WACC and compress project IRRs; long-duration PPAs (typically 15–25 years) and CPI-linked contracts help offset rising financing costs. Refinancing windows and staggered debt maturities are critical to cash-flow stability for Capstone, which can pace asset growth to align with rate cycles.
PPA pricing
Corporate and utility demand anchors long-term offtake prices, with rising corporate PPA activity tightening forward curves and supporting contract premiums. Greater merchant price volatility elevates the value of contracted revenue, reducing exposure to short-term spikes and troughs. Counterparty credit quality directly impacts financing costs and asset valuation through rating-driven covenants and tenor availability. Capstone’s disciplined contracting strategy prioritizes high-credit counterparties and staggered tenors to secure predictable returns.
Inflation and costs
Turbine, panel and EPC costs remain highly sensitive to commodity and logistics trends, driving capex volatility across projects. Index-linked PPAs and O&M escalators are commonly used to protect margins against inflationary pressure. Supply-chain localization can reduce exposure to global shocks but typically increases near-term capex. Focused asset optimization programs raise energy output per dollar invested, improving project economics.
Power demand growth
Data centers, electrification and rising EV adoption are driving load growth; data centers account for roughly 1% of global electricity use (~200 TWh annually) and EV market share has climbed into double digits, lifting long‑run demand forecasts. Tight supply elevates capacity and ancillary services; gas peakers retain value in scarcity events while storage arbitrage expands as battery costs fall and dispatch value rises. Capstone can prioritize provinces with stronger demand trajectories and constrained reserve margins.
- Data centers ~1% global electricity (~200 TWh)
- EVs: double‑digit global market share
- Capacity & ancillary services pricier in tight markets
- Gas peakers benefit in scarcity; storage grows via arbitrage
- Target provinces with robust demand and tight reserves
FX exposure
CAD-USD volatility directly alters imported equipment costs and U.S.-linked revenues; USD/CAD averaged about 1.34 in 2024 after a ~6% CAD depreciation versus 2022–23, raising dollar-denominated capex. Active hedging policies during construction can lock-in rates and stabilize project IRRs. Aligning debt currency with cash flows and jurisdictional diversification smooths earnings volatility.
- FX rate (USD/CAD 2024 avg) 1.34
- CAD change 2022–24 ≈ -6%
- Hedging reduces construction-rate risk
- Currency-aligned debt lowers FX mismatch
- Diversification smooths revenue swings
Policy drive: federal funds, carbon pricing and Buy American reshape power procurement
Higher rates (BoC ~5.00%, Canada 10y ~3.5% mid‑2025) lift WACC; long PPAs/CPI links mitigate. Corporate PPA growth tightens curves; counterparty credit affects financing costs. Capex inflation and USD/CAD (2024 avg 1.34; CAD ≈ -6% 2022–24) raise project costs; hedging and currency‑aligned debt reduce risk.
| Metric | Value |
|---|---|
| BoC policy rate | ~5.00% (mid‑2025) |
| Canada 10y | ~3.5% |
| USD/CAD | 1.34 (2024 avg) |
| Data centers | ~200 TWh (~1% global) |
Same Document Delivered
Capstone Infrastructure PESTLE Analysis
The Capstone Infrastructure PESTLE Analysis provides a concise evaluation of political, economic, social, technological, legal and environmental factors affecting operations. The preview shown here is the exact document you’ll receive after purchase—fully formatted and ready to use. It is practitioner-focused, data-driven, and immediately actionable.











