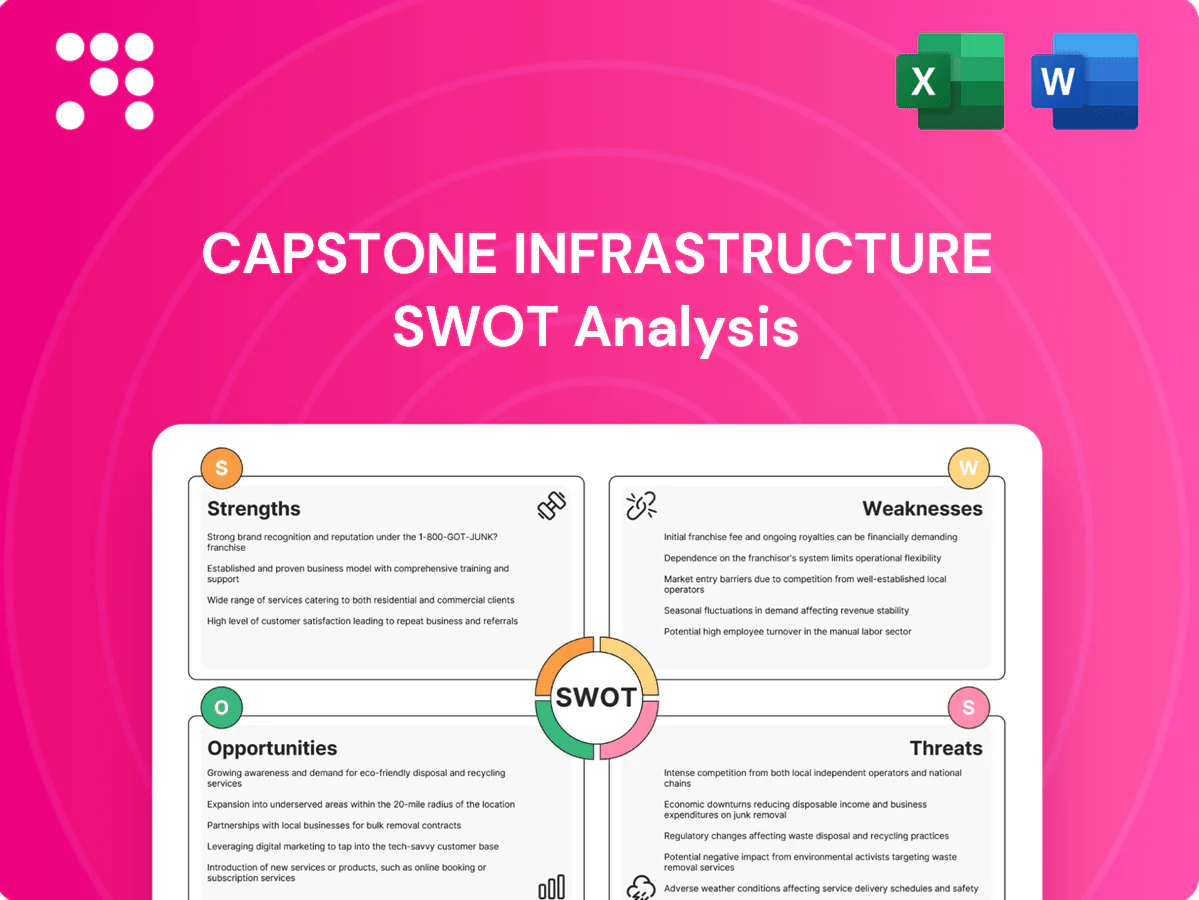
Capstone Infrastructure SWOT Analysis

Your Strategic Toolkit Starts Here
Explore Capstone Infrastructure's strategic position with our concise SWOT preview—highlighting its operational strengths, regulatory exposures, and growth catalysts. Want full clarity on risks, financial implications, and tactical recommendations? Purchase the complete SWOT for a ready-to-use Word and Excel package to plan, pitch, or invest with confidence.
Strengths

Diversified asset mix
Capstone’s diversified asset mix across five technologies—wind, solar, hydro, natural gas and utilities—reduces portfolio volatility and smooths cash flows by combining intermittent renewables with dispatchable thermal and contracted utility revenues; complementary generation profiles lower peak exposure and improve dispatchability, enhancing resilience across market cycles and supporting stable, long-term returns.
Essential-service focus
Capstone’s essential-service focus on power and utilities supports predictable demand—global electricity demand rose about 3% in 2023 (IEA), strengthening load stability. Essential services underpin revenue visibility and typically lower default risk versus merchant businesses, while long-lived assets (30–50+ year useful lives) deliver durable utility value. These infrastructure-like cash flows align with pension and institutional appetite, where many funds target 5–10% allocations to infrastructure.

North American footprint
Capstone's North American footprint leverages mature regimes and deep capital markets—NYSE/NASDAQ >$40T, TSX >C$3T—to access financing. Provincial/state decarbonization (Canada net-zero 2050; US NDC 50–52% GHG cut by 2030) and aging grids create reliability-driven demand. Local contractor and supply networks reduce execution risk and enable scalable project growth across the region.

Development and acquisition capability
Capstone leverages a dual growth engine: organic development plus strategic M&A across Canada, the US and Chile; disciplined screening, rigorous due diligence and standardized integration drive value by limiting execution risk and protecting cash yields. A deep project pipeline provides optionality and timing flexibility, while repeatable infrastructure playbooks enable scalable, repeatable asset-level returns.
- Dual growth: development + M&A
- Disciplined screening, rigorous due diligence
- Pipeline optionality and timing flexibility
- Repeatable playbooks across 3 countries
Operational expertise
Capstone Infrastructure leverages deep asset management and O&M optimization to lift portfolio availability above 98% and tighten lifecycle costs, using data-driven performance monitoring and strict cost discipline to improve operating margins and extend asset life, supporting higher IRR for investors (2024 AUM ~CAD 2.5B).
- Operational expertise
- O&M optimization
- Availability >98%
- Data-driven monitoring
- Cost discipline
- Stronger stakeholder/regulatory engagement
Diversified renewables+gas stabilize cash flows — AUM CAD2.5B, avail >98%
Capstone’s diversified mix (wind, solar, hydro, gas, utilities) pairs intermittent and dispatchable assets to stabilize cash flows and support long-term returns. AUM ~CAD2.5B; availability >98% and 2023 global electricity demand +3% (IEA) bolster revenue visibility. North American focus accesses deep capital markets (TSX >C$3T; NYSE/NASDAQ >$40T) and utility-driven demand.
| Metric | Value |
|---|---|
| AUM | ~CAD 2.5B (2024) |
| Availability | >98% |
| Electricity demand | +3% (2023, IEA) |
| Markets | Canada, US, Chile |
What is included in the product
 Detailed Word Document
Provides a concise strategic overview of Capstone Infrastructure’s internal strengths and weaknesses and external opportunities and threats, highlighting competitive position, growth drivers, operational gaps, and key market risks shaping future performance.

 Customizable Excel Spreadsheet
Provides a concise, executive-ready SWOT matrix for Capstone Infrastructure that streamlines stakeholder alignment and accelerates decision-making; editable format enables quick updates as priorities shift.
Weaknesses

Capital intensity
Capital intensity forces Capstone into large upfront capex—often hundreds of millions per project—with typical payback horizons of 10–25 years, increasing reliance on external debt and periodic equity issuance to fund growth. Construction delays and budget overruns materially erode projected IRRs and cashflow timing, heightening refinancing risk. Persistent funding needs can drive dilution through equity raises or constrain leverage capacity under covenants, limiting strategic flexibility.
Regulatory dependence
Regulatory dependence exposes Capstone to permitting, interconnection and utility commission rulings that can delay projects—interconnection backlogs in North America commonly exceed 24 months—raising carrying costs. Tariff structures and incentive shifts can swing project IRRs by several hundred basis points, directly affecting valuations. Complexity across multiple jurisdictions increases legal and compliance burdens, with monitoring and reporting often adding meaningful ongoing costs to operating cash flow.

Interest-rate exposure
Higher interest rates lift WACC and compress infrastructure valuations, with global 10-year government yields remaining well above pre‑pandemic levels through 2024–25, reducing asset price multiples.
Refinancing risk is material for mid‑life projects as maturing facilities face higher coupon resets and tighter credit spreads, increasing cash‑flow strain.
Capstone competes with higher‑yield corporate and real‑asset capital, while hedging programs have tenor limits, creating duration mismatches between long‑dated asset cash flows and shorter‑dated debt.

Merchant/price risk
Merchant/price risk arises where Capstone assets transition from contracted to merchant exposure, leaving revenues tied to volatile power and gas markets and amplifying earnings variability absent full hedging.
Basis risk and curtailment in congested nodes can force generation to accept locational price discounts or be curtailed during transmission constraints, reducing realized margins.
Power and gas price volatility increases short-term cash flow swings and can magnify downside in uncontracted periods.
- Contracts roll-off exposure
- Basis risk at congested nodes
- Curtailment reduces dispatched revenue
- Earnings variability without full hedging
Scale vs. peers
Capstone is smaller than integrated peers that benefit from lower capital costs and larger project pipelines, which can reduce competitiveness in procurement and auctions; this often forces Capstone to rely on higher-cost equity or joint-venture structures. Its balance sheet and risk appetite limit absorption of mega-project overruns, increasing execution and refinancing risk. For very large builds, Capstone depends on partnerships and consortiums to win and finance work, which can dilute margins and control.
- Scale gap vs integrated peers
- Procurement/auction competitiveness
- Limited mega-project risk capacity
- Dependence on partnerships
Capex $100–500m, 10–25yr paybacks, 24+mo interconnection backlog
Capital intensity (typical project capex $100–500m) and 10–25 year paybacks force heavy debt/equity use, raising dilution and refinancing risk. Regulatory/interconnection delays (backlogs often 24+ months) and tariff shifts can swing IRRs by several hundred bps. Higher rates (US 10‑yr ~4.0–4.5% in 2024–25) compress valuations and tighten refinancing for mid‑life assets. Scale shortfall vs integrated peers limits procurement and mega‑project capacity.
| Metric | Value |
|---|---|
| Typical project capex | $100–500m |
| Payback horizon | 10–25 years |
| Interconnection backlog | 24+ months |
| US 10‑yr yield (2024–25) | ~4.0–4.5% |
What You See Is What You Get
Capstone Infrastructure SWOT Analysis
This is the actual Capstone Infrastructure SWOT analysis document you’ll receive upon purchase—no surprises, just professional quality. The preview below is taken directly from the full report; buy to unlock the complete, editable version ready for immediate download.

Your Strategic Toolkit Starts Here
Explore Capstone Infrastructure's strategic position with our concise SWOT preview—highlighting its operational strengths, regulatory exposures, and growth catalysts. Want full clarity on risks, financial implications, and tactical recommendations? Purchase the complete SWOT for a ready-to-use Word and Excel package to plan, pitch, or invest with confidence.
Strengths
Diversified asset mix
Capstone’s diversified asset mix across five technologies—wind, solar, hydro, natural gas and utilities—reduces portfolio volatility and smooths cash flows by combining intermittent renewables with dispatchable thermal and contracted utility revenues; complementary generation profiles lower peak exposure and improve dispatchability, enhancing resilience across market cycles and supporting stable, long-term returns.
Essential-service focus
Capstone’s essential-service focus on power and utilities supports predictable demand—global electricity demand rose about 3% in 2023 (IEA), strengthening load stability. Essential services underpin revenue visibility and typically lower default risk versus merchant businesses, while long-lived assets (30–50+ year useful lives) deliver durable utility value. These infrastructure-like cash flows align with pension and institutional appetite, where many funds target 5–10% allocations to infrastructure.
North American footprint
Capstone's North American footprint leverages mature regimes and deep capital markets—NYSE/NASDAQ >$40T, TSX >C$3T—to access financing. Provincial/state decarbonization (Canada net-zero 2050; US NDC 50–52% GHG cut by 2030) and aging grids create reliability-driven demand. Local contractor and supply networks reduce execution risk and enable scalable project growth across the region.
Development and acquisition capability
Capstone leverages a dual growth engine: organic development plus strategic M&A across Canada, the US and Chile; disciplined screening, rigorous due diligence and standardized integration drive value by limiting execution risk and protecting cash yields. A deep project pipeline provides optionality and timing flexibility, while repeatable infrastructure playbooks enable scalable, repeatable asset-level returns.
- Dual growth: development + M&A
- Disciplined screening, rigorous due diligence
- Pipeline optionality and timing flexibility
- Repeatable playbooks across 3 countries
Operational expertise
Capstone Infrastructure leverages deep asset management and O&M optimization to lift portfolio availability above 98% and tighten lifecycle costs, using data-driven performance monitoring and strict cost discipline to improve operating margins and extend asset life, supporting higher IRR for investors (2024 AUM ~CAD 2.5B).
- Operational expertise
- O&M optimization
- Availability >98%
- Data-driven monitoring
- Cost discipline
- Stronger stakeholder/regulatory engagement
Diversified renewables+gas stabilize cash flows — AUM CAD2.5B, avail >98%
Capstone’s diversified mix (wind, solar, hydro, gas, utilities) pairs intermittent and dispatchable assets to stabilize cash flows and support long-term returns. AUM ~CAD2.5B; availability >98% and 2023 global electricity demand +3% (IEA) bolster revenue visibility. North American focus accesses deep capital markets (TSX >C$3T; NYSE/NASDAQ >$40T) and utility-driven demand.
| Metric | Value |
|---|---|
| AUM | ~CAD 2.5B (2024) |
| Availability | >98% |
| Electricity demand | +3% (2023, IEA) |
| Markets | Canada, US, Chile |
What is included in the product
Detailed Word Document
Provides a concise strategic overview of Capstone Infrastructure’s internal strengths and weaknesses and external opportunities and threats, highlighting competitive position, growth drivers, operational gaps, and key market risks shaping future performance.
Customizable Excel Spreadsheet
Provides a concise, executive-ready SWOT matrix for Capstone Infrastructure that streamlines stakeholder alignment and accelerates decision-making; editable format enables quick updates as priorities shift.
Weaknesses
Capital intensity
Capital intensity forces Capstone into large upfront capex—often hundreds of millions per project—with typical payback horizons of 10–25 years, increasing reliance on external debt and periodic equity issuance to fund growth. Construction delays and budget overruns materially erode projected IRRs and cashflow timing, heightening refinancing risk. Persistent funding needs can drive dilution through equity raises or constrain leverage capacity under covenants, limiting strategic flexibility.
Regulatory dependence
Regulatory dependence exposes Capstone to permitting, interconnection and utility commission rulings that can delay projects—interconnection backlogs in North America commonly exceed 24 months—raising carrying costs. Tariff structures and incentive shifts can swing project IRRs by several hundred basis points, directly affecting valuations. Complexity across multiple jurisdictions increases legal and compliance burdens, with monitoring and reporting often adding meaningful ongoing costs to operating cash flow.
Interest-rate exposure
Higher interest rates lift WACC and compress infrastructure valuations, with global 10-year government yields remaining well above pre‑pandemic levels through 2024–25, reducing asset price multiples.
Refinancing risk is material for mid‑life projects as maturing facilities face higher coupon resets and tighter credit spreads, increasing cash‑flow strain.
Capstone competes with higher‑yield corporate and real‑asset capital, while hedging programs have tenor limits, creating duration mismatches between long‑dated asset cash flows and shorter‑dated debt.
Merchant/price risk
Merchant/price risk arises where Capstone assets transition from contracted to merchant exposure, leaving revenues tied to volatile power and gas markets and amplifying earnings variability absent full hedging.
Basis risk and curtailment in congested nodes can force generation to accept locational price discounts or be curtailed during transmission constraints, reducing realized margins.
Power and gas price volatility increases short-term cash flow swings and can magnify downside in uncontracted periods.
- Contracts roll-off exposure
- Basis risk at congested nodes
- Curtailment reduces dispatched revenue
- Earnings variability without full hedging
Scale vs. peers
Capstone is smaller than integrated peers that benefit from lower capital costs and larger project pipelines, which can reduce competitiveness in procurement and auctions; this often forces Capstone to rely on higher-cost equity or joint-venture structures. Its balance sheet and risk appetite limit absorption of mega-project overruns, increasing execution and refinancing risk. For very large builds, Capstone depends on partnerships and consortiums to win and finance work, which can dilute margins and control.
- Scale gap vs integrated peers
- Procurement/auction competitiveness
- Limited mega-project risk capacity
- Dependence on partnerships
Capex $100–500m, 10–25yr paybacks, 24+mo interconnection backlog
Capital intensity (typical project capex $100–500m) and 10–25 year paybacks force heavy debt/equity use, raising dilution and refinancing risk. Regulatory/interconnection delays (backlogs often 24+ months) and tariff shifts can swing IRRs by several hundred bps. Higher rates (US 10‑yr ~4.0–4.5% in 2024–25) compress valuations and tighten refinancing for mid‑life assets. Scale shortfall vs integrated peers limits procurement and mega‑project capacity.
| Metric | Value |
|---|---|
| Typical project capex | $100–500m |
| Payback horizon | 10–25 years |
| Interconnection backlog | 24+ months |
| US 10‑yr yield (2024–25) | ~4.0–4.5% |
What You See Is What You Get
Capstone Infrastructure SWOT Analysis
This is the actual Capstone Infrastructure SWOT analysis document you’ll receive upon purchase—no surprises, just professional quality. The preview below is taken directly from the full report; buy to unlock the complete, editable version ready for immediate download.
Original: $10.00
-65%$10.00
$3.50Description
Your Strategic Toolkit Starts Here
Explore Capstone Infrastructure's strategic position with our concise SWOT preview—highlighting its operational strengths, regulatory exposures, and growth catalysts. Want full clarity on risks, financial implications, and tactical recommendations? Purchase the complete SWOT for a ready-to-use Word and Excel package to plan, pitch, or invest with confidence.
Strengths
Diversified asset mix
Capstone’s diversified asset mix across five technologies—wind, solar, hydro, natural gas and utilities—reduces portfolio volatility and smooths cash flows by combining intermittent renewables with dispatchable thermal and contracted utility revenues; complementary generation profiles lower peak exposure and improve dispatchability, enhancing resilience across market cycles and supporting stable, long-term returns.
Essential-service focus
Capstone’s essential-service focus on power and utilities supports predictable demand—global electricity demand rose about 3% in 2023 (IEA), strengthening load stability. Essential services underpin revenue visibility and typically lower default risk versus merchant businesses, while long-lived assets (30–50+ year useful lives) deliver durable utility value. These infrastructure-like cash flows align with pension and institutional appetite, where many funds target 5–10% allocations to infrastructure.
North American footprint
Capstone's North American footprint leverages mature regimes and deep capital markets—NYSE/NASDAQ >$40T, TSX >C$3T—to access financing. Provincial/state decarbonization (Canada net-zero 2050; US NDC 50–52% GHG cut by 2030) and aging grids create reliability-driven demand. Local contractor and supply networks reduce execution risk and enable scalable project growth across the region.
Development and acquisition capability
Capstone leverages a dual growth engine: organic development plus strategic M&A across Canada, the US and Chile; disciplined screening, rigorous due diligence and standardized integration drive value by limiting execution risk and protecting cash yields. A deep project pipeline provides optionality and timing flexibility, while repeatable infrastructure playbooks enable scalable, repeatable asset-level returns.
- Dual growth: development + M&A
- Disciplined screening, rigorous due diligence
- Pipeline optionality and timing flexibility
- Repeatable playbooks across 3 countries
Operational expertise
Capstone Infrastructure leverages deep asset management and O&M optimization to lift portfolio availability above 98% and tighten lifecycle costs, using data-driven performance monitoring and strict cost discipline to improve operating margins and extend asset life, supporting higher IRR for investors (2024 AUM ~CAD 2.5B).
- Operational expertise
- O&M optimization
- Availability >98%
- Data-driven monitoring
- Cost discipline
- Stronger stakeholder/regulatory engagement
Diversified renewables+gas stabilize cash flows — AUM CAD2.5B, avail >98%
Capstone’s diversified mix (wind, solar, hydro, gas, utilities) pairs intermittent and dispatchable assets to stabilize cash flows and support long-term returns. AUM ~CAD2.5B; availability >98% and 2023 global electricity demand +3% (IEA) bolster revenue visibility. North American focus accesses deep capital markets (TSX >C$3T; NYSE/NASDAQ >$40T) and utility-driven demand.
| Metric | Value |
|---|---|
| AUM | ~CAD 2.5B (2024) |
| Availability | >98% |
| Electricity demand | +3% (2023, IEA) |
| Markets | Canada, US, Chile |
What is included in the product
Detailed Word Document
Provides a concise strategic overview of Capstone Infrastructure’s internal strengths and weaknesses and external opportunities and threats, highlighting competitive position, growth drivers, operational gaps, and key market risks shaping future performance.
Customizable Excel Spreadsheet
Provides a concise, executive-ready SWOT matrix for Capstone Infrastructure that streamlines stakeholder alignment and accelerates decision-making; editable format enables quick updates as priorities shift.
Weaknesses
Capital intensity
Capital intensity forces Capstone into large upfront capex—often hundreds of millions per project—with typical payback horizons of 10–25 years, increasing reliance on external debt and periodic equity issuance to fund growth. Construction delays and budget overruns materially erode projected IRRs and cashflow timing, heightening refinancing risk. Persistent funding needs can drive dilution through equity raises or constrain leverage capacity under covenants, limiting strategic flexibility.
Regulatory dependence
Regulatory dependence exposes Capstone to permitting, interconnection and utility commission rulings that can delay projects—interconnection backlogs in North America commonly exceed 24 months—raising carrying costs. Tariff structures and incentive shifts can swing project IRRs by several hundred basis points, directly affecting valuations. Complexity across multiple jurisdictions increases legal and compliance burdens, with monitoring and reporting often adding meaningful ongoing costs to operating cash flow.
Interest-rate exposure
Higher interest rates lift WACC and compress infrastructure valuations, with global 10-year government yields remaining well above pre‑pandemic levels through 2024–25, reducing asset price multiples.
Refinancing risk is material for mid‑life projects as maturing facilities face higher coupon resets and tighter credit spreads, increasing cash‑flow strain.
Capstone competes with higher‑yield corporate and real‑asset capital, while hedging programs have tenor limits, creating duration mismatches between long‑dated asset cash flows and shorter‑dated debt.
Merchant/price risk
Merchant/price risk arises where Capstone assets transition from contracted to merchant exposure, leaving revenues tied to volatile power and gas markets and amplifying earnings variability absent full hedging.
Basis risk and curtailment in congested nodes can force generation to accept locational price discounts or be curtailed during transmission constraints, reducing realized margins.
Power and gas price volatility increases short-term cash flow swings and can magnify downside in uncontracted periods.
- Contracts roll-off exposure
- Basis risk at congested nodes
- Curtailment reduces dispatched revenue
- Earnings variability without full hedging
Scale vs. peers
Capstone is smaller than integrated peers that benefit from lower capital costs and larger project pipelines, which can reduce competitiveness in procurement and auctions; this often forces Capstone to rely on higher-cost equity or joint-venture structures. Its balance sheet and risk appetite limit absorption of mega-project overruns, increasing execution and refinancing risk. For very large builds, Capstone depends on partnerships and consortiums to win and finance work, which can dilute margins and control.
- Scale gap vs integrated peers
- Procurement/auction competitiveness
- Limited mega-project risk capacity
- Dependence on partnerships
Capex $100–500m, 10–25yr paybacks, 24+mo interconnection backlog
Capital intensity (typical project capex $100–500m) and 10–25 year paybacks force heavy debt/equity use, raising dilution and refinancing risk. Regulatory/interconnection delays (backlogs often 24+ months) and tariff shifts can swing IRRs by several hundred bps. Higher rates (US 10‑yr ~4.0–4.5% in 2024–25) compress valuations and tighten refinancing for mid‑life assets. Scale shortfall vs integrated peers limits procurement and mega‑project capacity.
| Metric | Value |
|---|---|
| Typical project capex | $100–500m |
| Payback horizon | 10–25 years |
| Interconnection backlog | 24+ months |
| US 10‑yr yield (2024–25) | ~4.0–4.5% |
What You See Is What You Get
Capstone Infrastructure SWOT Analysis
This is the actual Capstone Infrastructure SWOT analysis document you’ll receive upon purchase—no surprises, just professional quality. The preview below is taken directly from the full report; buy to unlock the complete, editable version ready for immediate download.











