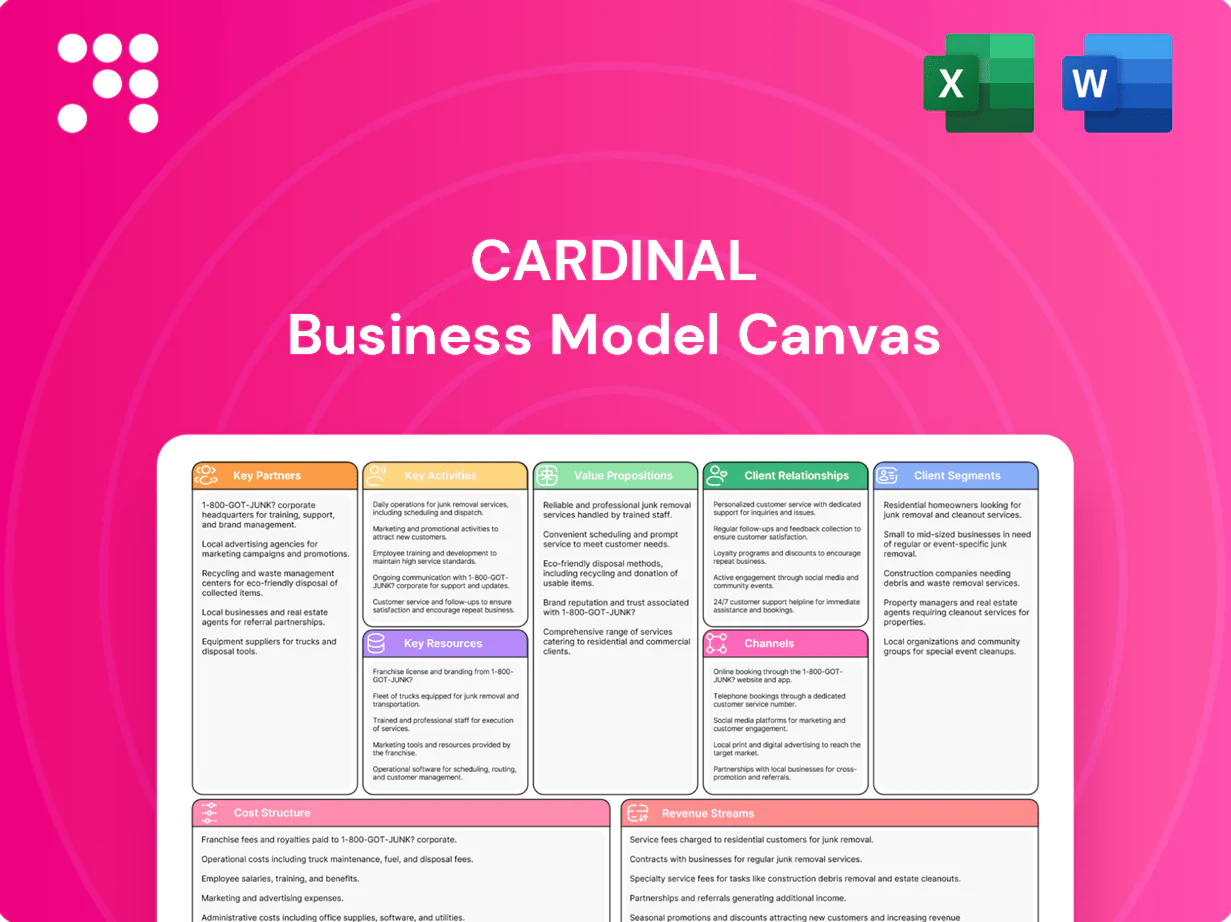
Cardinal Business Model Canvas

Unlock the Strategic Business Model Canvas: Roadmap for Scaling Value and Revenue
Unlock Cardinal's strategic blueprint with our full Business Model Canvas. This concise, company-specific analysis maps value propositions, revenue streams, key partners and cost structure to show how Cardinal wins and scales. Ideal for investors, founders, and consultants—download the editable Word and Excel files to benchmark and adapt these proven strategies for your own growth.
Partnerships

Midstream and pipeline operators
Partnerships with midstream and pipeline operators enable evacuation of Alberta (~3.7 million b/d) and Saskatchewan (~0.6 million b/d) crude and gas (2024, Natural Resources Canada). These partners supply gathering, processing, fractionation and takeaway capacity—Western Canada takeaway capacity was roughly 4.5 million b/d in 2024. Secure access via long‑term agreements reduces basis risk, limits downtime and locks cost predictability.
Oilfield services and drilling contractors
Rigs, completions crews and specialist service providers are core to safe, efficient development, with coordinated scheduling shown to cut non-productive time by 10–20% in industry studies (2024). Preferred vendor programs commonly reduce procurement and service costs 5–10% while improving HSE metrics. Technology-enabled partners—real-time analytics, automation and advanced completions—can boost recovery and slow decline rates by roughly 5–15%.

Refineries, marketers, and gas buyers
Offtake partners buy light, medium and heavy crude plus natural gas and NGLs, matching Cardinal’s varied production slate to market needs. Marketing relationships improve netbacks through optimized blending, timing and delivery points, capturing value across regional spreads. Term and spot arrangements diversify demand and price exposure; global oil demand in 2024 averaged about 101.6 million b/d (IEA). Creditworthy buyers materially reduce counterparty risk.

Regulators, municipalities, and Indigenous communities
Constructive relationships with regulators, municipalities, and Indigenous communities streamline approvals and compliance, often shortening review timelines and lowering legal risk; Indigenous peoples represent about 5% of Canada’s population (2021 census), underscoring the importance of engagement. Collaboration on land stewardship and reclamation mitigates environmental impact and maintains social license, while transparent communication reduces project delays and unforeseen costs.
- Regulatory alignment: faster permitting, lower legal risk
- Social license: Indigenous engagement critical to community acceptance
- Environmental: joint reclamation lowers restoration costs
- Transparency: fewer delays, clearer timelines
Banks, investors, and hedge counterparties
Banks provide acquisition and development credit facilities and capital-markets access, with global syndicated loan volume around $1.3 trillion in 2024 supporting buyouts and project finance. Hedge counterparties enable price-risk management—global OTC derivatives notionals exceeded $600 trillion in 2024 (ISDA). Investor partners back a balanced dividend-and-growth policy while covenants and reporting discipline steer capital allocation.
- Credit: syndicated loans ~$1.3T (2024)
- Hedges: OTC notionals >$600T (ISDA 2024)
- Investors: dividend + growth capital
- Governance: covenants, reporting drive allocation
4.5M b/d; NPT −10–20%; recov +5–15%
Partnerships with midstream/pipeline operators secure evacuation of Alberta ~3.7M b/d and Saskatchewan ~0.6M b/d (2024), matching ~4.5M b/d Western Canada takeaway capacity to reduce basis risk. Service vendors and tech partners cut NPT 10–20% and can boost recovery 5–15%. Banks, hedge counterparties and offtakers (syndicated loans ~$1.3T; OTC notionals >$600T) provide capital, price risk mitigation and market access.
| Partner type | Role | Key metric |
|---|---|---|
| Midstream | Evacuation, fractionation | 4.5M b/d takeaway (2024) |
| Service/Tech | Operations, recovery | NPT −10–20%; +5–15% recovery |
| Offtake | Marketing, netbacks | Global demand 101.6M b/d (2024) |
| Finance | Capital, hedging | Syndicated loans $1.3T; OTC >$600T |
What is included in the product
 Detailed Word Document
A comprehensive Cardinal Business Model Canvas presenting nine BMC blocks with narrative, value propositions, customer segments, channels and revenue models, plus SWOT-linked competitive analysis and polished visuals for investor or internal use.

 Customizable Excel Spreadsheet
Streamlines business model mapping into an editable one-page canvas, saving hours of formatting and structuring while enabling fast team collaboration, side-by-side comparisons, and quick executive summaries.
Activities

Acquire and integrate Western Canadian assets
Identify, evaluate and transact on Western Canadian oil and gas assets delivering scale (typically >1,000 boe/d) and low-decline conventional reservoirs (target decline <10%/yr) with optimization upside; prioritize deals at disciplined EV/boe multiples consistent with 2024 Canadian M&A conditions. Execute integrated transitions of operations and systems to maintain uptime and HSE performance. Capture synergies in overhead, marketing and field ops to reduce G&A and lift netbacks by targeted mid-single-digit percentages.
Exploration, drilling, and completions
Plan and drill development wells across targeted plays to capture upside in a market where US crude production averaged about 13.0 million b/d in 2024 (EIA). Optimize completions to enhance recovery while managing per-well spend through staged-frac designs and cost controls. Apply data-driven geoscience to delineate inventory and prioritize high-ROI targets. Maintain rigorous safety and environmental best practices throughout operations.

Production optimization and enhanced recovery
Use targeted workovers, artificial lift, and facility debottlenecking to uplift production; artificial lift is applied in about 70% of producing wells globally. Implement waterfloods and other secondary recovery where economic—waterfloods can add roughly 5–20% recovery of OOIP. Monitor decline trends and leverage real-time field data for proactive maintenance to sustain volumes and cut unplanned downtime.

Marketing, hedging, and logistics management
Align product streams with best netback markets—US crude production averaged about 13.0 million bpd in 2024, guiding market selection; execute hedges to stabilize cash flows and support dividends; coordinate pipeline, rail and truck logistics to minimize downtime with pipeline utilization >90% in 2024; manage basis and quality differentials actively to protect realized prices.
- [netback]
- [hedge]
- [logistics]
- [basis_quality]
ESG compliance, safety, and reclamation
Operate under Alberta Energy Regulator and Saskatchewan Ministry of Environment rules, aligning with Canada’s NDC to cut GHGs 40–45% below 2005 levels by 2030 and the oil and gas methane 75% reduction by 2030. Focus on emissions reductions, water stewardship, and responsible waste handling, with transparent community engagement and reporting. Remediate and reclaim sites to meet or exceed provincial standards.
- Regulatory: AER, Saskatchewan MoECC
- Targets: GHG −40–45% by 2030; methane −75% by 2030
- Actions: emissions, water, waste, community reporting, reclamation
Acquire Western Canadian oil & gas assets ≥ 1,000 boe/d, decline under 10%/yr, lift netbacks
Identify, evaluate and transact on Western Canadian oil and gas assets >1,000 boe/d with target decline <10%/yr and disciplined EV/boe pricing aligned with 2024 Canadian M&A. Execute seamless ops/system transitions to preserve uptime and HSE, capture G&A and marketing synergies to lift netbacks mid-single-digits. Drill high-ROI wells, optimize completions, apply data-driven reservoir work, use waterfloods (5–20% OOIP uplift) and artificial lift (~70% usage).
Delivered as Displayed
Business Model Canvas
The Cardinal Business Model Canvas you see here is the actual deliverable, not a mockup, and it reflects the same content and layout you’ll receive after purchase. Once you complete your order, you’ll get this exact file instantly—fully formatted and editable in Word and Excel. No surprises, just the ready-to-use document shown in the preview.

Unlock the Strategic Business Model Canvas: Roadmap for Scaling Value and Revenue
Unlock Cardinal's strategic blueprint with our full Business Model Canvas. This concise, company-specific analysis maps value propositions, revenue streams, key partners and cost structure to show how Cardinal wins and scales. Ideal for investors, founders, and consultants—download the editable Word and Excel files to benchmark and adapt these proven strategies for your own growth.
Partnerships
Midstream and pipeline operators
Partnerships with midstream and pipeline operators enable evacuation of Alberta (~3.7 million b/d) and Saskatchewan (~0.6 million b/d) crude and gas (2024, Natural Resources Canada). These partners supply gathering, processing, fractionation and takeaway capacity—Western Canada takeaway capacity was roughly 4.5 million b/d in 2024. Secure access via long‑term agreements reduces basis risk, limits downtime and locks cost predictability.
Oilfield services and drilling contractors
Rigs, completions crews and specialist service providers are core to safe, efficient development, with coordinated scheduling shown to cut non-productive time by 10–20% in industry studies (2024). Preferred vendor programs commonly reduce procurement and service costs 5–10% while improving HSE metrics. Technology-enabled partners—real-time analytics, automation and advanced completions—can boost recovery and slow decline rates by roughly 5–15%.
Refineries, marketers, and gas buyers
Offtake partners buy light, medium and heavy crude plus natural gas and NGLs, matching Cardinal’s varied production slate to market needs. Marketing relationships improve netbacks through optimized blending, timing and delivery points, capturing value across regional spreads. Term and spot arrangements diversify demand and price exposure; global oil demand in 2024 averaged about 101.6 million b/d (IEA). Creditworthy buyers materially reduce counterparty risk.
Regulators, municipalities, and Indigenous communities
Constructive relationships with regulators, municipalities, and Indigenous communities streamline approvals and compliance, often shortening review timelines and lowering legal risk; Indigenous peoples represent about 5% of Canada’s population (2021 census), underscoring the importance of engagement. Collaboration on land stewardship and reclamation mitigates environmental impact and maintains social license, while transparent communication reduces project delays and unforeseen costs.
- Regulatory alignment: faster permitting, lower legal risk
- Social license: Indigenous engagement critical to community acceptance
- Environmental: joint reclamation lowers restoration costs
- Transparency: fewer delays, clearer timelines
Banks, investors, and hedge counterparties
Banks provide acquisition and development credit facilities and capital-markets access, with global syndicated loan volume around $1.3 trillion in 2024 supporting buyouts and project finance. Hedge counterparties enable price-risk management—global OTC derivatives notionals exceeded $600 trillion in 2024 (ISDA). Investor partners back a balanced dividend-and-growth policy while covenants and reporting discipline steer capital allocation.
- Credit: syndicated loans ~$1.3T (2024)
- Hedges: OTC notionals >$600T (ISDA 2024)
- Investors: dividend + growth capital
- Governance: covenants, reporting drive allocation
4.5M b/d; NPT −10–20%; recov +5–15%
Partnerships with midstream/pipeline operators secure evacuation of Alberta ~3.7M b/d and Saskatchewan ~0.6M b/d (2024), matching ~4.5M b/d Western Canada takeaway capacity to reduce basis risk. Service vendors and tech partners cut NPT 10–20% and can boost recovery 5–15%. Banks, hedge counterparties and offtakers (syndicated loans ~$1.3T; OTC notionals >$600T) provide capital, price risk mitigation and market access.
| Partner type | Role | Key metric |
|---|---|---|
| Midstream | Evacuation, fractionation | 4.5M b/d takeaway (2024) |
| Service/Tech | Operations, recovery | NPT −10–20%; +5–15% recovery |
| Offtake | Marketing, netbacks | Global demand 101.6M b/d (2024) |
| Finance | Capital, hedging | Syndicated loans $1.3T; OTC >$600T |
What is included in the product
Detailed Word Document
A comprehensive Cardinal Business Model Canvas presenting nine BMC blocks with narrative, value propositions, customer segments, channels and revenue models, plus SWOT-linked competitive analysis and polished visuals for investor or internal use.
Customizable Excel Spreadsheet
Streamlines business model mapping into an editable one-page canvas, saving hours of formatting and structuring while enabling fast team collaboration, side-by-side comparisons, and quick executive summaries.
Activities
Acquire and integrate Western Canadian assets
Identify, evaluate and transact on Western Canadian oil and gas assets delivering scale (typically >1,000 boe/d) and low-decline conventional reservoirs (target decline <10%/yr) with optimization upside; prioritize deals at disciplined EV/boe multiples consistent with 2024 Canadian M&A conditions. Execute integrated transitions of operations and systems to maintain uptime and HSE performance. Capture synergies in overhead, marketing and field ops to reduce G&A and lift netbacks by targeted mid-single-digit percentages.
Exploration, drilling, and completions
Plan and drill development wells across targeted plays to capture upside in a market where US crude production averaged about 13.0 million b/d in 2024 (EIA). Optimize completions to enhance recovery while managing per-well spend through staged-frac designs and cost controls. Apply data-driven geoscience to delineate inventory and prioritize high-ROI targets. Maintain rigorous safety and environmental best practices throughout operations.
Production optimization and enhanced recovery
Use targeted workovers, artificial lift, and facility debottlenecking to uplift production; artificial lift is applied in about 70% of producing wells globally. Implement waterfloods and other secondary recovery where economic—waterfloods can add roughly 5–20% recovery of OOIP. Monitor decline trends and leverage real-time field data for proactive maintenance to sustain volumes and cut unplanned downtime.
Marketing, hedging, and logistics management
Align product streams with best netback markets—US crude production averaged about 13.0 million bpd in 2024, guiding market selection; execute hedges to stabilize cash flows and support dividends; coordinate pipeline, rail and truck logistics to minimize downtime with pipeline utilization >90% in 2024; manage basis and quality differentials actively to protect realized prices.
- [netback]
- [hedge]
- [logistics]
- [basis_quality]
ESG compliance, safety, and reclamation
Operate under Alberta Energy Regulator and Saskatchewan Ministry of Environment rules, aligning with Canada’s NDC to cut GHGs 40–45% below 2005 levels by 2030 and the oil and gas methane 75% reduction by 2030. Focus on emissions reductions, water stewardship, and responsible waste handling, with transparent community engagement and reporting. Remediate and reclaim sites to meet or exceed provincial standards.
- Regulatory: AER, Saskatchewan MoECC
- Targets: GHG −40–45% by 2030; methane −75% by 2030
- Actions: emissions, water, waste, community reporting, reclamation
Acquire Western Canadian oil & gas assets ≥ 1,000 boe/d, decline under 10%/yr, lift netbacks
Identify, evaluate and transact on Western Canadian oil and gas assets >1,000 boe/d with target decline <10%/yr and disciplined EV/boe pricing aligned with 2024 Canadian M&A. Execute seamless ops/system transitions to preserve uptime and HSE, capture G&A and marketing synergies to lift netbacks mid-single-digits. Drill high-ROI wells, optimize completions, apply data-driven reservoir work, use waterfloods (5–20% OOIP uplift) and artificial lift (~70% usage).
Delivered as Displayed
Business Model Canvas
The Cardinal Business Model Canvas you see here is the actual deliverable, not a mockup, and it reflects the same content and layout you’ll receive after purchase. Once you complete your order, you’ll get this exact file instantly—fully formatted and editable in Word and Excel. No surprises, just the ready-to-use document shown in the preview.
Description
Unlock the Strategic Business Model Canvas: Roadmap for Scaling Value and Revenue
Unlock Cardinal's strategic blueprint with our full Business Model Canvas. This concise, company-specific analysis maps value propositions, revenue streams, key partners and cost structure to show how Cardinal wins and scales. Ideal for investors, founders, and consultants—download the editable Word and Excel files to benchmark and adapt these proven strategies for your own growth.
Partnerships
Midstream and pipeline operators
Partnerships with midstream and pipeline operators enable evacuation of Alberta (~3.7 million b/d) and Saskatchewan (~0.6 million b/d) crude and gas (2024, Natural Resources Canada). These partners supply gathering, processing, fractionation and takeaway capacity—Western Canada takeaway capacity was roughly 4.5 million b/d in 2024. Secure access via long‑term agreements reduces basis risk, limits downtime and locks cost predictability.
Oilfield services and drilling contractors
Rigs, completions crews and specialist service providers are core to safe, efficient development, with coordinated scheduling shown to cut non-productive time by 10–20% in industry studies (2024). Preferred vendor programs commonly reduce procurement and service costs 5–10% while improving HSE metrics. Technology-enabled partners—real-time analytics, automation and advanced completions—can boost recovery and slow decline rates by roughly 5–15%.
Refineries, marketers, and gas buyers
Offtake partners buy light, medium and heavy crude plus natural gas and NGLs, matching Cardinal’s varied production slate to market needs. Marketing relationships improve netbacks through optimized blending, timing and delivery points, capturing value across regional spreads. Term and spot arrangements diversify demand and price exposure; global oil demand in 2024 averaged about 101.6 million b/d (IEA). Creditworthy buyers materially reduce counterparty risk.
Regulators, municipalities, and Indigenous communities
Constructive relationships with regulators, municipalities, and Indigenous communities streamline approvals and compliance, often shortening review timelines and lowering legal risk; Indigenous peoples represent about 5% of Canada’s population (2021 census), underscoring the importance of engagement. Collaboration on land stewardship and reclamation mitigates environmental impact and maintains social license, while transparent communication reduces project delays and unforeseen costs.
- Regulatory alignment: faster permitting, lower legal risk
- Social license: Indigenous engagement critical to community acceptance
- Environmental: joint reclamation lowers restoration costs
- Transparency: fewer delays, clearer timelines
Banks, investors, and hedge counterparties
Banks provide acquisition and development credit facilities and capital-markets access, with global syndicated loan volume around $1.3 trillion in 2024 supporting buyouts and project finance. Hedge counterparties enable price-risk management—global OTC derivatives notionals exceeded $600 trillion in 2024 (ISDA). Investor partners back a balanced dividend-and-growth policy while covenants and reporting discipline steer capital allocation.
- Credit: syndicated loans ~$1.3T (2024)
- Hedges: OTC notionals >$600T (ISDA 2024)
- Investors: dividend + growth capital
- Governance: covenants, reporting drive allocation
4.5M b/d; NPT −10–20%; recov +5–15%
Partnerships with midstream/pipeline operators secure evacuation of Alberta ~3.7M b/d and Saskatchewan ~0.6M b/d (2024), matching ~4.5M b/d Western Canada takeaway capacity to reduce basis risk. Service vendors and tech partners cut NPT 10–20% and can boost recovery 5–15%. Banks, hedge counterparties and offtakers (syndicated loans ~$1.3T; OTC notionals >$600T) provide capital, price risk mitigation and market access.
| Partner type | Role | Key metric |
|---|---|---|
| Midstream | Evacuation, fractionation | 4.5M b/d takeaway (2024) |
| Service/Tech | Operations, recovery | NPT −10–20%; +5–15% recovery |
| Offtake | Marketing, netbacks | Global demand 101.6M b/d (2024) |
| Finance | Capital, hedging | Syndicated loans $1.3T; OTC >$600T |
What is included in the product
Detailed Word Document
A comprehensive Cardinal Business Model Canvas presenting nine BMC blocks with narrative, value propositions, customer segments, channels and revenue models, plus SWOT-linked competitive analysis and polished visuals for investor or internal use.
Customizable Excel Spreadsheet
Streamlines business model mapping into an editable one-page canvas, saving hours of formatting and structuring while enabling fast team collaboration, side-by-side comparisons, and quick executive summaries.
Activities
Acquire and integrate Western Canadian assets
Identify, evaluate and transact on Western Canadian oil and gas assets delivering scale (typically >1,000 boe/d) and low-decline conventional reservoirs (target decline <10%/yr) with optimization upside; prioritize deals at disciplined EV/boe multiples consistent with 2024 Canadian M&A conditions. Execute integrated transitions of operations and systems to maintain uptime and HSE performance. Capture synergies in overhead, marketing and field ops to reduce G&A and lift netbacks by targeted mid-single-digit percentages.
Exploration, drilling, and completions
Plan and drill development wells across targeted plays to capture upside in a market where US crude production averaged about 13.0 million b/d in 2024 (EIA). Optimize completions to enhance recovery while managing per-well spend through staged-frac designs and cost controls. Apply data-driven geoscience to delineate inventory and prioritize high-ROI targets. Maintain rigorous safety and environmental best practices throughout operations.
Production optimization and enhanced recovery
Use targeted workovers, artificial lift, and facility debottlenecking to uplift production; artificial lift is applied in about 70% of producing wells globally. Implement waterfloods and other secondary recovery where economic—waterfloods can add roughly 5–20% recovery of OOIP. Monitor decline trends and leverage real-time field data for proactive maintenance to sustain volumes and cut unplanned downtime.
Marketing, hedging, and logistics management
Align product streams with best netback markets—US crude production averaged about 13.0 million bpd in 2024, guiding market selection; execute hedges to stabilize cash flows and support dividends; coordinate pipeline, rail and truck logistics to minimize downtime with pipeline utilization >90% in 2024; manage basis and quality differentials actively to protect realized prices.
- [netback]
- [hedge]
- [logistics]
- [basis_quality]
ESG compliance, safety, and reclamation
Operate under Alberta Energy Regulator and Saskatchewan Ministry of Environment rules, aligning with Canada’s NDC to cut GHGs 40–45% below 2005 levels by 2030 and the oil and gas methane 75% reduction by 2030. Focus on emissions reductions, water stewardship, and responsible waste handling, with transparent community engagement and reporting. Remediate and reclaim sites to meet or exceed provincial standards.
- Regulatory: AER, Saskatchewan MoECC
- Targets: GHG −40–45% by 2030; methane −75% by 2030
- Actions: emissions, water, waste, community reporting, reclamation
Acquire Western Canadian oil & gas assets ≥ 1,000 boe/d, decline under 10%/yr, lift netbacks
Identify, evaluate and transact on Western Canadian oil and gas assets >1,000 boe/d with target decline <10%/yr and disciplined EV/boe pricing aligned with 2024 Canadian M&A. Execute seamless ops/system transitions to preserve uptime and HSE, capture G&A and marketing synergies to lift netbacks mid-single-digits. Drill high-ROI wells, optimize completions, apply data-driven reservoir work, use waterfloods (5–20% OOIP uplift) and artificial lift (~70% usage).
Delivered as Displayed
Business Model Canvas
The Cardinal Business Model Canvas you see here is the actual deliverable, not a mockup, and it reflects the same content and layout you’ll receive after purchase. Once you complete your order, you’ll get this exact file instantly—fully formatted and editable in Word and Excel. No surprises, just the ready-to-use document shown in the preview.











