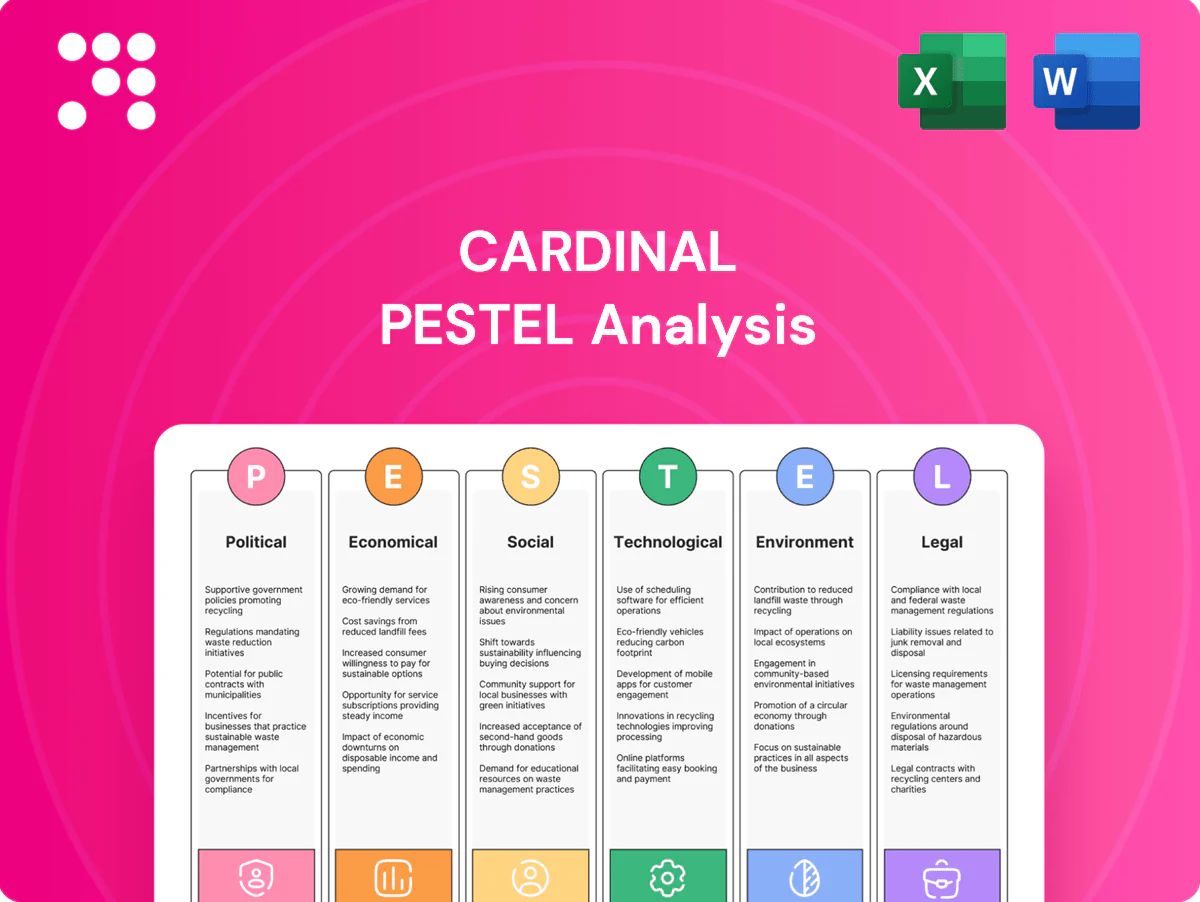
Cardinal PESTLE Analysis

Your Shortcut to Market Insight Starts Here
Gain a strategic advantage with our Cardinal PESTLE Analysis—concise yet powerful insights into political, economic, social, technological, legal, and environmental forces shaping the company. Ideal for investors and strategists seeking actionable intelligence. Purchase the full report to access detailed, ready-to-use analysis and forecasts.
Political factors

Federal–provincial energy policy alignment
Canada’s split jurisdiction creates shifting rules across Ottawa, Alberta and Saskatchewan, with Alberta’s TIER and Saskatchewan’s positions often diverging from federal policy. Federal carbon pricing is legislated to reach C$170/t by 2030 and the oil and gas sector was ~26% of national emissions in 2021, so changes to pricing, emissions caps or clean-fuel rules materially affect project economics. Misalignment risks permitting delays and compliance complexity; active policy monitoring and advocacy are essential.
Resource royalties and fiscal regimes
Provincial royalty frameworks directly alter producer netbacks and capital allocation, with take rates commonly ranging from about 5% to 40% depending on province and price regime. Periodic reviews that lift take can compress margins and slow drilling cadence, while reductions boost investment. Stability supports multi‑year planning; sudden regime shifts can strand capital, so scenario planning preserves target returns.

Pipeline and export infrastructure approvals
Federal assessments and interprovincial politics directly determine egress capacity—major projects like Trans Mountain expansion (+590 kb/d) face provincial approvals and federal review timelines. Lengthy approvals and legal challenges historically widened WCS differentials (averaged ~US$20/bbl pre-2023), constraining price realizations. Incremental debottlenecking and rail/terminal adds can lift netbacks and market access; proactive government support reduces takeaway-risk.

Indigenous engagement and partnerships
Rights, title and duty‑to‑consult frameworks (UNDRIP adopted 2007; Canada endorsed 2010, Bill C‑15 passed 2021) directly shape site access and timelines, with consultation failures leading to multi‑year delays. Collaborative impact and benefit agreements increase permitting certainty and social licence, while governance expectations for benefit sharing and stewardship have intensified; early, respectful engagement materially reduces permitting risk.
- Tags: rights, duty‑to‑consult, UNDRIP, Bill C‑15
- Outcomes: faster permitting, reduced litigation
- Focus: benefit sharing, environmental stewardship
Geopolitical shocks and energy security stance
Geopolitical shocks — exemplified by European gas TTF spikes above €200/MWh in 2022 — have pushed Canada to favor domestic energy production and reliability in policy and approvals.
Sanctions and trade shifts have altered price benchmarks and market access, prompting incentives and conditional approvals to secure supply chains.
Energy planners now build flexibility to capture upside (export windows) while hedging downside via storage, contracts and diversified routes.
- TTF >€200/MWh (Aug 2022) drove policy
- Priority: domestic reliability affects approvals/incentives
- Sanctions shift benchmarks, trade flows
- Strategy: flexible planning + hedging
Jurisdictional policy, carbon pricing and royalties reshape Canadian oil & gas economics
Split federal/provincial jurisdiction drives shifting rules; federal carbon pricing legislated to C$170/t by 2030 and oil & gas was ~26% of Canada’s emissions in 2021, so policy changes materially affect project economics. Provincial royalty take commonly ranges ~5–40%, altering netbacks and investment cadence. Rights, title and duty‑to‑consult (Bill C‑15, 2021) and major projects (Trans Mountain +590 kb/d) shape access and timelines.
| Metric | Value |
|---|---|
| Federal carbon price | C$170/t by 2030 |
| Oil & gas emissions (2021) | ~26% |
| Provincial royalty range | ~5–40% |
| Trans Mountain expansion | +590 kb/d |
| UNDRIP/Bill C‑15 | 2021 |
What is included in the product
 Detailed Word Document
Explores how external macro-environmental factors uniquely affect the Cardinal across Political, Economic, Social, Technological, Environmental, and Legal dimensions, with data-backed trends and forward-looking insights to inform strategy and risk mitigation for executives and investors.

 Customizable Excel Spreadsheet
Cardinal PESTLE Analysis delivers a clean, summarized and visually segmented overview of external factors, enabling quick interpretation and alignment during meetings or planning sessions. It’s easily editable and shareable, making it ideal for slide decks, strategy folders, and cross-team decision-making.
Economic factors

Oil price volatility and WTI–WCS differential
Realized prices hinge on global crude cycles — WTI traded near 80 USD/bbl in mid-2024 — and Canadian heavy differentials, which can exceed 30 USD/bbl during pipeline tightness or refinery outages. Pipeline constraints or outages widen discounts sharply. Hedging with swaps or puts can stabilize cash flows but caps upside. A balanced light/medium/heavy portfolio moderates exposure to differential swings.
Interest rates and capital costs
Tighter monetary policy—US Fed funds at 5.25–5.50% and 10yr Treasury around 4.0% in 2024–25—raises borrowing costs and hurdle rates, compressing equity valuations and slowing growth CAPEX. Firms with lower leverage and a higher share of fixed‑rate debt show reduced sensitivity, while phased investment programs help preserve dividends and free cash flow.

Inflation and supply chain pressures
Service costs for drilling, completion and labor have been elevated—oilfield service inflation ran roughly 10–20% during 2021–23 while U.S. CPI eased to 3.4% in 2023—eroding margins and delaying projects when budgets slip. Multi‑year contracts and standardization have delivered typical savings of 5–10% in recent industry deals. Enhanced operational efficiency and digitalization help offset rising input prices and protect cash flow.

CAD/USD exchange rate
Revenue is tied to USD benchmarks while many operating costs remain CAD‑denominated; mid‑2025 USD/CAD traded near 1.35 (CAD ≈ 0.74 USD), so a weaker CAD raises local revenue in CAD but increases imported input costs. FX volatility can strain USD‑exposed debt service; firms use natural hedges and selective forward/options hedging to smooth cash flows.
- USD/CAD ~1.35 (mid‑2025)
- Weaker CAD: higher CAD revenues, higher import costs
- USD debt: increased FX risk to serviceability
- Mitigants: natural hedges, selective hedging
Access to equity and debt markets
Energy-sector sentiment cycles narrow issuance windows and widen spreads during downturns, while strong free cash flow and dividend yields—energy sector average dividend yield ~4% in 2024—broaden investor appeal and support equity issuance.
ESG screening and regulation (eg, EU SFDR/Taxonomy through 2024) shift capital availability and terms; clear, transparent capital-allocation policies reduce perceived risk and lower cost of capital.
- Issuance timing: market-sensitive
- FCF/dividends: boost demand, ~4% yield (2024)
- ESG rules: affect access/terms (SFDR/Taxonomy)
- Transparency: lowers financing costs
Jurisdictional policy, carbon pricing and royalties reshape Canadian oil & gas economics
Realized prices follow WTI ~80 USD/bbl (mid‑2024) and wide Canadian heavy differentials; Fed funds 5.25–5.50% (2024–25) raises funding costs; USD/CAD ~1.35 (mid‑2025) shifts CAD revenues/import costs; energy dividend yield ~4% (2024) supports issuance windows.
| Metric | Value |
|---|---|
| WTI (mid‑2024) | ~80 USD/bbl |
| Fed funds | 5.25–5.50% |
| USD/CAD (mid‑2025) | ~1.35 |
| Energy div yield (2024) | ~4% |
What You See Is What You Get
Cardinal PESTLE Analysis
The preview shown here is the exact Cardinal PESTLE Analysis document you’ll receive after purchase—fully formatted and ready to use. The layout, content, and structure visible are identical to the downloadable file, with no placeholders or teasers. After checkout you’ll instantly get this finished, professionally structured report.

Your Shortcut to Market Insight Starts Here
Gain a strategic advantage with our Cardinal PESTLE Analysis—concise yet powerful insights into political, economic, social, technological, legal, and environmental forces shaping the company. Ideal for investors and strategists seeking actionable intelligence. Purchase the full report to access detailed, ready-to-use analysis and forecasts.
Political factors
Federal–provincial energy policy alignment
Canada’s split jurisdiction creates shifting rules across Ottawa, Alberta and Saskatchewan, with Alberta’s TIER and Saskatchewan’s positions often diverging from federal policy. Federal carbon pricing is legislated to reach C$170/t by 2030 and the oil and gas sector was ~26% of national emissions in 2021, so changes to pricing, emissions caps or clean-fuel rules materially affect project economics. Misalignment risks permitting delays and compliance complexity; active policy monitoring and advocacy are essential.
Resource royalties and fiscal regimes
Provincial royalty frameworks directly alter producer netbacks and capital allocation, with take rates commonly ranging from about 5% to 40% depending on province and price regime. Periodic reviews that lift take can compress margins and slow drilling cadence, while reductions boost investment. Stability supports multi‑year planning; sudden regime shifts can strand capital, so scenario planning preserves target returns.
Pipeline and export infrastructure approvals
Federal assessments and interprovincial politics directly determine egress capacity—major projects like Trans Mountain expansion (+590 kb/d) face provincial approvals and federal review timelines. Lengthy approvals and legal challenges historically widened WCS differentials (averaged ~US$20/bbl pre-2023), constraining price realizations. Incremental debottlenecking and rail/terminal adds can lift netbacks and market access; proactive government support reduces takeaway-risk.
Indigenous engagement and partnerships
Rights, title and duty‑to‑consult frameworks (UNDRIP adopted 2007; Canada endorsed 2010, Bill C‑15 passed 2021) directly shape site access and timelines, with consultation failures leading to multi‑year delays. Collaborative impact and benefit agreements increase permitting certainty and social licence, while governance expectations for benefit sharing and stewardship have intensified; early, respectful engagement materially reduces permitting risk.
- Tags: rights, duty‑to‑consult, UNDRIP, Bill C‑15
- Outcomes: faster permitting, reduced litigation
- Focus: benefit sharing, environmental stewardship
Geopolitical shocks and energy security stance
Geopolitical shocks — exemplified by European gas TTF spikes above €200/MWh in 2022 — have pushed Canada to favor domestic energy production and reliability in policy and approvals.
Sanctions and trade shifts have altered price benchmarks and market access, prompting incentives and conditional approvals to secure supply chains.
Energy planners now build flexibility to capture upside (export windows) while hedging downside via storage, contracts and diversified routes.
- TTF >€200/MWh (Aug 2022) drove policy
- Priority: domestic reliability affects approvals/incentives
- Sanctions shift benchmarks, trade flows
- Strategy: flexible planning + hedging
Jurisdictional policy, carbon pricing and royalties reshape Canadian oil & gas economics
Split federal/provincial jurisdiction drives shifting rules; federal carbon pricing legislated to C$170/t by 2030 and oil & gas was ~26% of Canada’s emissions in 2021, so policy changes materially affect project economics. Provincial royalty take commonly ranges ~5–40%, altering netbacks and investment cadence. Rights, title and duty‑to‑consult (Bill C‑15, 2021) and major projects (Trans Mountain +590 kb/d) shape access and timelines.
| Metric | Value |
|---|---|
| Federal carbon price | C$170/t by 2030 |
| Oil & gas emissions (2021) | ~26% |
| Provincial royalty range | ~5–40% |
| Trans Mountain expansion | +590 kb/d |
| UNDRIP/Bill C‑15 | 2021 |
What is included in the product
Detailed Word Document
Explores how external macro-environmental factors uniquely affect the Cardinal across Political, Economic, Social, Technological, Environmental, and Legal dimensions, with data-backed trends and forward-looking insights to inform strategy and risk mitigation for executives and investors.
Customizable Excel Spreadsheet
Cardinal PESTLE Analysis delivers a clean, summarized and visually segmented overview of external factors, enabling quick interpretation and alignment during meetings or planning sessions. It’s easily editable and shareable, making it ideal for slide decks, strategy folders, and cross-team decision-making.
Economic factors
Oil price volatility and WTI–WCS differential
Realized prices hinge on global crude cycles — WTI traded near 80 USD/bbl in mid-2024 — and Canadian heavy differentials, which can exceed 30 USD/bbl during pipeline tightness or refinery outages. Pipeline constraints or outages widen discounts sharply. Hedging with swaps or puts can stabilize cash flows but caps upside. A balanced light/medium/heavy portfolio moderates exposure to differential swings.
Interest rates and capital costs
Tighter monetary policy—US Fed funds at 5.25–5.50% and 10yr Treasury around 4.0% in 2024–25—raises borrowing costs and hurdle rates, compressing equity valuations and slowing growth CAPEX. Firms with lower leverage and a higher share of fixed‑rate debt show reduced sensitivity, while phased investment programs help preserve dividends and free cash flow.
Inflation and supply chain pressures
Service costs for drilling, completion and labor have been elevated—oilfield service inflation ran roughly 10–20% during 2021–23 while U.S. CPI eased to 3.4% in 2023—eroding margins and delaying projects when budgets slip. Multi‑year contracts and standardization have delivered typical savings of 5–10% in recent industry deals. Enhanced operational efficiency and digitalization help offset rising input prices and protect cash flow.
CAD/USD exchange rate
Revenue is tied to USD benchmarks while many operating costs remain CAD‑denominated; mid‑2025 USD/CAD traded near 1.35 (CAD ≈ 0.74 USD), so a weaker CAD raises local revenue in CAD but increases imported input costs. FX volatility can strain USD‑exposed debt service; firms use natural hedges and selective forward/options hedging to smooth cash flows.
- USD/CAD ~1.35 (mid‑2025)
- Weaker CAD: higher CAD revenues, higher import costs
- USD debt: increased FX risk to serviceability
- Mitigants: natural hedges, selective hedging
Access to equity and debt markets
Energy-sector sentiment cycles narrow issuance windows and widen spreads during downturns, while strong free cash flow and dividend yields—energy sector average dividend yield ~4% in 2024—broaden investor appeal and support equity issuance.
ESG screening and regulation (eg, EU SFDR/Taxonomy through 2024) shift capital availability and terms; clear, transparent capital-allocation policies reduce perceived risk and lower cost of capital.
- Issuance timing: market-sensitive
- FCF/dividends: boost demand, ~4% yield (2024)
- ESG rules: affect access/terms (SFDR/Taxonomy)
- Transparency: lowers financing costs
Jurisdictional policy, carbon pricing and royalties reshape Canadian oil & gas economics
Realized prices follow WTI ~80 USD/bbl (mid‑2024) and wide Canadian heavy differentials; Fed funds 5.25–5.50% (2024–25) raises funding costs; USD/CAD ~1.35 (mid‑2025) shifts CAD revenues/import costs; energy dividend yield ~4% (2024) supports issuance windows.
| Metric | Value |
|---|---|
| WTI (mid‑2024) | ~80 USD/bbl |
| Fed funds | 5.25–5.50% |
| USD/CAD (mid‑2025) | ~1.35 |
| Energy div yield (2024) | ~4% |
What You See Is What You Get
Cardinal PESTLE Analysis
The preview shown here is the exact Cardinal PESTLE Analysis document you’ll receive after purchase—fully formatted and ready to use. The layout, content, and structure visible are identical to the downloadable file, with no placeholders or teasers. After checkout you’ll instantly get this finished, professionally structured report.
Original: $10.00
-65%$10.00
$3.50Description
Your Shortcut to Market Insight Starts Here
Gain a strategic advantage with our Cardinal PESTLE Analysis—concise yet powerful insights into political, economic, social, technological, legal, and environmental forces shaping the company. Ideal for investors and strategists seeking actionable intelligence. Purchase the full report to access detailed, ready-to-use analysis and forecasts.
Political factors
Federal–provincial energy policy alignment
Canada’s split jurisdiction creates shifting rules across Ottawa, Alberta and Saskatchewan, with Alberta’s TIER and Saskatchewan’s positions often diverging from federal policy. Federal carbon pricing is legislated to reach C$170/t by 2030 and the oil and gas sector was ~26% of national emissions in 2021, so changes to pricing, emissions caps or clean-fuel rules materially affect project economics. Misalignment risks permitting delays and compliance complexity; active policy monitoring and advocacy are essential.
Resource royalties and fiscal regimes
Provincial royalty frameworks directly alter producer netbacks and capital allocation, with take rates commonly ranging from about 5% to 40% depending on province and price regime. Periodic reviews that lift take can compress margins and slow drilling cadence, while reductions boost investment. Stability supports multi‑year planning; sudden regime shifts can strand capital, so scenario planning preserves target returns.
Pipeline and export infrastructure approvals
Federal assessments and interprovincial politics directly determine egress capacity—major projects like Trans Mountain expansion (+590 kb/d) face provincial approvals and federal review timelines. Lengthy approvals and legal challenges historically widened WCS differentials (averaged ~US$20/bbl pre-2023), constraining price realizations. Incremental debottlenecking and rail/terminal adds can lift netbacks and market access; proactive government support reduces takeaway-risk.
Indigenous engagement and partnerships
Rights, title and duty‑to‑consult frameworks (UNDRIP adopted 2007; Canada endorsed 2010, Bill C‑15 passed 2021) directly shape site access and timelines, with consultation failures leading to multi‑year delays. Collaborative impact and benefit agreements increase permitting certainty and social licence, while governance expectations for benefit sharing and stewardship have intensified; early, respectful engagement materially reduces permitting risk.
- Tags: rights, duty‑to‑consult, UNDRIP, Bill C‑15
- Outcomes: faster permitting, reduced litigation
- Focus: benefit sharing, environmental stewardship
Geopolitical shocks and energy security stance
Geopolitical shocks — exemplified by European gas TTF spikes above €200/MWh in 2022 — have pushed Canada to favor domestic energy production and reliability in policy and approvals.
Sanctions and trade shifts have altered price benchmarks and market access, prompting incentives and conditional approvals to secure supply chains.
Energy planners now build flexibility to capture upside (export windows) while hedging downside via storage, contracts and diversified routes.
- TTF >€200/MWh (Aug 2022) drove policy
- Priority: domestic reliability affects approvals/incentives
- Sanctions shift benchmarks, trade flows
- Strategy: flexible planning + hedging
Jurisdictional policy, carbon pricing and royalties reshape Canadian oil & gas economics
Split federal/provincial jurisdiction drives shifting rules; federal carbon pricing legislated to C$170/t by 2030 and oil & gas was ~26% of Canada’s emissions in 2021, so policy changes materially affect project economics. Provincial royalty take commonly ranges ~5–40%, altering netbacks and investment cadence. Rights, title and duty‑to‑consult (Bill C‑15, 2021) and major projects (Trans Mountain +590 kb/d) shape access and timelines.
| Metric | Value |
|---|---|
| Federal carbon price | C$170/t by 2030 |
| Oil & gas emissions (2021) | ~26% |
| Provincial royalty range | ~5–40% |
| Trans Mountain expansion | +590 kb/d |
| UNDRIP/Bill C‑15 | 2021 |
What is included in the product
Detailed Word Document
Explores how external macro-environmental factors uniquely affect the Cardinal across Political, Economic, Social, Technological, Environmental, and Legal dimensions, with data-backed trends and forward-looking insights to inform strategy and risk mitigation for executives and investors.
Customizable Excel Spreadsheet
Cardinal PESTLE Analysis delivers a clean, summarized and visually segmented overview of external factors, enabling quick interpretation and alignment during meetings or planning sessions. It’s easily editable and shareable, making it ideal for slide decks, strategy folders, and cross-team decision-making.
Economic factors
Oil price volatility and WTI–WCS differential
Realized prices hinge on global crude cycles — WTI traded near 80 USD/bbl in mid-2024 — and Canadian heavy differentials, which can exceed 30 USD/bbl during pipeline tightness or refinery outages. Pipeline constraints or outages widen discounts sharply. Hedging with swaps or puts can stabilize cash flows but caps upside. A balanced light/medium/heavy portfolio moderates exposure to differential swings.
Interest rates and capital costs
Tighter monetary policy—US Fed funds at 5.25–5.50% and 10yr Treasury around 4.0% in 2024–25—raises borrowing costs and hurdle rates, compressing equity valuations and slowing growth CAPEX. Firms with lower leverage and a higher share of fixed‑rate debt show reduced sensitivity, while phased investment programs help preserve dividends and free cash flow.
Inflation and supply chain pressures
Service costs for drilling, completion and labor have been elevated—oilfield service inflation ran roughly 10–20% during 2021–23 while U.S. CPI eased to 3.4% in 2023—eroding margins and delaying projects when budgets slip. Multi‑year contracts and standardization have delivered typical savings of 5–10% in recent industry deals. Enhanced operational efficiency and digitalization help offset rising input prices and protect cash flow.
CAD/USD exchange rate
Revenue is tied to USD benchmarks while many operating costs remain CAD‑denominated; mid‑2025 USD/CAD traded near 1.35 (CAD ≈ 0.74 USD), so a weaker CAD raises local revenue in CAD but increases imported input costs. FX volatility can strain USD‑exposed debt service; firms use natural hedges and selective forward/options hedging to smooth cash flows.
- USD/CAD ~1.35 (mid‑2025)
- Weaker CAD: higher CAD revenues, higher import costs
- USD debt: increased FX risk to serviceability
- Mitigants: natural hedges, selective hedging
Access to equity and debt markets
Energy-sector sentiment cycles narrow issuance windows and widen spreads during downturns, while strong free cash flow and dividend yields—energy sector average dividend yield ~4% in 2024—broaden investor appeal and support equity issuance.
ESG screening and regulation (eg, EU SFDR/Taxonomy through 2024) shift capital availability and terms; clear, transparent capital-allocation policies reduce perceived risk and lower cost of capital.
- Issuance timing: market-sensitive
- FCF/dividends: boost demand, ~4% yield (2024)
- ESG rules: affect access/terms (SFDR/Taxonomy)
- Transparency: lowers financing costs
Jurisdictional policy, carbon pricing and royalties reshape Canadian oil & gas economics
Realized prices follow WTI ~80 USD/bbl (mid‑2024) and wide Canadian heavy differentials; Fed funds 5.25–5.50% (2024–25) raises funding costs; USD/CAD ~1.35 (mid‑2025) shifts CAD revenues/import costs; energy dividend yield ~4% (2024) supports issuance windows.
| Metric | Value |
|---|---|
| WTI (mid‑2024) | ~80 USD/bbl |
| Fed funds | 5.25–5.50% |
| USD/CAD (mid‑2025) | ~1.35 |
| Energy div yield (2024) | ~4% |
What You See Is What You Get
Cardinal PESTLE Analysis
The preview shown here is the exact Cardinal PESTLE Analysis document you’ll receive after purchase—fully formatted and ready to use. The layout, content, and structure visible are identical to the downloadable file, with no placeholders or teasers. After checkout you’ll instantly get this finished, professionally structured report.











