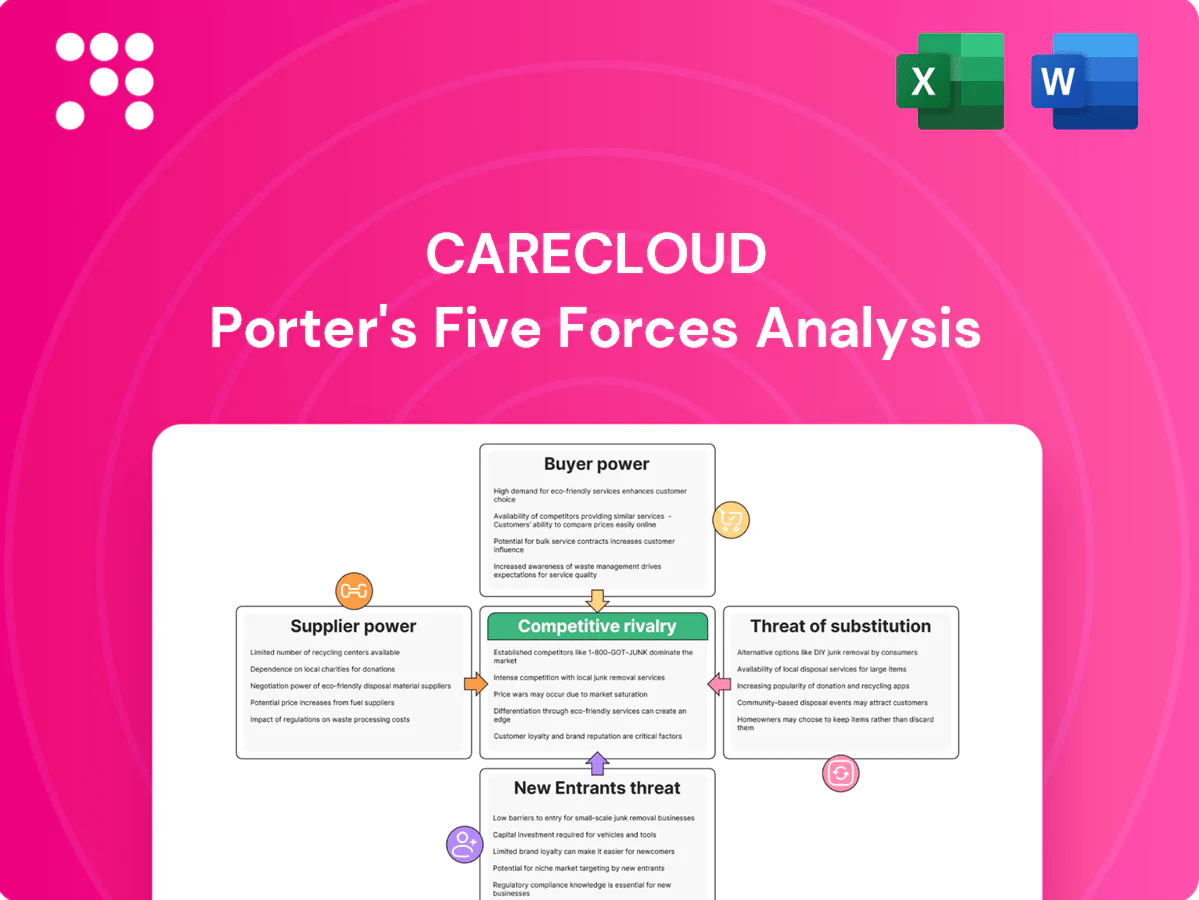
CareCloud Porter's Five Forces Analysis

From Overview to Strategy Blueprint
CareCloud’s Porter's Five Forces snapshot highlights competitive intensity in cloud-based EHR and practice management, supplier and buyer leverage, and the threat of new entrants and substitutes shaping margins. It surfaces strategic pressures and opportunities but only scratches the surface. Unlock the full Porter's Five Forces Analysis for force-by-force ratings, visuals, and actionable insights to inform investment or strategic decisions.
Suppliers Bargaining Power

Dependence on cloud IaaS
CareCloud depends on hyperscalers for hosting, compute and storage, concentrating supplier leverage—AWS 31%, Microsoft 25% and Google 11% of global cloud market in 2024. Price shifts, reserved-instance commitments or service deprecations can hit margins and uptime; reserved discounts can reach ~72%. Multicloud or edge reduce concentration but raise integration and ops complexity. SLAs and volume discounts partially mitigate the risk.
Clearinghouses and payer connectivity
Claims clearinghouses and payer gateways are essential to RCM transaction flow, handling over 95% of U.S. medical claims electronically (CAQH Index 2024) and linking to more than 1,400 payer endpoints, which limits easy substitution and strengthens supplier negotiating power. Certification and integration requirements raise switching costs and any outage directly reduces customer cash flow and satisfaction. Building diversified, redundant connections measurably dilutes this supplier influence.

Clinical vocabularies and data content
Licensing SNOMED CT (≈350,000 active concepts), CPT (≈10,000 procedure codes) and RxNorm (>100,000 drug concepts) drives recurring costs and compliance obligations for CareCloud. Changes in fee schedules or licensing terms can directly pressure pricing and margins. Regulatory requirements make dependence structural, limiting vendor substitution. Bundled enterprise licenses can temper unit economics by spreading fixed license costs across customers.

Third‑party APIs and integrations
Specialized talent and contractors
Healthcare IT engineers, security experts, and implementation consultants are scarce inputs for CareCloud; 2024 industry data show IT/security wage inflation and competition from Big Tech pushed total hiring costs up materially, raising attrition risk and slowing implementations when knowledge lock-in occurs.
- Scarcity: high demand for clinical IT and security roles
- Cost pressure: wage inflation and Big Tech competition
- Risk: knowledge lock-in → slower delivery if turnover rises
- Mitigation: workforce planning and nearshore hubs stabilize supply
Concentrated supplier power: hyperscalers (AWS 31%/MS 25%/Google 11%) and CAQH 95% claims
CareCloud faces concentrated supplier power: hyperscalers (AWS 31%, Microsoft 25%, Google 11%) and claims gateways (95% of U.S. claims via CAQH) can pressure costs, SLAs and uptime. Clinical code licensing (SNOMED ≈350k, CPT ≈10k, RxNorm ≈100k) and ePrescribing/APIs (≈1.5B txns; ~1,000 RPM limits) raise switching costs; redundancy and native builds mitigate risk.
| Supplier | Metric (2024) |
|---|---|
| Hyperscalers | AWS 31% / MS 25% / Google 11% |
| Claims | 95% electronic (CAQH) |
| Clinical codes | SNOMED 350k / CPT 10k / RxNorm 100k |
| ePrescribing/APIs | ≈1.5B txns; ~1,000 RPM |
What is included in the product
 Detailed Word Document
Comprehensive Porter’s Five Forces analysis tailored to CareCloud that uncovers competitive intensity, buyer and supplier leverage, barriers to entry, and substitute threats, highlighting disruptive trends and strategic vulnerabilities. Ready-to-use insights to inform investor materials, internal strategy, and market positioning.

 Customizable Excel Spreadsheet
Clear, one-sheet CareCloud Porter's Five Forces that simplifies competitive pressure into an instant spider chart—customize levels with live data, swap labels/notes, and drop straight into pitch decks or Excel dashboards for fast, non-technical decision-making.
Customers Bargaining Power

Fragmented SMB practices
Small and midsize practices are price-sensitive but numerous—over 80% of US practices had fewer than 10 clinicians in 2024, limiting any single buyer’s leverage. They prioritize total cost of ownership and ease of use, comparing vendors on subscription fees, implementation time and ROI. Switching costs exist but are manageable with migration support; bundled pricing and rapid time-to-value often decide deals.
Large groups and health systems
Large groups and health systems run formal RFPs in 2024 and demand deep integration, SLAs and explicit data rights, increasing buyer leverage. Enterprise buyers negotiate discounts and customizations on deals often exceeding $1M, and 12–18 month sales cycles heighten deal concentration risk. Strong referenceability and documented ROI help preserve pricing and limit concessions.

High switching costs and data lock‑in
Data migration, clinician retraining, and workflow redesign create significant frictions that reduce churn and temper buyer bargaining after go‑live, and in 2024 regulators and buyers continued to emphasize interoperability to mitigate these risks. Buyers commonly leverage anticipated switching costs pre‑sale to extract concessions on pricing and implementation scope. Clear exit provisions and binding interoperability commitments can ease procurement concerns without conceding price.

Outcome-driven procurement
Abundant alternatives
Abundant alternatives give buyers strong leverage: in 2024 there are over 1,000 EHR/PM/RCM vendors, intensifying comparison shopping and compressing price premiums as core-module parity rises. Usability, specialty depth, and services drive differentiation and clinch deals when features are similar, while switching incentives and promotional terms can sway undecided buyers during 6–9 month procurement cycles.
- vendor_count: over 1,000 (2024)
- procurement_cycle: 6–9 months
- differentiators: usability, specialty depth, services
- pricing_pressure: high due to feature parity
Price pressure: >1,000 vendors; 80% small practices; denials 5–10%; productivity 20%
Buyers range from price-sensitive small practices (80% <10 clinicians in 2024) to large systems that extract discounts on >$1M deals; switching frictions reduce churn post‑go‑live. KPI guarantees (denial reduction 5–10%, productivity up to 20% in 2024) shift leverage. Over 1,000 vendor alternatives in 2024 sustain strong pricing pressure.
| metric | 2024 |
|---|---|
| small practices | 80% <10 clinicians |
| vendor_count | >1,000 |
| procurement_cycle | 6–9 months |
| denial_rate | 5–10% |
| productivity_gain | up to 20% |
Preview the Actual Deliverable
CareCloud Porter's Five Forces Analysis
This preview shows the exact CareCloud Porter's Five Forces Analysis you'll receive immediately after purchase—no surprises, no placeholders. The document displayed is the final, professionally formatted file, ready for download and use the moment you buy. You're viewing the actual deliverable; once payment is complete you’ll get instant access to this same complete analysis.

From Overview to Strategy Blueprint
CareCloud’s Porter's Five Forces snapshot highlights competitive intensity in cloud-based EHR and practice management, supplier and buyer leverage, and the threat of new entrants and substitutes shaping margins. It surfaces strategic pressures and opportunities but only scratches the surface. Unlock the full Porter's Five Forces Analysis for force-by-force ratings, visuals, and actionable insights to inform investment or strategic decisions.
Suppliers Bargaining Power
Dependence on cloud IaaS
CareCloud depends on hyperscalers for hosting, compute and storage, concentrating supplier leverage—AWS 31%, Microsoft 25% and Google 11% of global cloud market in 2024. Price shifts, reserved-instance commitments or service deprecations can hit margins and uptime; reserved discounts can reach ~72%. Multicloud or edge reduce concentration but raise integration and ops complexity. SLAs and volume discounts partially mitigate the risk.
Clearinghouses and payer connectivity
Claims clearinghouses and payer gateways are essential to RCM transaction flow, handling over 95% of U.S. medical claims electronically (CAQH Index 2024) and linking to more than 1,400 payer endpoints, which limits easy substitution and strengthens supplier negotiating power. Certification and integration requirements raise switching costs and any outage directly reduces customer cash flow and satisfaction. Building diversified, redundant connections measurably dilutes this supplier influence.
Clinical vocabularies and data content
Licensing SNOMED CT (≈350,000 active concepts), CPT (≈10,000 procedure codes) and RxNorm (>100,000 drug concepts) drives recurring costs and compliance obligations for CareCloud. Changes in fee schedules or licensing terms can directly pressure pricing and margins. Regulatory requirements make dependence structural, limiting vendor substitution. Bundled enterprise licenses can temper unit economics by spreading fixed license costs across customers.
Third‑party APIs and integrations
Specialized talent and contractors
Healthcare IT engineers, security experts, and implementation consultants are scarce inputs for CareCloud; 2024 industry data show IT/security wage inflation and competition from Big Tech pushed total hiring costs up materially, raising attrition risk and slowing implementations when knowledge lock-in occurs.
- Scarcity: high demand for clinical IT and security roles
- Cost pressure: wage inflation and Big Tech competition
- Risk: knowledge lock-in → slower delivery if turnover rises
- Mitigation: workforce planning and nearshore hubs stabilize supply
Concentrated supplier power: hyperscalers (AWS 31%/MS 25%/Google 11%) and CAQH 95% claims
CareCloud faces concentrated supplier power: hyperscalers (AWS 31%, Microsoft 25%, Google 11%) and claims gateways (95% of U.S. claims via CAQH) can pressure costs, SLAs and uptime. Clinical code licensing (SNOMED ≈350k, CPT ≈10k, RxNorm ≈100k) and ePrescribing/APIs (≈1.5B txns; ~1,000 RPM limits) raise switching costs; redundancy and native builds mitigate risk.
| Supplier | Metric (2024) |
|---|---|
| Hyperscalers | AWS 31% / MS 25% / Google 11% |
| Claims | 95% electronic (CAQH) |
| Clinical codes | SNOMED 350k / CPT 10k / RxNorm 100k |
| ePrescribing/APIs | ≈1.5B txns; ~1,000 RPM |
What is included in the product
Detailed Word Document
Comprehensive Porter’s Five Forces analysis tailored to CareCloud that uncovers competitive intensity, buyer and supplier leverage, barriers to entry, and substitute threats, highlighting disruptive trends and strategic vulnerabilities. Ready-to-use insights to inform investor materials, internal strategy, and market positioning.
Customizable Excel Spreadsheet
Clear, one-sheet CareCloud Porter's Five Forces that simplifies competitive pressure into an instant spider chart—customize levels with live data, swap labels/notes, and drop straight into pitch decks or Excel dashboards for fast, non-technical decision-making.
Customers Bargaining Power
Fragmented SMB practices
Small and midsize practices are price-sensitive but numerous—over 80% of US practices had fewer than 10 clinicians in 2024, limiting any single buyer’s leverage. They prioritize total cost of ownership and ease of use, comparing vendors on subscription fees, implementation time and ROI. Switching costs exist but are manageable with migration support; bundled pricing and rapid time-to-value often decide deals.
Large groups and health systems
Large groups and health systems run formal RFPs in 2024 and demand deep integration, SLAs and explicit data rights, increasing buyer leverage. Enterprise buyers negotiate discounts and customizations on deals often exceeding $1M, and 12–18 month sales cycles heighten deal concentration risk. Strong referenceability and documented ROI help preserve pricing and limit concessions.
High switching costs and data lock‑in
Data migration, clinician retraining, and workflow redesign create significant frictions that reduce churn and temper buyer bargaining after go‑live, and in 2024 regulators and buyers continued to emphasize interoperability to mitigate these risks. Buyers commonly leverage anticipated switching costs pre‑sale to extract concessions on pricing and implementation scope. Clear exit provisions and binding interoperability commitments can ease procurement concerns without conceding price.
Outcome-driven procurement
Abundant alternatives
Abundant alternatives give buyers strong leverage: in 2024 there are over 1,000 EHR/PM/RCM vendors, intensifying comparison shopping and compressing price premiums as core-module parity rises. Usability, specialty depth, and services drive differentiation and clinch deals when features are similar, while switching incentives and promotional terms can sway undecided buyers during 6–9 month procurement cycles.
- vendor_count: over 1,000 (2024)
- procurement_cycle: 6–9 months
- differentiators: usability, specialty depth, services
- pricing_pressure: high due to feature parity
Price pressure: >1,000 vendors; 80% small practices; denials 5–10%; productivity 20%
Buyers range from price-sensitive small practices (80% <10 clinicians in 2024) to large systems that extract discounts on >$1M deals; switching frictions reduce churn post‑go‑live. KPI guarantees (denial reduction 5–10%, productivity up to 20% in 2024) shift leverage. Over 1,000 vendor alternatives in 2024 sustain strong pricing pressure.
| metric | 2024 |
|---|---|
| small practices | 80% <10 clinicians |
| vendor_count | >1,000 |
| procurement_cycle | 6–9 months |
| denial_rate | 5–10% |
| productivity_gain | up to 20% |
Preview the Actual Deliverable
CareCloud Porter's Five Forces Analysis
This preview shows the exact CareCloud Porter's Five Forces Analysis you'll receive immediately after purchase—no surprises, no placeholders. The document displayed is the final, professionally formatted file, ready for download and use the moment you buy. You're viewing the actual deliverable; once payment is complete you’ll get instant access to this same complete analysis.
Original: $10.00
-65%$10.00
$3.50Description
From Overview to Strategy Blueprint
CareCloud’s Porter's Five Forces snapshot highlights competitive intensity in cloud-based EHR and practice management, supplier and buyer leverage, and the threat of new entrants and substitutes shaping margins. It surfaces strategic pressures and opportunities but only scratches the surface. Unlock the full Porter's Five Forces Analysis for force-by-force ratings, visuals, and actionable insights to inform investment or strategic decisions.
Suppliers Bargaining Power
Dependence on cloud IaaS
CareCloud depends on hyperscalers for hosting, compute and storage, concentrating supplier leverage—AWS 31%, Microsoft 25% and Google 11% of global cloud market in 2024. Price shifts, reserved-instance commitments or service deprecations can hit margins and uptime; reserved discounts can reach ~72%. Multicloud or edge reduce concentration but raise integration and ops complexity. SLAs and volume discounts partially mitigate the risk.
Clearinghouses and payer connectivity
Claims clearinghouses and payer gateways are essential to RCM transaction flow, handling over 95% of U.S. medical claims electronically (CAQH Index 2024) and linking to more than 1,400 payer endpoints, which limits easy substitution and strengthens supplier negotiating power. Certification and integration requirements raise switching costs and any outage directly reduces customer cash flow and satisfaction. Building diversified, redundant connections measurably dilutes this supplier influence.
Clinical vocabularies and data content
Licensing SNOMED CT (≈350,000 active concepts), CPT (≈10,000 procedure codes) and RxNorm (>100,000 drug concepts) drives recurring costs and compliance obligations for CareCloud. Changes in fee schedules or licensing terms can directly pressure pricing and margins. Regulatory requirements make dependence structural, limiting vendor substitution. Bundled enterprise licenses can temper unit economics by spreading fixed license costs across customers.
Third‑party APIs and integrations
Specialized talent and contractors
Healthcare IT engineers, security experts, and implementation consultants are scarce inputs for CareCloud; 2024 industry data show IT/security wage inflation and competition from Big Tech pushed total hiring costs up materially, raising attrition risk and slowing implementations when knowledge lock-in occurs.
- Scarcity: high demand for clinical IT and security roles
- Cost pressure: wage inflation and Big Tech competition
- Risk: knowledge lock-in → slower delivery if turnover rises
- Mitigation: workforce planning and nearshore hubs stabilize supply
Concentrated supplier power: hyperscalers (AWS 31%/MS 25%/Google 11%) and CAQH 95% claims
CareCloud faces concentrated supplier power: hyperscalers (AWS 31%, Microsoft 25%, Google 11%) and claims gateways (95% of U.S. claims via CAQH) can pressure costs, SLAs and uptime. Clinical code licensing (SNOMED ≈350k, CPT ≈10k, RxNorm ≈100k) and ePrescribing/APIs (≈1.5B txns; ~1,000 RPM limits) raise switching costs; redundancy and native builds mitigate risk.
| Supplier | Metric (2024) |
|---|---|
| Hyperscalers | AWS 31% / MS 25% / Google 11% |
| Claims | 95% electronic (CAQH) |
| Clinical codes | SNOMED 350k / CPT 10k / RxNorm 100k |
| ePrescribing/APIs | ≈1.5B txns; ~1,000 RPM |
What is included in the product
Detailed Word Document
Comprehensive Porter’s Five Forces analysis tailored to CareCloud that uncovers competitive intensity, buyer and supplier leverage, barriers to entry, and substitute threats, highlighting disruptive trends and strategic vulnerabilities. Ready-to-use insights to inform investor materials, internal strategy, and market positioning.
Customizable Excel Spreadsheet
Clear, one-sheet CareCloud Porter's Five Forces that simplifies competitive pressure into an instant spider chart—customize levels with live data, swap labels/notes, and drop straight into pitch decks or Excel dashboards for fast, non-technical decision-making.
Customers Bargaining Power
Fragmented SMB practices
Small and midsize practices are price-sensitive but numerous—over 80% of US practices had fewer than 10 clinicians in 2024, limiting any single buyer’s leverage. They prioritize total cost of ownership and ease of use, comparing vendors on subscription fees, implementation time and ROI. Switching costs exist but are manageable with migration support; bundled pricing and rapid time-to-value often decide deals.
Large groups and health systems
Large groups and health systems run formal RFPs in 2024 and demand deep integration, SLAs and explicit data rights, increasing buyer leverage. Enterprise buyers negotiate discounts and customizations on deals often exceeding $1M, and 12–18 month sales cycles heighten deal concentration risk. Strong referenceability and documented ROI help preserve pricing and limit concessions.
High switching costs and data lock‑in
Data migration, clinician retraining, and workflow redesign create significant frictions that reduce churn and temper buyer bargaining after go‑live, and in 2024 regulators and buyers continued to emphasize interoperability to mitigate these risks. Buyers commonly leverage anticipated switching costs pre‑sale to extract concessions on pricing and implementation scope. Clear exit provisions and binding interoperability commitments can ease procurement concerns without conceding price.
Outcome-driven procurement
Abundant alternatives
Abundant alternatives give buyers strong leverage: in 2024 there are over 1,000 EHR/PM/RCM vendors, intensifying comparison shopping and compressing price premiums as core-module parity rises. Usability, specialty depth, and services drive differentiation and clinch deals when features are similar, while switching incentives and promotional terms can sway undecided buyers during 6–9 month procurement cycles.
- vendor_count: over 1,000 (2024)
- procurement_cycle: 6–9 months
- differentiators: usability, specialty depth, services
- pricing_pressure: high due to feature parity
Price pressure: >1,000 vendors; 80% small practices; denials 5–10%; productivity 20%
Buyers range from price-sensitive small practices (80% <10 clinicians in 2024) to large systems that extract discounts on >$1M deals; switching frictions reduce churn post‑go‑live. KPI guarantees (denial reduction 5–10%, productivity up to 20% in 2024) shift leverage. Over 1,000 vendor alternatives in 2024 sustain strong pricing pressure.
| metric | 2024 |
|---|---|
| small practices | 80% <10 clinicians |
| vendor_count | >1,000 |
| procurement_cycle | 6–9 months |
| denial_rate | 5–10% |
| productivity_gain | up to 20% |
Preview the Actual Deliverable
CareCloud Porter's Five Forces Analysis
This preview shows the exact CareCloud Porter's Five Forces Analysis you'll receive immediately after purchase—no surprises, no placeholders. The document displayed is the final, professionally formatted file, ready for download and use the moment you buy. You're viewing the actual deliverable; once payment is complete you’ll get instant access to this same complete analysis.











