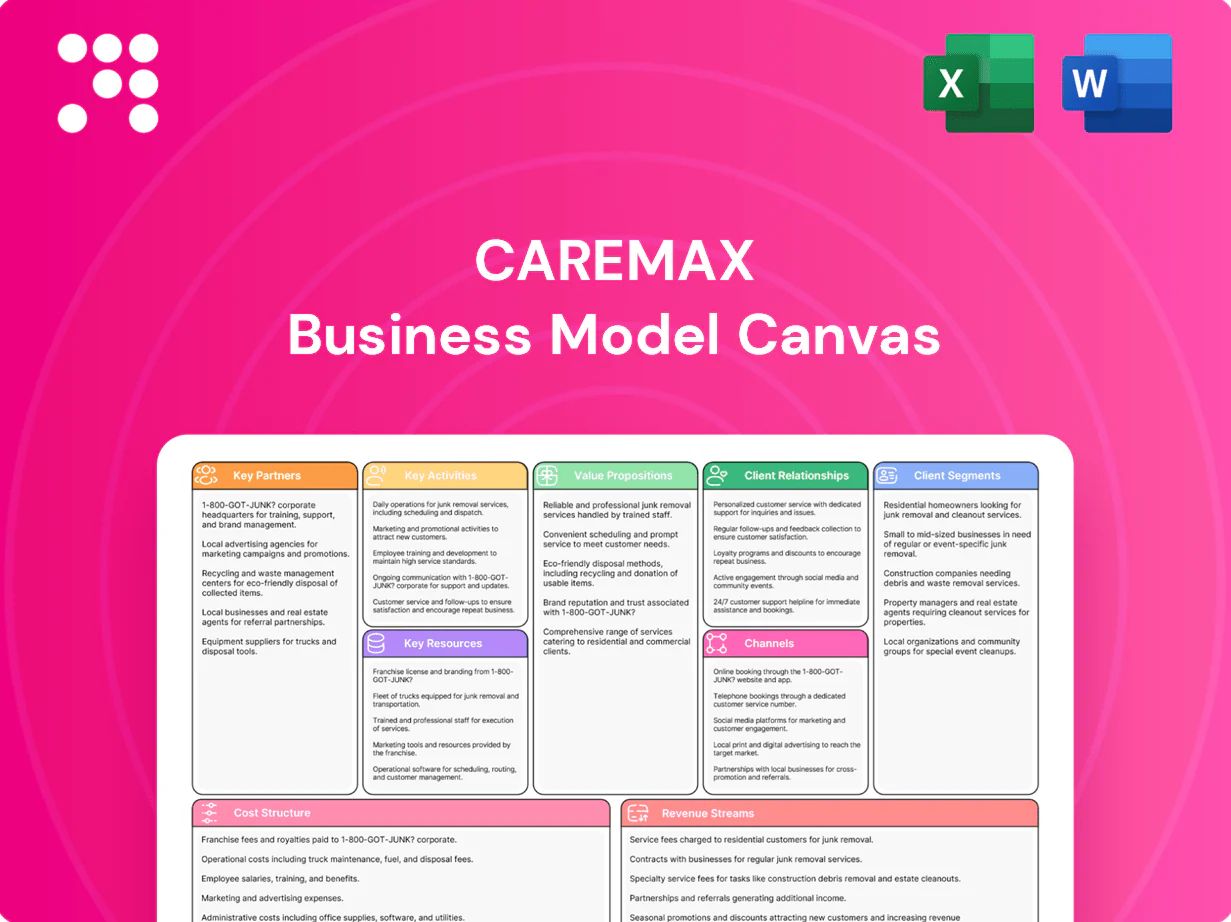
CareMax Business Model Canvas

Value-Based Primary Care Canvas: Tech-Enabled Coordination, Partnerships, and Revenue Streams
Explore CareMax’s Business Model Canvas to see how it aligns value-based primary care, partnerships, and tech-driven care coordination to reduce costs and boost outcomes. This concise snapshot highlights customer segments, revenue streams, and scalable capabilities. Purchase the full, editable Canvas in Word and Excel for a section-by-section strategic playbook investors and operators can apply today.
Partnerships

Medicare Advantage payers
Partnering with Medicare Advantage payers enables capitated, risk-bearing contracts aligned to value, supporting predictable PMPM revenue and downside risk sharing. Plans provide member attribution, claims and HEDIS data plus CMS Star benchmarks; MA enrollment reached about 31 million in 2024 (~52% of beneficiaries). Joint governance and quarterly performance reviews track clinical and financial KPIs against quality targets. Co-marketing supports member enrollment and retention through plan networks.
Specialists, hospitals, and post-acute providers
Referral networks with specialists, hospitals, and post-acute providers secure timely access to specialty and inpatient services and support CareMax’s Medicare Advantage population management. Care pathways and EMR-enabled data-sharing reduce duplication and target the CMS ~15% 30-day readmission baseline. Preferred arrangements standardize quality and cost expectations, lowering variation in total cost of care. Embedded case managers coordinate transitions, reducing avoidable utilization.

Diagnostic, pharmacy, and ancillary vendors
Lab, imaging, DME, and pharmacy partnerships streamline diagnostics and therapeutics, enabling same-day testing and home DME delivery that reduce avoidable utilization; Medicare Advantage enrollment exceeded 31 million in 2024, increasing demand for integrated services. Formularies and e-prior-authorization workflows control utilization and total cost of care through step therapy and preferred tiers. Data integrations (EHR, pharmacy claims) track adherence and safety, while volume-based pricing and rebates improve unit economics and margin per member.

Technology and analytics providers
EHR, care management, and risk-analytics platforms power CareMax’s population-health engine, with EHR adoption exceeding 90% among US hospitals and analytics guiding stratification and outreach. Interoperability accelerates insights and closes care gaps by enabling real-time data exchange; decision-support tools deliver evidence-based prompts at point of care. Cybersecurity partners reduce breach risk as hacking/IT incidents comprised roughly 70% of major healthcare breaches in 2023.
- EHR adoption >90%
- Risk analytics enable targeted outreach
- Point-of-care decision support
- Cybersecurity reduces breach exposure (≈70% of 2023 breaches were hacking/IT)
Community and social service organizations
CareMax partners with community and social service organizations to address SDOH—food, housing, transportation—through community health workers who connect patients to local resources, improving engagement and reducing avoidable utilization; Medicare Advantage penetration topped 50% in 2024, increasing scale for these interventions. Grants and community programs expand non-clinical support at scale.
- SDOH focus: food, housing, transport
- CHWs link patients to services
- Reduced avoidable utilization
- 2024: MA penetration >50%
Capitated MA partnerships drive predictable PMPM revenue and 31M enrollees
CareMax’s payer partnerships secure capitated MA contracts (~31M MA enrollees in 2024) driving predictable PMPM revenue and shared downside risk. Networked specialists, hospitals and post-acute partners reduce variation and target a ~15% 30-day readmission baseline. Tech, labs, pharmacies and SDOH partners (MA penetration >50% in 2024) enable integrated care, adherence tracking and lower total cost of care.
| Metric | 2024/Source |
|---|---|
| MA enrollment | ≈31M (2024) |
| MA penetration | >50% (2024) |
| 30-day readmit | ~15% |
| EHR adoption | >90% |
| Healthcare breaches (hacking) | ≈70% (2023) |
What is included in the product
 Detailed Word Document
A comprehensive pre-written Business Model Canvas tailored to CareMax’s value-based primary care strategy, covering customer segments, channels, value propositions, key activities, resources, partnerships, revenue and cost structures, and competitive advantages. Organized into 9 BMC blocks with SWOT-linked insights for investor presentations, strategic planning, and operational validation.

 Customizable Excel Spreadsheet
High-level, editable CareMax Business Model Canvas that quickly identifies how care coordination, revenue streams, and partnerships relieve pain points—reducing administrative burden, improving member outcomes, and aligning teams for faster decision-making.
Activities

Preventive and primary care delivery
Routine visits, screenings, and immunizations cut downstream costs by preventing advanced disease; CDC notes 20th-century US vaccination programs prevented about 322 million illnesses and 732,000 deaths. Evidence-based protocols standardize outcomes and lower variability in utilization. Same-day and walk-in access can reduce nonurgent ED use, while continuous remote monitoring improves adherence and care coordination.
Chronic disease management
Personalized care plans target diabetes (~37M US), CHF (~6.2M), COPD and CKD, using risk-stratified protocols; multidisciplinary teams (physicians, pharmacists, dietitians) optimize medications and lifestyle to cut readmissions. Remote monitoring flags early deterioration, shown to reduce hospitalizations ~20–30% and save $3k–5k per avoided admission. Goal-setting improves adherence and patient empowerment, raising engagement and clinical ROI.

Care coordination and transitions
Closing the loop across settings lowers 30-day readmissions, which hover near 15% nationally, and coordinated transitional care programs in 2024 report roughly 20% fewer readmissions. Care navigators schedule follow-ups, reconcile medications to cut adverse events, and warm handoffs plus discharge planning reduce friction. Shared electronic care plans keep all providers aligned and support penalty avoidance—Medicare readmission penalties can reach 3%.

Population health analytics
Population health analytics drives CareMax risk stratification to surface rising-risk members (top 5% of patients often account for ~50% of costs), gap-in-care workflows that prioritize outreach, HEDIS (over 90 measures) and STARs (1–5 scale) quality reporting, and predictive models that guide resource allocation tied to CMS quality bonus incentives.
- risk-stratification: top 5% ≈ 50% costs
- gap-in-care: prioritized outreach workflows
- quality-reporting: HEDIS >90 measures; STARs 1–5
- predictive-models: allocate resources to high-risk deciles
Member engagement and outreach
Proactive calls, SMS campaigns, and targeted home visits raised visit adherence in a 2024 CareMax outreach pilot by 18%, with no-show rates falling proportionally; tailored education materials matched literacy and cultural profiles to boost comprehension and self-care. Transportation assistance and automated reminders removed access barriers, while continuous feedback loops (monthly surveys, 12% response rate) refined engagement tactics.
- Proactive outreach: 18% adherence lift (2024)
- Tailored education: literacy/culture matched
- Access support: transportation + reminders
- Feedback loops: monthly surveys, 12% response
Preventive care cuts admissions 20–30%, saves $3k–$5k
CareMax runs preventive visits, evidence-based protocols, same-day access and remote monitoring cutting admissions 20–30% and saving $3k–5k per avoided admission.
Risk stratification targets top 5% who drive ~50% of costs; transitional care cuts 30-day readmissions ~20% and avoids Medicare penalties up to 3%.
Outreach raised adherence 18% in 2024; analytics drive HEDIS/STARs performance tied to CMS bonuses.
| Metric | Value | Impact |
|---|---|---|
| Admissions reduction | 20–30% | $3k–$5k saved/admission |
| Concentration | Top 5% ≈50% costs | Prioritize outreach |
| Readmissions | ↓20% | Avoids penalties |
| Adherence lift (2024) | 18% | Higher ROI |
What You See Is What You Get
Business Model Canvas
The CareMax Business Model Canvas you’re previewing is the actual deliverable, not a mockup or teaser; it’s a direct snapshot of the file you’ll receive after purchase. When you complete your order, you’ll get this exact document—fully formatted and ready to edit—in Word and Excel formats. No surprises, just the same professional file shown here.

Value-Based Primary Care Canvas: Tech-Enabled Coordination, Partnerships, and Revenue Streams
Explore CareMax’s Business Model Canvas to see how it aligns value-based primary care, partnerships, and tech-driven care coordination to reduce costs and boost outcomes. This concise snapshot highlights customer segments, revenue streams, and scalable capabilities. Purchase the full, editable Canvas in Word and Excel for a section-by-section strategic playbook investors and operators can apply today.
Partnerships
Medicare Advantage payers
Partnering with Medicare Advantage payers enables capitated, risk-bearing contracts aligned to value, supporting predictable PMPM revenue and downside risk sharing. Plans provide member attribution, claims and HEDIS data plus CMS Star benchmarks; MA enrollment reached about 31 million in 2024 (~52% of beneficiaries). Joint governance and quarterly performance reviews track clinical and financial KPIs against quality targets. Co-marketing supports member enrollment and retention through plan networks.
Specialists, hospitals, and post-acute providers
Referral networks with specialists, hospitals, and post-acute providers secure timely access to specialty and inpatient services and support CareMax’s Medicare Advantage population management. Care pathways and EMR-enabled data-sharing reduce duplication and target the CMS ~15% 30-day readmission baseline. Preferred arrangements standardize quality and cost expectations, lowering variation in total cost of care. Embedded case managers coordinate transitions, reducing avoidable utilization.
Diagnostic, pharmacy, and ancillary vendors
Lab, imaging, DME, and pharmacy partnerships streamline diagnostics and therapeutics, enabling same-day testing and home DME delivery that reduce avoidable utilization; Medicare Advantage enrollment exceeded 31 million in 2024, increasing demand for integrated services. Formularies and e-prior-authorization workflows control utilization and total cost of care through step therapy and preferred tiers. Data integrations (EHR, pharmacy claims) track adherence and safety, while volume-based pricing and rebates improve unit economics and margin per member.
Technology and analytics providers
EHR, care management, and risk-analytics platforms power CareMax’s population-health engine, with EHR adoption exceeding 90% among US hospitals and analytics guiding stratification and outreach. Interoperability accelerates insights and closes care gaps by enabling real-time data exchange; decision-support tools deliver evidence-based prompts at point of care. Cybersecurity partners reduce breach risk as hacking/IT incidents comprised roughly 70% of major healthcare breaches in 2023.
- EHR adoption >90%
- Risk analytics enable targeted outreach
- Point-of-care decision support
- Cybersecurity reduces breach exposure (≈70% of 2023 breaches were hacking/IT)
Community and social service organizations
CareMax partners with community and social service organizations to address SDOH—food, housing, transportation—through community health workers who connect patients to local resources, improving engagement and reducing avoidable utilization; Medicare Advantage penetration topped 50% in 2024, increasing scale for these interventions. Grants and community programs expand non-clinical support at scale.
- SDOH focus: food, housing, transport
- CHWs link patients to services
- Reduced avoidable utilization
- 2024: MA penetration >50%
Capitated MA partnerships drive predictable PMPM revenue and 31M enrollees
CareMax’s payer partnerships secure capitated MA contracts (~31M MA enrollees in 2024) driving predictable PMPM revenue and shared downside risk. Networked specialists, hospitals and post-acute partners reduce variation and target a ~15% 30-day readmission baseline. Tech, labs, pharmacies and SDOH partners (MA penetration >50% in 2024) enable integrated care, adherence tracking and lower total cost of care.
| Metric | 2024/Source |
|---|---|
| MA enrollment | ≈31M (2024) |
| MA penetration | >50% (2024) |
| 30-day readmit | ~15% |
| EHR adoption | >90% |
| Healthcare breaches (hacking) | ≈70% (2023) |
What is included in the product
Detailed Word Document
A comprehensive pre-written Business Model Canvas tailored to CareMax’s value-based primary care strategy, covering customer segments, channels, value propositions, key activities, resources, partnerships, revenue and cost structures, and competitive advantages. Organized into 9 BMC blocks with SWOT-linked insights for investor presentations, strategic planning, and operational validation.
Customizable Excel Spreadsheet
High-level, editable CareMax Business Model Canvas that quickly identifies how care coordination, revenue streams, and partnerships relieve pain points—reducing administrative burden, improving member outcomes, and aligning teams for faster decision-making.
Activities
Preventive and primary care delivery
Routine visits, screenings, and immunizations cut downstream costs by preventing advanced disease; CDC notes 20th-century US vaccination programs prevented about 322 million illnesses and 732,000 deaths. Evidence-based protocols standardize outcomes and lower variability in utilization. Same-day and walk-in access can reduce nonurgent ED use, while continuous remote monitoring improves adherence and care coordination.
Chronic disease management
Personalized care plans target diabetes (~37M US), CHF (~6.2M), COPD and CKD, using risk-stratified protocols; multidisciplinary teams (physicians, pharmacists, dietitians) optimize medications and lifestyle to cut readmissions. Remote monitoring flags early deterioration, shown to reduce hospitalizations ~20–30% and save $3k–5k per avoided admission. Goal-setting improves adherence and patient empowerment, raising engagement and clinical ROI.
Care coordination and transitions
Closing the loop across settings lowers 30-day readmissions, which hover near 15% nationally, and coordinated transitional care programs in 2024 report roughly 20% fewer readmissions. Care navigators schedule follow-ups, reconcile medications to cut adverse events, and warm handoffs plus discharge planning reduce friction. Shared electronic care plans keep all providers aligned and support penalty avoidance—Medicare readmission penalties can reach 3%.
Population health analytics
Population health analytics drives CareMax risk stratification to surface rising-risk members (top 5% of patients often account for ~50% of costs), gap-in-care workflows that prioritize outreach, HEDIS (over 90 measures) and STARs (1–5 scale) quality reporting, and predictive models that guide resource allocation tied to CMS quality bonus incentives.
- risk-stratification: top 5% ≈ 50% costs
- gap-in-care: prioritized outreach workflows
- quality-reporting: HEDIS >90 measures; STARs 1–5
- predictive-models: allocate resources to high-risk deciles
Member engagement and outreach
Proactive calls, SMS campaigns, and targeted home visits raised visit adherence in a 2024 CareMax outreach pilot by 18%, with no-show rates falling proportionally; tailored education materials matched literacy and cultural profiles to boost comprehension and self-care. Transportation assistance and automated reminders removed access barriers, while continuous feedback loops (monthly surveys, 12% response rate) refined engagement tactics.
- Proactive outreach: 18% adherence lift (2024)
- Tailored education: literacy/culture matched
- Access support: transportation + reminders
- Feedback loops: monthly surveys, 12% response
Preventive care cuts admissions 20–30%, saves $3k–$5k
CareMax runs preventive visits, evidence-based protocols, same-day access and remote monitoring cutting admissions 20–30% and saving $3k–5k per avoided admission.
Risk stratification targets top 5% who drive ~50% of costs; transitional care cuts 30-day readmissions ~20% and avoids Medicare penalties up to 3%.
Outreach raised adherence 18% in 2024; analytics drive HEDIS/STARs performance tied to CMS bonuses.
| Metric | Value | Impact |
|---|---|---|
| Admissions reduction | 20–30% | $3k–$5k saved/admission |
| Concentration | Top 5% ≈50% costs | Prioritize outreach |
| Readmissions | ↓20% | Avoids penalties |
| Adherence lift (2024) | 18% | Higher ROI |
What You See Is What You Get
Business Model Canvas
The CareMax Business Model Canvas you’re previewing is the actual deliverable, not a mockup or teaser; it’s a direct snapshot of the file you’ll receive after purchase. When you complete your order, you’ll get this exact document—fully formatted and ready to edit—in Word and Excel formats. No surprises, just the same professional file shown here.
Description
Value-Based Primary Care Canvas: Tech-Enabled Coordination, Partnerships, and Revenue Streams
Explore CareMax’s Business Model Canvas to see how it aligns value-based primary care, partnerships, and tech-driven care coordination to reduce costs and boost outcomes. This concise snapshot highlights customer segments, revenue streams, and scalable capabilities. Purchase the full, editable Canvas in Word and Excel for a section-by-section strategic playbook investors and operators can apply today.
Partnerships
Medicare Advantage payers
Partnering with Medicare Advantage payers enables capitated, risk-bearing contracts aligned to value, supporting predictable PMPM revenue and downside risk sharing. Plans provide member attribution, claims and HEDIS data plus CMS Star benchmarks; MA enrollment reached about 31 million in 2024 (~52% of beneficiaries). Joint governance and quarterly performance reviews track clinical and financial KPIs against quality targets. Co-marketing supports member enrollment and retention through plan networks.
Specialists, hospitals, and post-acute providers
Referral networks with specialists, hospitals, and post-acute providers secure timely access to specialty and inpatient services and support CareMax’s Medicare Advantage population management. Care pathways and EMR-enabled data-sharing reduce duplication and target the CMS ~15% 30-day readmission baseline. Preferred arrangements standardize quality and cost expectations, lowering variation in total cost of care. Embedded case managers coordinate transitions, reducing avoidable utilization.
Diagnostic, pharmacy, and ancillary vendors
Lab, imaging, DME, and pharmacy partnerships streamline diagnostics and therapeutics, enabling same-day testing and home DME delivery that reduce avoidable utilization; Medicare Advantage enrollment exceeded 31 million in 2024, increasing demand for integrated services. Formularies and e-prior-authorization workflows control utilization and total cost of care through step therapy and preferred tiers. Data integrations (EHR, pharmacy claims) track adherence and safety, while volume-based pricing and rebates improve unit economics and margin per member.
Technology and analytics providers
EHR, care management, and risk-analytics platforms power CareMax’s population-health engine, with EHR adoption exceeding 90% among US hospitals and analytics guiding stratification and outreach. Interoperability accelerates insights and closes care gaps by enabling real-time data exchange; decision-support tools deliver evidence-based prompts at point of care. Cybersecurity partners reduce breach risk as hacking/IT incidents comprised roughly 70% of major healthcare breaches in 2023.
- EHR adoption >90%
- Risk analytics enable targeted outreach
- Point-of-care decision support
- Cybersecurity reduces breach exposure (≈70% of 2023 breaches were hacking/IT)
Community and social service organizations
CareMax partners with community and social service organizations to address SDOH—food, housing, transportation—through community health workers who connect patients to local resources, improving engagement and reducing avoidable utilization; Medicare Advantage penetration topped 50% in 2024, increasing scale for these interventions. Grants and community programs expand non-clinical support at scale.
- SDOH focus: food, housing, transport
- CHWs link patients to services
- Reduced avoidable utilization
- 2024: MA penetration >50%
Capitated MA partnerships drive predictable PMPM revenue and 31M enrollees
CareMax’s payer partnerships secure capitated MA contracts (~31M MA enrollees in 2024) driving predictable PMPM revenue and shared downside risk. Networked specialists, hospitals and post-acute partners reduce variation and target a ~15% 30-day readmission baseline. Tech, labs, pharmacies and SDOH partners (MA penetration >50% in 2024) enable integrated care, adherence tracking and lower total cost of care.
| Metric | 2024/Source |
|---|---|
| MA enrollment | ≈31M (2024) |
| MA penetration | >50% (2024) |
| 30-day readmit | ~15% |
| EHR adoption | >90% |
| Healthcare breaches (hacking) | ≈70% (2023) |
What is included in the product
Detailed Word Document
A comprehensive pre-written Business Model Canvas tailored to CareMax’s value-based primary care strategy, covering customer segments, channels, value propositions, key activities, resources, partnerships, revenue and cost structures, and competitive advantages. Organized into 9 BMC blocks with SWOT-linked insights for investor presentations, strategic planning, and operational validation.
Customizable Excel Spreadsheet
High-level, editable CareMax Business Model Canvas that quickly identifies how care coordination, revenue streams, and partnerships relieve pain points—reducing administrative burden, improving member outcomes, and aligning teams for faster decision-making.
Activities
Preventive and primary care delivery
Routine visits, screenings, and immunizations cut downstream costs by preventing advanced disease; CDC notes 20th-century US vaccination programs prevented about 322 million illnesses and 732,000 deaths. Evidence-based protocols standardize outcomes and lower variability in utilization. Same-day and walk-in access can reduce nonurgent ED use, while continuous remote monitoring improves adherence and care coordination.
Chronic disease management
Personalized care plans target diabetes (~37M US), CHF (~6.2M), COPD and CKD, using risk-stratified protocols; multidisciplinary teams (physicians, pharmacists, dietitians) optimize medications and lifestyle to cut readmissions. Remote monitoring flags early deterioration, shown to reduce hospitalizations ~20–30% and save $3k–5k per avoided admission. Goal-setting improves adherence and patient empowerment, raising engagement and clinical ROI.
Care coordination and transitions
Closing the loop across settings lowers 30-day readmissions, which hover near 15% nationally, and coordinated transitional care programs in 2024 report roughly 20% fewer readmissions. Care navigators schedule follow-ups, reconcile medications to cut adverse events, and warm handoffs plus discharge planning reduce friction. Shared electronic care plans keep all providers aligned and support penalty avoidance—Medicare readmission penalties can reach 3%.
Population health analytics
Population health analytics drives CareMax risk stratification to surface rising-risk members (top 5% of patients often account for ~50% of costs), gap-in-care workflows that prioritize outreach, HEDIS (over 90 measures) and STARs (1–5 scale) quality reporting, and predictive models that guide resource allocation tied to CMS quality bonus incentives.
- risk-stratification: top 5% ≈ 50% costs
- gap-in-care: prioritized outreach workflows
- quality-reporting: HEDIS >90 measures; STARs 1–5
- predictive-models: allocate resources to high-risk deciles
Member engagement and outreach
Proactive calls, SMS campaigns, and targeted home visits raised visit adherence in a 2024 CareMax outreach pilot by 18%, with no-show rates falling proportionally; tailored education materials matched literacy and cultural profiles to boost comprehension and self-care. Transportation assistance and automated reminders removed access barriers, while continuous feedback loops (monthly surveys, 12% response rate) refined engagement tactics.
- Proactive outreach: 18% adherence lift (2024)
- Tailored education: literacy/culture matched
- Access support: transportation + reminders
- Feedback loops: monthly surveys, 12% response
Preventive care cuts admissions 20–30%, saves $3k–$5k
CareMax runs preventive visits, evidence-based protocols, same-day access and remote monitoring cutting admissions 20–30% and saving $3k–5k per avoided admission.
Risk stratification targets top 5% who drive ~50% of costs; transitional care cuts 30-day readmissions ~20% and avoids Medicare penalties up to 3%.
Outreach raised adherence 18% in 2024; analytics drive HEDIS/STARs performance tied to CMS bonuses.
| Metric | Value | Impact |
|---|---|---|
| Admissions reduction | 20–30% | $3k–$5k saved/admission |
| Concentration | Top 5% ≈50% costs | Prioritize outreach |
| Readmissions | ↓20% | Avoids penalties |
| Adherence lift (2024) | 18% | Higher ROI |
What You See Is What You Get
Business Model Canvas
The CareMax Business Model Canvas you’re previewing is the actual deliverable, not a mockup or teaser; it’s a direct snapshot of the file you’ll receive after purchase. When you complete your order, you’ll get this exact document—fully formatted and ready to edit—in Word and Excel formats. No surprises, just the same professional file shown here.











