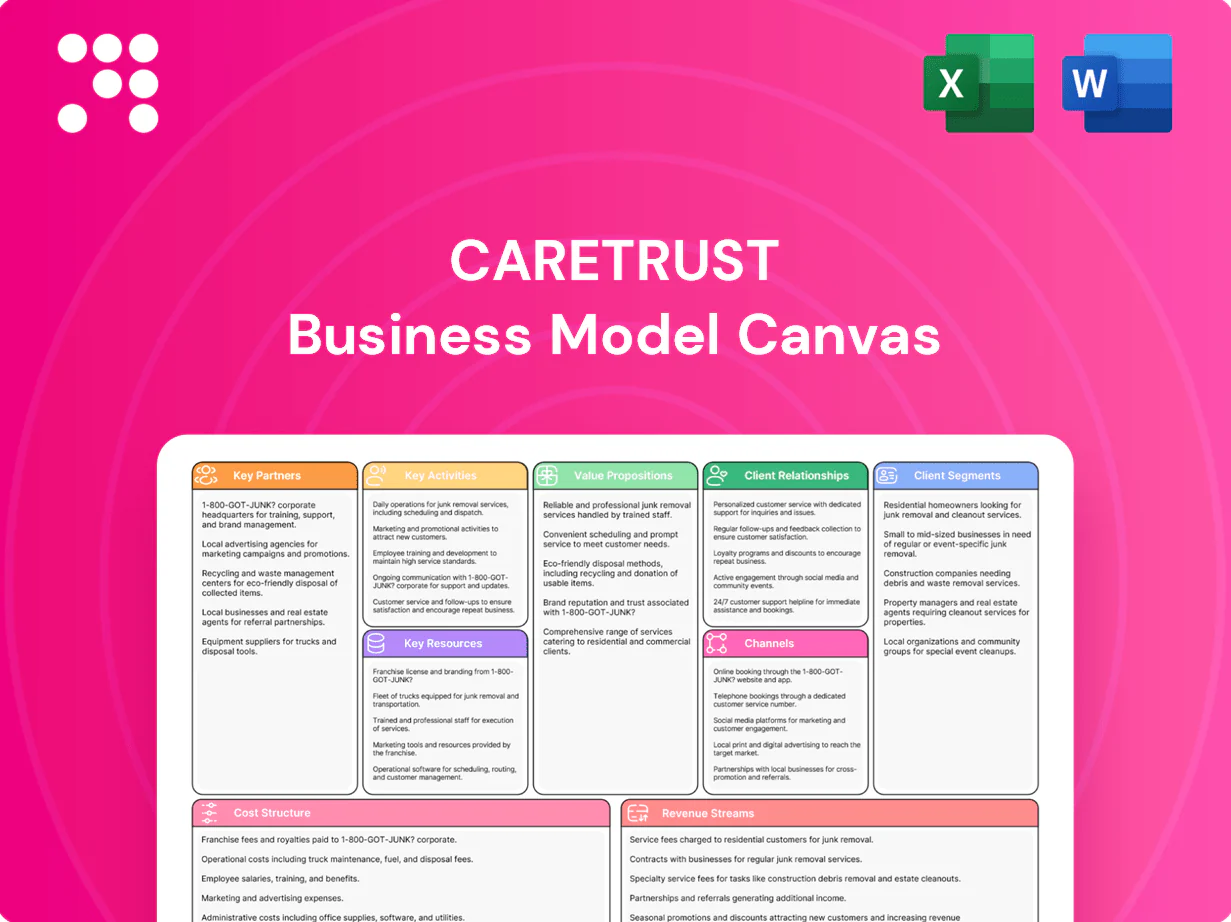
CareTrust Business Model Canvas

Healthcare REIT Business Model Canvas: Key value props, partners, and revenue levers
Explore CareTrust’s Business Model Canvas to see how its value propositions, partnerships, and revenue streams align to drive growth in healthcare real estate; this concise analysis highlights strengths, risks, and scaling levers. Download the full, editable Canvas for a detailed, section-by-section playbook ideal for investors, advisors, and strategists.
Partnerships

Regional and Local Senior Care Operators
Primary partners are skilled nursing, assisted living and independent living operators who lease properties under long-term triple-net agreements (typical terms 10–25 years) and supply operating expertise and occupancy performance that underpin rent coverage. Strong operator selection and active relationship management materially reduce default risk and stabilize cash flow when occupancy stays above ~70%. Co-development and expansions align incentives and drive portfolio yield through shared capex and rent escalators.
Healthcare Developers and Construction Firms
External developers source shovel-ready projects and execute ground-up builds or redevelopments, with fixed-price contracts and milestone controls mitigating timeline and budget risk; in 2024 developers reporting disciplined contracting saw lower schedule variance. Partnerships improve pipeline visibility and speed-to-market, and co-invest arrangements in 2024 continued to optimize returns and reduce balance-sheet deployment.

Lenders, Banks, and Capital Markets Intermediaries
Credit facilities, term loans and unsecured notes fund acquisitions and development, with banking partners supplying hedging, covenant structuring and liquidity lines; in 2024 markets this activity competes against a fed funds benchmark near 5.25–5.50 percent. Relationship syndicates enable rapid scaling and opportunistic deployment across portfolios, while equity underwriters facilitate follow-ons or ATM programs to refill capital pools.

Regulatory and Reimbursement Advisors
Brokerage Networks and M&A Advisors
Brokerage networks and M&A advisors source off-market deals and introduce operators while supplying valuation comps, market intelligence and transaction support; they also provide real-time insights to navigate competitive processes and sustain acquisition flow through mandated sale pipelines.
- Off-market sourcing
- Valuation comps & market intel
- Real-time competitive insights
- Mandated sale pipelines = steady volume
Operators & developers drive occupancy; debt priced to fed funds 5.25–5.50%
Primary partnerships: operators (NNN leases 10–25 yrs) and developers drive occupancy and pipeline; lenders and underwriters supply debt/equity (fed funds ~5.25–5.50% in 2024); CMS/Medicaid advisors guide reimbursement (Medicaid ~84M, MA enrollment 30M in 2024); brokers/M&A deliver off-market flow.
| Partner | Key metric |
|---|---|
| Operators | Leases 10–25y |
| Developers | Fixed-price contracts |
| Lenders | Fed funds 5.25–5.50% |
| Payers | Medicaid 84M; MA 30M |
What is included in the product
 Detailed Word Document
A concise, pre-written Business Model Canvas tailored to CareTrust’s strategy, detailing customer segments, value propositions, channels and revenue streams, with SWOT-linked insights and competitive advantages for investor or internal use.

 Customizable Excel Spreadsheet
High-level view of CareTrust’s business model with editable cells to quickly map revenue drivers and expense pain points. Shareable one-page snapshot streamlines team alignment, saves hours of structuring, and makes comparing strategies fast and actionable.
Activities

Acquisition Sourcing and Underwriting
Identify healthcare properties and operators with durable cash flows, prioritizing assets serving Medicare Advantage populations—Medicare Advantage enrollment exceeded 50% of Medicare beneficiaries in 2024.
Underwrite rent coverage, payer mix, and market demographics, stress-testing reimbursement and occupancy under downside scenarios (eg 10–20% payment or occupancy shocks).
Structure terms to balance yield and operator sustainability through step rents, COLA clauses, and operator covenants tied to performance.
Lease Structuring and Asset Management
Negotiate long-term triple-net leases with typical annual escalators of 2–3% and coverage covenants targeting rent coverage ratios near 1.2x to protect cashflow. Monitor operator performance via property-level KPIs — occupancy, EBITDA margin and days receivable — benchmarking to industry 2024 senior housing occupancy ~78%. Execute rent resets, term extensions or cure plans when coverage slips, and optimize portfolio mix to keep tenant concentration below ~15% per counterparty.

Development and Redevelopment Oversight
Manage ground-up builds and value-add renovations across CareTrust's portfolio, controlling budgets, schedules, and entitlement milestones to meet projected returns; typical triple-net medical leases exceed 10 years. Align designs with clinical and operational needs to reduce occupancy downtime and accelerate stabilization. Deliver stabilized assets into long-term leases to secure predictable rental cash flows.

Capital Allocation and Balance Sheet Management
Deploy capital to the highest risk-adjusted return opportunities while referencing a 2024 federal funds target range of 5.25–5.50% that influences yield targets; maintain prudent leverage and liquidity buffers to preserve optionality. Use committed credit lines, term debt and equity tools to fund accretive acquisitions and portfolio investments. Hedge interest-rate exposure with swaps or caps where appropriate to control cash-flow volatility.
- Deploy to highest risk-adjusted returns
- Maintain prudent leverage/liquidity
- Use credit lines, term debt, equity
- Hedge interest-rate exposure (2024 Fed funds 5.25–5.50%)
Operator Relationship Management
Operator Relationship Management requires continuous dialogue on operations and strategy, supporting expansions, transitions and turnaround plans while facilitating best-practice sharing and market entry; ensure compliance and a strict reporting cadence to protect portfolio cash flow. In 2024 the U.S. 65+ population remained a primary demand driver, exceeding 58 million in 2023 and sustaining long-term care demand.
- Engage ops & strategy
- Support expansions/transitions
- Share best practices/market entry
- Ensure compliance & reporting cadence
Source MA > 50% senior housing; stress-test 10-20% shocks; cap conc under 15%
Source and underwrite healthcare properties focused on Medicare Advantage populations (MA >50% of beneficiaries in 2024), stress-testing 10–20% reimbursement/occupancy shocks.
Structure long-term triple-net leases (typical escalators 2–3%, target coverage ~1.2x) and manage operator KPIs (occupancy, EBITDA, DSO).
Deploy capital with prudent leverage, hedge interest-rate exposure (2024 Fed funds 5.25–5.50%) and limit counterparty concentration <15%.
| Metric | 2023/24 |
|---|---|
| Medicare Advantage share | >50% (2024) |
| Senior housing occ. | ~78% (2024) |
| Fed funds target | 5.25–5.50% (2024) |
| 65+ population | >58M (2023) |
What You See Is What You Get
Business Model Canvas
The CareTrust Business Model Canvas you’re previewing is the actual deliverable, not a mockup—what you see is a direct extract of the final file. Upon purchase you’ll receive this same comprehensive document, formatted and ready for use, with all sections intact. It’s editable and presentation-ready so you can apply, customize, or share immediately.

Healthcare REIT Business Model Canvas: Key value props, partners, and revenue levers
Explore CareTrust’s Business Model Canvas to see how its value propositions, partnerships, and revenue streams align to drive growth in healthcare real estate; this concise analysis highlights strengths, risks, and scaling levers. Download the full, editable Canvas for a detailed, section-by-section playbook ideal for investors, advisors, and strategists.
Partnerships
Regional and Local Senior Care Operators
Primary partners are skilled nursing, assisted living and independent living operators who lease properties under long-term triple-net agreements (typical terms 10–25 years) and supply operating expertise and occupancy performance that underpin rent coverage. Strong operator selection and active relationship management materially reduce default risk and stabilize cash flow when occupancy stays above ~70%. Co-development and expansions align incentives and drive portfolio yield through shared capex and rent escalators.
Healthcare Developers and Construction Firms
External developers source shovel-ready projects and execute ground-up builds or redevelopments, with fixed-price contracts and milestone controls mitigating timeline and budget risk; in 2024 developers reporting disciplined contracting saw lower schedule variance. Partnerships improve pipeline visibility and speed-to-market, and co-invest arrangements in 2024 continued to optimize returns and reduce balance-sheet deployment.
Lenders, Banks, and Capital Markets Intermediaries
Credit facilities, term loans and unsecured notes fund acquisitions and development, with banking partners supplying hedging, covenant structuring and liquidity lines; in 2024 markets this activity competes against a fed funds benchmark near 5.25–5.50 percent. Relationship syndicates enable rapid scaling and opportunistic deployment across portfolios, while equity underwriters facilitate follow-ons or ATM programs to refill capital pools.
Regulatory and Reimbursement Advisors
Brokerage Networks and M&A Advisors
Brokerage networks and M&A advisors source off-market deals and introduce operators while supplying valuation comps, market intelligence and transaction support; they also provide real-time insights to navigate competitive processes and sustain acquisition flow through mandated sale pipelines.
- Off-market sourcing
- Valuation comps & market intel
- Real-time competitive insights
- Mandated sale pipelines = steady volume
Operators & developers drive occupancy; debt priced to fed funds 5.25–5.50%
Primary partnerships: operators (NNN leases 10–25 yrs) and developers drive occupancy and pipeline; lenders and underwriters supply debt/equity (fed funds ~5.25–5.50% in 2024); CMS/Medicaid advisors guide reimbursement (Medicaid ~84M, MA enrollment 30M in 2024); brokers/M&A deliver off-market flow.
| Partner | Key metric |
|---|---|
| Operators | Leases 10–25y |
| Developers | Fixed-price contracts |
| Lenders | Fed funds 5.25–5.50% |
| Payers | Medicaid 84M; MA 30M |
What is included in the product
Detailed Word Document
A concise, pre-written Business Model Canvas tailored to CareTrust’s strategy, detailing customer segments, value propositions, channels and revenue streams, with SWOT-linked insights and competitive advantages for investor or internal use.
Customizable Excel Spreadsheet
High-level view of CareTrust’s business model with editable cells to quickly map revenue drivers and expense pain points. Shareable one-page snapshot streamlines team alignment, saves hours of structuring, and makes comparing strategies fast and actionable.
Activities
Acquisition Sourcing and Underwriting
Identify healthcare properties and operators with durable cash flows, prioritizing assets serving Medicare Advantage populations—Medicare Advantage enrollment exceeded 50% of Medicare beneficiaries in 2024.
Underwrite rent coverage, payer mix, and market demographics, stress-testing reimbursement and occupancy under downside scenarios (eg 10–20% payment or occupancy shocks).
Structure terms to balance yield and operator sustainability through step rents, COLA clauses, and operator covenants tied to performance.
Lease Structuring and Asset Management
Negotiate long-term triple-net leases with typical annual escalators of 2–3% and coverage covenants targeting rent coverage ratios near 1.2x to protect cashflow. Monitor operator performance via property-level KPIs — occupancy, EBITDA margin and days receivable — benchmarking to industry 2024 senior housing occupancy ~78%. Execute rent resets, term extensions or cure plans when coverage slips, and optimize portfolio mix to keep tenant concentration below ~15% per counterparty.
Development and Redevelopment Oversight
Manage ground-up builds and value-add renovations across CareTrust's portfolio, controlling budgets, schedules, and entitlement milestones to meet projected returns; typical triple-net medical leases exceed 10 years. Align designs with clinical and operational needs to reduce occupancy downtime and accelerate stabilization. Deliver stabilized assets into long-term leases to secure predictable rental cash flows.
Capital Allocation and Balance Sheet Management
Deploy capital to the highest risk-adjusted return opportunities while referencing a 2024 federal funds target range of 5.25–5.50% that influences yield targets; maintain prudent leverage and liquidity buffers to preserve optionality. Use committed credit lines, term debt and equity tools to fund accretive acquisitions and portfolio investments. Hedge interest-rate exposure with swaps or caps where appropriate to control cash-flow volatility.
- Deploy to highest risk-adjusted returns
- Maintain prudent leverage/liquidity
- Use credit lines, term debt, equity
- Hedge interest-rate exposure (2024 Fed funds 5.25–5.50%)
Operator Relationship Management
Operator Relationship Management requires continuous dialogue on operations and strategy, supporting expansions, transitions and turnaround plans while facilitating best-practice sharing and market entry; ensure compliance and a strict reporting cadence to protect portfolio cash flow. In 2024 the U.S. 65+ population remained a primary demand driver, exceeding 58 million in 2023 and sustaining long-term care demand.
- Engage ops & strategy
- Support expansions/transitions
- Share best practices/market entry
- Ensure compliance & reporting cadence
Source MA > 50% senior housing; stress-test 10-20% shocks; cap conc under 15%
Source and underwrite healthcare properties focused on Medicare Advantage populations (MA >50% of beneficiaries in 2024), stress-testing 10–20% reimbursement/occupancy shocks.
Structure long-term triple-net leases (typical escalators 2–3%, target coverage ~1.2x) and manage operator KPIs (occupancy, EBITDA, DSO).
Deploy capital with prudent leverage, hedge interest-rate exposure (2024 Fed funds 5.25–5.50%) and limit counterparty concentration <15%.
| Metric | 2023/24 |
|---|---|
| Medicare Advantage share | >50% (2024) |
| Senior housing occ. | ~78% (2024) |
| Fed funds target | 5.25–5.50% (2024) |
| 65+ population | >58M (2023) |
What You See Is What You Get
Business Model Canvas
The CareTrust Business Model Canvas you’re previewing is the actual deliverable, not a mockup—what you see is a direct extract of the final file. Upon purchase you’ll receive this same comprehensive document, formatted and ready for use, with all sections intact. It’s editable and presentation-ready so you can apply, customize, or share immediately.
Original: $10.00
-65%$10.00
$3.50Description
Healthcare REIT Business Model Canvas: Key value props, partners, and revenue levers
Explore CareTrust’s Business Model Canvas to see how its value propositions, partnerships, and revenue streams align to drive growth in healthcare real estate; this concise analysis highlights strengths, risks, and scaling levers. Download the full, editable Canvas for a detailed, section-by-section playbook ideal for investors, advisors, and strategists.
Partnerships
Regional and Local Senior Care Operators
Primary partners are skilled nursing, assisted living and independent living operators who lease properties under long-term triple-net agreements (typical terms 10–25 years) and supply operating expertise and occupancy performance that underpin rent coverage. Strong operator selection and active relationship management materially reduce default risk and stabilize cash flow when occupancy stays above ~70%. Co-development and expansions align incentives and drive portfolio yield through shared capex and rent escalators.
Healthcare Developers and Construction Firms
External developers source shovel-ready projects and execute ground-up builds or redevelopments, with fixed-price contracts and milestone controls mitigating timeline and budget risk; in 2024 developers reporting disciplined contracting saw lower schedule variance. Partnerships improve pipeline visibility and speed-to-market, and co-invest arrangements in 2024 continued to optimize returns and reduce balance-sheet deployment.
Lenders, Banks, and Capital Markets Intermediaries
Credit facilities, term loans and unsecured notes fund acquisitions and development, with banking partners supplying hedging, covenant structuring and liquidity lines; in 2024 markets this activity competes against a fed funds benchmark near 5.25–5.50 percent. Relationship syndicates enable rapid scaling and opportunistic deployment across portfolios, while equity underwriters facilitate follow-ons or ATM programs to refill capital pools.
Regulatory and Reimbursement Advisors
Brokerage Networks and M&A Advisors
Brokerage networks and M&A advisors source off-market deals and introduce operators while supplying valuation comps, market intelligence and transaction support; they also provide real-time insights to navigate competitive processes and sustain acquisition flow through mandated sale pipelines.
- Off-market sourcing
- Valuation comps & market intel
- Real-time competitive insights
- Mandated sale pipelines = steady volume
Operators & developers drive occupancy; debt priced to fed funds 5.25–5.50%
Primary partnerships: operators (NNN leases 10–25 yrs) and developers drive occupancy and pipeline; lenders and underwriters supply debt/equity (fed funds ~5.25–5.50% in 2024); CMS/Medicaid advisors guide reimbursement (Medicaid ~84M, MA enrollment 30M in 2024); brokers/M&A deliver off-market flow.
| Partner | Key metric |
|---|---|
| Operators | Leases 10–25y |
| Developers | Fixed-price contracts |
| Lenders | Fed funds 5.25–5.50% |
| Payers | Medicaid 84M; MA 30M |
What is included in the product
Detailed Word Document
A concise, pre-written Business Model Canvas tailored to CareTrust’s strategy, detailing customer segments, value propositions, channels and revenue streams, with SWOT-linked insights and competitive advantages for investor or internal use.
Customizable Excel Spreadsheet
High-level view of CareTrust’s business model with editable cells to quickly map revenue drivers and expense pain points. Shareable one-page snapshot streamlines team alignment, saves hours of structuring, and makes comparing strategies fast and actionable.
Activities
Acquisition Sourcing and Underwriting
Identify healthcare properties and operators with durable cash flows, prioritizing assets serving Medicare Advantage populations—Medicare Advantage enrollment exceeded 50% of Medicare beneficiaries in 2024.
Underwrite rent coverage, payer mix, and market demographics, stress-testing reimbursement and occupancy under downside scenarios (eg 10–20% payment or occupancy shocks).
Structure terms to balance yield and operator sustainability through step rents, COLA clauses, and operator covenants tied to performance.
Lease Structuring and Asset Management
Negotiate long-term triple-net leases with typical annual escalators of 2–3% and coverage covenants targeting rent coverage ratios near 1.2x to protect cashflow. Monitor operator performance via property-level KPIs — occupancy, EBITDA margin and days receivable — benchmarking to industry 2024 senior housing occupancy ~78%. Execute rent resets, term extensions or cure plans when coverage slips, and optimize portfolio mix to keep tenant concentration below ~15% per counterparty.
Development and Redevelopment Oversight
Manage ground-up builds and value-add renovations across CareTrust's portfolio, controlling budgets, schedules, and entitlement milestones to meet projected returns; typical triple-net medical leases exceed 10 years. Align designs with clinical and operational needs to reduce occupancy downtime and accelerate stabilization. Deliver stabilized assets into long-term leases to secure predictable rental cash flows.
Capital Allocation and Balance Sheet Management
Deploy capital to the highest risk-adjusted return opportunities while referencing a 2024 federal funds target range of 5.25–5.50% that influences yield targets; maintain prudent leverage and liquidity buffers to preserve optionality. Use committed credit lines, term debt and equity tools to fund accretive acquisitions and portfolio investments. Hedge interest-rate exposure with swaps or caps where appropriate to control cash-flow volatility.
- Deploy to highest risk-adjusted returns
- Maintain prudent leverage/liquidity
- Use credit lines, term debt, equity
- Hedge interest-rate exposure (2024 Fed funds 5.25–5.50%)
Operator Relationship Management
Operator Relationship Management requires continuous dialogue on operations and strategy, supporting expansions, transitions and turnaround plans while facilitating best-practice sharing and market entry; ensure compliance and a strict reporting cadence to protect portfolio cash flow. In 2024 the U.S. 65+ population remained a primary demand driver, exceeding 58 million in 2023 and sustaining long-term care demand.
- Engage ops & strategy
- Support expansions/transitions
- Share best practices/market entry
- Ensure compliance & reporting cadence
Source MA > 50% senior housing; stress-test 10-20% shocks; cap conc under 15%
Source and underwrite healthcare properties focused on Medicare Advantage populations (MA >50% of beneficiaries in 2024), stress-testing 10–20% reimbursement/occupancy shocks.
Structure long-term triple-net leases (typical escalators 2–3%, target coverage ~1.2x) and manage operator KPIs (occupancy, EBITDA, DSO).
Deploy capital with prudent leverage, hedge interest-rate exposure (2024 Fed funds 5.25–5.50%) and limit counterparty concentration <15%.
| Metric | 2023/24 |
|---|---|
| Medicare Advantage share | >50% (2024) |
| Senior housing occ. | ~78% (2024) |
| Fed funds target | 5.25–5.50% (2024) |
| 65+ population | >58M (2023) |
What You See Is What You Get
Business Model Canvas
The CareTrust Business Model Canvas you’re previewing is the actual deliverable, not a mockup—what you see is a direct extract of the final file. Upon purchase you’ll receive this same comprehensive document, formatted and ready for use, with all sections intact. It’s editable and presentation-ready so you can apply, customize, or share immediately.











