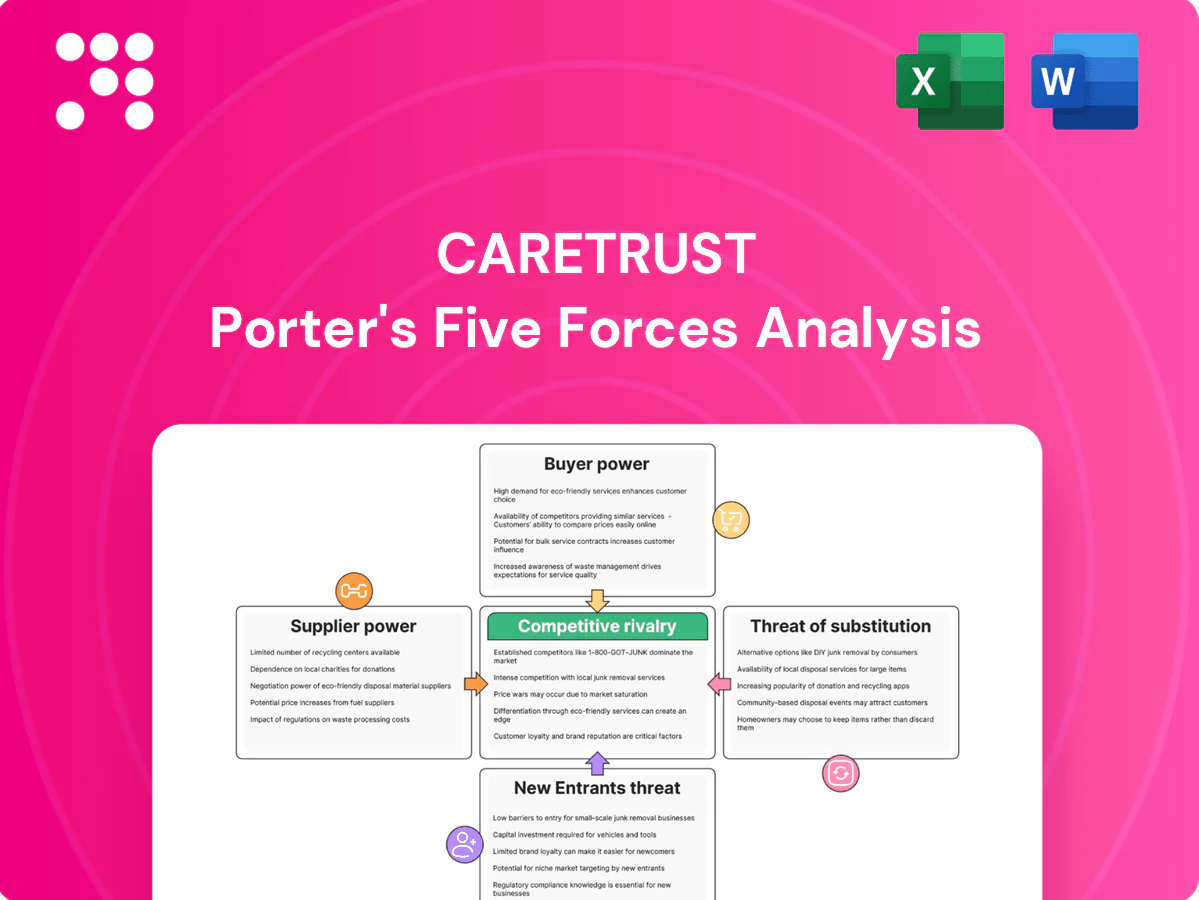
CareTrust Porter's Five Forces Analysis

Don't Miss the Bigger Picture
CareTrust faces moderate buyer power, concentrated operator clients, evolving reimbursement pressures, and steady threat from new REIT entrants amid specialized healthcare demand; supplier leverage is contained but regulatory shifts raise risk. This snapshot highlights key competitive tensions and strategic implications. Unlock the full Porter's Five Forces Analysis to explore force-by-force ratings, visuals, and actionable insights tailored to CareTrust.
Suppliers Bargaining Power

Constrained pipeline of quality assets
High-quality skilled nursing and senior housing assets are finite, so sellers and developers retained pricing leverage in 2024; portfolios with strong operating partners routinely drew multiple bidders, driving competition for accretive deals and pressuring acquisition yields while tightening underwriting spreads.
Capital providers influence cost
Debt and equity markets are key suppliers of capital to CareTrust; with the US federal funds target at 5.25–5.50% and the 10‑year Treasury near 4.2% at end‑2024, benchmark rates materially raise its funding cost. Wider corporate credit spreads in 2024 increased borrowing margins, while lenders commonly impose covenants and financing structures that constrain leverage. These dynamics directly affect transaction feasibility and expected returns for CareTrust.

Regulatory and zoning gatekeepers
Regulatory and zoning gatekeepers (licensing, CON regimes and local zoning boards) tightly control new long-term care supply; as of 2024, about 35 states maintain some form of Certificate of Need that limits facility additions, concentrating entitlement power. Approvals can be slow and uncertain, raising development risk and costs and often extending timelines by months to years. Municipalities frequently extract concessions or impact fees, and when entitlements are scarce this elevates supplier bargaining leverage over operators and REITs like CareTrust (CTRE).

Construction and labor inputs
Operator selection dependency
Sellers often bundle assets with incumbent operators or mandate transition support at acquisition, constraining buyer flexibility. Limited availability of strong regional operators concentrates choice amid roughly 15,000 US nursing homes (CMS, 2024), which can shift negotiation leverage toward sellers. Buyers may need to offer deal-level incentives or premiums to secure operator alignment and smooth transitions.
- Bundling/transition mandates
- ~15,000 US nursing homes (CMS 2024)
- Operator scarcity raises seller leverage
- Incentives/premiums often required
Tight SNF supply and higher capital costs bolster seller pricing power, compressing yields
Finite high-quality SNF and senior housing supply sustained seller pricing power in 2024, driving competitive bidding and tighter acquisition yields. Capital costs rose with Fed funds at 5.25–5.50% and the 10‑yr Treasury ~4.2%, widening lending margins and covenant constraints. Regulatory limits (≈35 states with CON) and operator scarcity across ~15,000 nursing homes increased supplier leverage and deal premiums.
| Metric | 2024 |
|---|---|
| Fed funds | 5.25–5.50% |
| 10‑yr Treasury | ~4.2% |
| States w/ CON | ≈35 |
| US nursing homes | ≈15,000 |
| Unemployment | ≈4.0% |
What is included in the product
 Detailed Word Document
Tailored Porter's Five Forces analysis for CareTrust that uncovers competitive drivers, buyer and supplier power, entry barriers, substitutes, and emerging threats to its REIT healthcare portfolio, with strategic implications for pricing, profitability, and market positioning.

 Customizable Excel Spreadsheet
CareTrust Porter's Five Forces delivers a clean one-sheet summary and interactive spider chart to instantly visualize competitive pressure, customizable for changing market data—perfect for quick decision-making and ready to drop into pitch decks or dashboards.
Customers Bargaining Power

Concentrated tenant base risk
Concentrated tenant base—regional operators provide a meaningful share of CareTrust’s rent, giving them leverage at lease rollover or in distress; as of 2024 the top 10 tenants account for about 34% of rental income. In downturns rent deferrals or restructurings have occurred, pressuring cash flow and covenants. Credit concentration heightens customer bargaining power, though portfolio diversification through acquisitions reduces this risk over time.
Alternative capital options
Operators can access at least 4 distinct capital sources—bank financing, HUD loans, bridge lenders, and sale-leasebacks—which raises tenant leverage over rent and covenant terms. Greater lender competition means competitive term sheets pressure pricing, often compressing spreads by roughly 50–150 basis points in deal markets. Deep operator-landlord relationships can reduce switching, preserving rent and covenant stability.

Triple-net structure limits exposure
Triple-net structure (typically 10–20 year leases) shifts capex and operating costs to tenants, reducing landlord friction and volatility; fixed escalators commonly run 2–3% annually and master leases limit renegotiation windows. When operator EBITDA margins compress to low single digits (seen across skilled-nursing in 2023–2024), tenants press for relief, but tenant credit profiles ultimately anchor bargaining leverage.

Switching and relocation frictions
Operators face substantial costs and regulatory hurdles to move licenses or beds; in 2024 the US had about 15,600 nursing homes and roughly 1.7 million licensed beds (CMS), making relocations complex. Patient continuity and staff retention deter moves, reducing tenant leverage mid-lease, while tenant bargaining power increases as leases near expiry.
Information and performance transparency
Landlords closely monitor coverage ratios, census, and payer mix; industry senior housing occupancy averaged about 80% in 2024, reducing information asymmetry and strengthening landlord negotiating position. Better, timely data (monthly census, payer breakdown, DSCR) tightens leverage; weak reporting raises tenant bargaining power. Financial covenants tied to these metrics (for example DSCR >1.2) can rebalance power.
- Metrics tracked: coverage ratios, census, payer mix
- 2024 industry occupancy ~80% — improves landlord visibility
- Covenants (DSCR >1.2) shift leverage toward landlords
Tenant concentration 34%, occupancy 80%, lease leverage
CareTrust tenant concentration (top10 ≈34% of rent in 2024) and access to multiple capital sources give operators meaningful leverage at renewal or distress; triple-net long leases and high relocation complexity (15,600 facilities, 1.7M beds in 2024) limit mid-lease bargaining but power rises near expiry. Occupancy ~80% (2024) and covenants (DSCR >1.2) shift leverage toward landlords when reported.
| Metric | 2024 |
|---|---|
| Top10 rent share | ≈34% |
| US facilities / beds | 15,600 / 1.7M |
| Occupancy | ≈80% |
| Escalators | 2–3% |
| Key covenant | DSCR >1.2 |
Full Version Awaits
CareTrust Porter's Five Forces Analysis
This preview shows the exact CareTrust Porter's Five Forces Analysis you'll receive after purchase—no placeholders or mockups. The file is fully formatted, professionally written, and includes the complete, final assessment. You'll have immediate access to this identical document for download and use.

Don't Miss the Bigger Picture
CareTrust faces moderate buyer power, concentrated operator clients, evolving reimbursement pressures, and steady threat from new REIT entrants amid specialized healthcare demand; supplier leverage is contained but regulatory shifts raise risk. This snapshot highlights key competitive tensions and strategic implications. Unlock the full Porter's Five Forces Analysis to explore force-by-force ratings, visuals, and actionable insights tailored to CareTrust.
Suppliers Bargaining Power
Constrained pipeline of quality assets
High-quality skilled nursing and senior housing assets are finite, so sellers and developers retained pricing leverage in 2024; portfolios with strong operating partners routinely drew multiple bidders, driving competition for accretive deals and pressuring acquisition yields while tightening underwriting spreads.
Capital providers influence cost
Debt and equity markets are key suppliers of capital to CareTrust; with the US federal funds target at 5.25–5.50% and the 10‑year Treasury near 4.2% at end‑2024, benchmark rates materially raise its funding cost. Wider corporate credit spreads in 2024 increased borrowing margins, while lenders commonly impose covenants and financing structures that constrain leverage. These dynamics directly affect transaction feasibility and expected returns for CareTrust.
Regulatory and zoning gatekeepers
Regulatory and zoning gatekeepers (licensing, CON regimes and local zoning boards) tightly control new long-term care supply; as of 2024, about 35 states maintain some form of Certificate of Need that limits facility additions, concentrating entitlement power. Approvals can be slow and uncertain, raising development risk and costs and often extending timelines by months to years. Municipalities frequently extract concessions or impact fees, and when entitlements are scarce this elevates supplier bargaining leverage over operators and REITs like CareTrust (CTRE).
Construction and labor inputs
Operator selection dependency
Sellers often bundle assets with incumbent operators or mandate transition support at acquisition, constraining buyer flexibility. Limited availability of strong regional operators concentrates choice amid roughly 15,000 US nursing homes (CMS, 2024), which can shift negotiation leverage toward sellers. Buyers may need to offer deal-level incentives or premiums to secure operator alignment and smooth transitions.
- Bundling/transition mandates
- ~15,000 US nursing homes (CMS 2024)
- Operator scarcity raises seller leverage
- Incentives/premiums often required
Tight SNF supply and higher capital costs bolster seller pricing power, compressing yields
Finite high-quality SNF and senior housing supply sustained seller pricing power in 2024, driving competitive bidding and tighter acquisition yields. Capital costs rose with Fed funds at 5.25–5.50% and the 10‑yr Treasury ~4.2%, widening lending margins and covenant constraints. Regulatory limits (≈35 states with CON) and operator scarcity across ~15,000 nursing homes increased supplier leverage and deal premiums.
| Metric | 2024 |
|---|---|
| Fed funds | 5.25–5.50% |
| 10‑yr Treasury | ~4.2% |
| States w/ CON | ≈35 |
| US nursing homes | ≈15,000 |
| Unemployment | ≈4.0% |
What is included in the product
Detailed Word Document
Tailored Porter's Five Forces analysis for CareTrust that uncovers competitive drivers, buyer and supplier power, entry barriers, substitutes, and emerging threats to its REIT healthcare portfolio, with strategic implications for pricing, profitability, and market positioning.
Customizable Excel Spreadsheet
CareTrust Porter's Five Forces delivers a clean one-sheet summary and interactive spider chart to instantly visualize competitive pressure, customizable for changing market data—perfect for quick decision-making and ready to drop into pitch decks or dashboards.
Customers Bargaining Power
Concentrated tenant base risk
Concentrated tenant base—regional operators provide a meaningful share of CareTrust’s rent, giving them leverage at lease rollover or in distress; as of 2024 the top 10 tenants account for about 34% of rental income. In downturns rent deferrals or restructurings have occurred, pressuring cash flow and covenants. Credit concentration heightens customer bargaining power, though portfolio diversification through acquisitions reduces this risk over time.
Alternative capital options
Operators can access at least 4 distinct capital sources—bank financing, HUD loans, bridge lenders, and sale-leasebacks—which raises tenant leverage over rent and covenant terms. Greater lender competition means competitive term sheets pressure pricing, often compressing spreads by roughly 50–150 basis points in deal markets. Deep operator-landlord relationships can reduce switching, preserving rent and covenant stability.
Triple-net structure limits exposure
Triple-net structure (typically 10–20 year leases) shifts capex and operating costs to tenants, reducing landlord friction and volatility; fixed escalators commonly run 2–3% annually and master leases limit renegotiation windows. When operator EBITDA margins compress to low single digits (seen across skilled-nursing in 2023–2024), tenants press for relief, but tenant credit profiles ultimately anchor bargaining leverage.
Switching and relocation frictions
Operators face substantial costs and regulatory hurdles to move licenses or beds; in 2024 the US had about 15,600 nursing homes and roughly 1.7 million licensed beds (CMS), making relocations complex. Patient continuity and staff retention deter moves, reducing tenant leverage mid-lease, while tenant bargaining power increases as leases near expiry.
Information and performance transparency
Landlords closely monitor coverage ratios, census, and payer mix; industry senior housing occupancy averaged about 80% in 2024, reducing information asymmetry and strengthening landlord negotiating position. Better, timely data (monthly census, payer breakdown, DSCR) tightens leverage; weak reporting raises tenant bargaining power. Financial covenants tied to these metrics (for example DSCR >1.2) can rebalance power.
- Metrics tracked: coverage ratios, census, payer mix
- 2024 industry occupancy ~80% — improves landlord visibility
- Covenants (DSCR >1.2) shift leverage toward landlords
Tenant concentration 34%, occupancy 80%, lease leverage
CareTrust tenant concentration (top10 ≈34% of rent in 2024) and access to multiple capital sources give operators meaningful leverage at renewal or distress; triple-net long leases and high relocation complexity (15,600 facilities, 1.7M beds in 2024) limit mid-lease bargaining but power rises near expiry. Occupancy ~80% (2024) and covenants (DSCR >1.2) shift leverage toward landlords when reported.
| Metric | 2024 |
|---|---|
| Top10 rent share | ≈34% |
| US facilities / beds | 15,600 / 1.7M |
| Occupancy | ≈80% |
| Escalators | 2–3% |
| Key covenant | DSCR >1.2 |
Full Version Awaits
CareTrust Porter's Five Forces Analysis
This preview shows the exact CareTrust Porter's Five Forces Analysis you'll receive after purchase—no placeholders or mockups. The file is fully formatted, professionally written, and includes the complete, final assessment. You'll have immediate access to this identical document for download and use.
Description
Don't Miss the Bigger Picture
CareTrust faces moderate buyer power, concentrated operator clients, evolving reimbursement pressures, and steady threat from new REIT entrants amid specialized healthcare demand; supplier leverage is contained but regulatory shifts raise risk. This snapshot highlights key competitive tensions and strategic implications. Unlock the full Porter's Five Forces Analysis to explore force-by-force ratings, visuals, and actionable insights tailored to CareTrust.
Suppliers Bargaining Power
Constrained pipeline of quality assets
High-quality skilled nursing and senior housing assets are finite, so sellers and developers retained pricing leverage in 2024; portfolios with strong operating partners routinely drew multiple bidders, driving competition for accretive deals and pressuring acquisition yields while tightening underwriting spreads.
Capital providers influence cost
Debt and equity markets are key suppliers of capital to CareTrust; with the US federal funds target at 5.25–5.50% and the 10‑year Treasury near 4.2% at end‑2024, benchmark rates materially raise its funding cost. Wider corporate credit spreads in 2024 increased borrowing margins, while lenders commonly impose covenants and financing structures that constrain leverage. These dynamics directly affect transaction feasibility and expected returns for CareTrust.
Regulatory and zoning gatekeepers
Regulatory and zoning gatekeepers (licensing, CON regimes and local zoning boards) tightly control new long-term care supply; as of 2024, about 35 states maintain some form of Certificate of Need that limits facility additions, concentrating entitlement power. Approvals can be slow and uncertain, raising development risk and costs and often extending timelines by months to years. Municipalities frequently extract concessions or impact fees, and when entitlements are scarce this elevates supplier bargaining leverage over operators and REITs like CareTrust (CTRE).
Construction and labor inputs
Operator selection dependency
Sellers often bundle assets with incumbent operators or mandate transition support at acquisition, constraining buyer flexibility. Limited availability of strong regional operators concentrates choice amid roughly 15,000 US nursing homes (CMS, 2024), which can shift negotiation leverage toward sellers. Buyers may need to offer deal-level incentives or premiums to secure operator alignment and smooth transitions.
- Bundling/transition mandates
- ~15,000 US nursing homes (CMS 2024)
- Operator scarcity raises seller leverage
- Incentives/premiums often required
Tight SNF supply and higher capital costs bolster seller pricing power, compressing yields
Finite high-quality SNF and senior housing supply sustained seller pricing power in 2024, driving competitive bidding and tighter acquisition yields. Capital costs rose with Fed funds at 5.25–5.50% and the 10‑yr Treasury ~4.2%, widening lending margins and covenant constraints. Regulatory limits (≈35 states with CON) and operator scarcity across ~15,000 nursing homes increased supplier leverage and deal premiums.
| Metric | 2024 |
|---|---|
| Fed funds | 5.25–5.50% |
| 10‑yr Treasury | ~4.2% |
| States w/ CON | ≈35 |
| US nursing homes | ≈15,000 |
| Unemployment | ≈4.0% |
What is included in the product
Detailed Word Document
Tailored Porter's Five Forces analysis for CareTrust that uncovers competitive drivers, buyer and supplier power, entry barriers, substitutes, and emerging threats to its REIT healthcare portfolio, with strategic implications for pricing, profitability, and market positioning.
Customizable Excel Spreadsheet
CareTrust Porter's Five Forces delivers a clean one-sheet summary and interactive spider chart to instantly visualize competitive pressure, customizable for changing market data—perfect for quick decision-making and ready to drop into pitch decks or dashboards.
Customers Bargaining Power
Concentrated tenant base risk
Concentrated tenant base—regional operators provide a meaningful share of CareTrust’s rent, giving them leverage at lease rollover or in distress; as of 2024 the top 10 tenants account for about 34% of rental income. In downturns rent deferrals or restructurings have occurred, pressuring cash flow and covenants. Credit concentration heightens customer bargaining power, though portfolio diversification through acquisitions reduces this risk over time.
Alternative capital options
Operators can access at least 4 distinct capital sources—bank financing, HUD loans, bridge lenders, and sale-leasebacks—which raises tenant leverage over rent and covenant terms. Greater lender competition means competitive term sheets pressure pricing, often compressing spreads by roughly 50–150 basis points in deal markets. Deep operator-landlord relationships can reduce switching, preserving rent and covenant stability.
Triple-net structure limits exposure
Triple-net structure (typically 10–20 year leases) shifts capex and operating costs to tenants, reducing landlord friction and volatility; fixed escalators commonly run 2–3% annually and master leases limit renegotiation windows. When operator EBITDA margins compress to low single digits (seen across skilled-nursing in 2023–2024), tenants press for relief, but tenant credit profiles ultimately anchor bargaining leverage.
Switching and relocation frictions
Operators face substantial costs and regulatory hurdles to move licenses or beds; in 2024 the US had about 15,600 nursing homes and roughly 1.7 million licensed beds (CMS), making relocations complex. Patient continuity and staff retention deter moves, reducing tenant leverage mid-lease, while tenant bargaining power increases as leases near expiry.
Information and performance transparency
Landlords closely monitor coverage ratios, census, and payer mix; industry senior housing occupancy averaged about 80% in 2024, reducing information asymmetry and strengthening landlord negotiating position. Better, timely data (monthly census, payer breakdown, DSCR) tightens leverage; weak reporting raises tenant bargaining power. Financial covenants tied to these metrics (for example DSCR >1.2) can rebalance power.
- Metrics tracked: coverage ratios, census, payer mix
- 2024 industry occupancy ~80% — improves landlord visibility
- Covenants (DSCR >1.2) shift leverage toward landlords
Tenant concentration 34%, occupancy 80%, lease leverage
CareTrust tenant concentration (top10 ≈34% of rent in 2024) and access to multiple capital sources give operators meaningful leverage at renewal or distress; triple-net long leases and high relocation complexity (15,600 facilities, 1.7M beds in 2024) limit mid-lease bargaining but power rises near expiry. Occupancy ~80% (2024) and covenants (DSCR >1.2) shift leverage toward landlords when reported.
| Metric | 2024 |
|---|---|
| Top10 rent share | ≈34% |
| US facilities / beds | 15,600 / 1.7M |
| Occupancy | ≈80% |
| Escalators | 2–3% |
| Key covenant | DSCR >1.2 |
Full Version Awaits
CareTrust Porter's Five Forces Analysis
This preview shows the exact CareTrust Porter's Five Forces Analysis you'll receive after purchase—no placeholders or mockups. The file is fully formatted, professionally written, and includes the complete, final assessment. You'll have immediate access to this identical document for download and use.











