Cargotec Porter's Five Forces Analysis

Don't Miss the Bigger Picture
Cargotec faces intense competitive pressure from global equipment makers, tight buyer negotiations, and concentrated suppliers impacting margins. Substitutes and regulatory shifts raise strategic risk while capital intensity deters new entrants. This snapshot scratches the surface—unlock the full Porter's Five Forces Analysis for force-by-force ratings, visuals, and actionable strategy recommendations.
Suppliers Bargaining Power

Concentrated critical components
Cargotec depends on specialized suppliers for hydraulics, powertrains, electronic controls and steel fabrications, and many niches have fewer than 10 globally qualified vendors, increasing supplier leverage. Qualification and safety standards typically require 6–12 month approval cycles, limiting rapid dual-sourcing. This concentration has pushed lead times to 24+ weeks in recent market cycles and supported pricing uplifts.
Technological specificity
Key modules (battery systems, automation stacks, sensors) are deeply integrated into Kalmar, Hiab and MacGregor platforms, so swapping components often triggers re-certification cycles that commonly add 6–12 months and materially raise implementation costs. This technical lock-in raises switching costs and gives suppliers with proprietary tech leverage to command price premiums often in the 10–25% range. Suppliers therefore exert significant bargaining power over Cargotec’s unit economics and upgrade timelines.

Capacity and lead-time risks
Large welded structures and bespoke booms demand long-cycle capacity, with fabrication lead-times often reaching 20–26 weeks in 2024. Tightness in steel, semiconductors and batteries during 2024 further stretched supply; expediting efforts added an estimated 5–8% to component costs and caused missed delivery windows that erode margins. Suppliers increasingly prioritize higher-margin customers, intensifying Cargotecsourcing risk.

Geopolitical and logistics exposure
Geopolitical tensions and trade-policy shifts in 2024 continue to tighten inbound flows for Cargotec, with marine and port equipment dependent on cross-border subassemblies and long supplier lead times. Sanctions and export controls on advanced semiconductors and dual-use components restrict sourcing of critical parts. Suppliers have leveraged scarcity by revising payment, lead-time and MOQ terms, raising procurement risk and cost volatility.
- 2024: sanctions and export controls constrain advanced components
- High dependence on cross-border subassemblies
- Suppliers revise terms to exploit scarcity
Sustainability and compliance requirements
EU Green Deal and CSRD-driven rules (affecting about 50,000 firms from 2024) plus OEM ESG targets force stricter material specs and full traceability; approved sustainable suppliers are correspondingly fewer, increasing Cargotecs dependence. Heightened compliance audits shrink supplier-pool flexibility and shift pricing and lead-time power to compliant suppliers.
- Regulatory-pressure: CSRD ~50,000 (2024)
- Supplier-concentration: fewer approved vendors
- Audit-impact: reduced flexibility, higher negotiation leverage
High supplier concentration (under 10 vendors), 20–26 weeks lead-times, 5–25% cost pressure
Supplier concentration (<10 qualified vendors for key modules) and technical lock-in raise switching costs. Lead-times 20–26 weeks in 2024 and semiconductor/battery tightness added ~5–8% to component costs. Proprietary suppliers command 10–25% premiums; CSRD (affecting ~50,000 firms in 2024) narrows approved supplier pool.
| Metric | 2024 |
|---|---|
| Vendor concentration | <10 |
| Lead-times | 20–26 weeks |
| Cost uplift | 5–8% |
| Supplier premium | 10–25% |
| CSRD scope | ~50,000 firms |
What is included in the product
 Detailed Word Document
Tailored Porter's Five Forces analysis for Cargotec that uncovers competitive drivers, buyer and supplier power, entry barriers, substitutes and disruptive threats, evaluating how each force shapes pricing, profitability and strategic positioning in the cargo-handling equipment and services market.

 Customizable Excel Spreadsheet
A concise, one-sheet Porter's Five Forces analysis for Cargotec that quickly highlights competitive pressures and relieves strategic uncertainty, with customizable force levels and an instant radar visualization ready for decks or boardroom decisions.
Customers Bargaining Power

Large professional buyers
Ports, terminal operators, logistics giants, municipalities and shipyards buy via global tenders, with global container throughput exceeding 800 million TEU in 2023–24, concentrating buying power among major operators. These customers are price-savvy and benchmark offers across brands, using multi-year volume contracts to extract better pricing and service levels. Large contracts enable demands for customization and extended service concessions.
High switching but multi-sourcing
Installed base and operator training create material switching frictions for Cargotec, slowing full fleet replacements and preserving aftersales revenue. Yet in 2024 buyers frequently multi-source across OEMs to hedge supply and financing risk, forcing discipline on Cargotec pricing. Robust references and lifecycle cost comparisons remain primary selection criteria, with total cost of ownership and uptime metrics guiding procurement decisions.

Total cost of ownership focus
Buyers base procurement on total cost of ownership: ports demand 98–99% uptime SLAs, with energy often 20–30% of TCO and maintenance a key driver. Customers insist on performance guarantees and uptime SLAs; transparent telematics (adoption >50% by 2024) strengthens claims. Predictive maintenance can cut unplanned downtime ~25%, and 10–15% discounts on long-term service agreements often clinch deals.

Cyclical and project-based demand
Standardization and interoperability
Open interfaces and standardized specs erode product differentiation, forcing buyers to prioritize compatibility with yard systems and mixed fleets; a 2024 industry survey found about 68% of port operators list interoperability as a top procurement criterion, intensifying price competition and pushing back on custom integration fees.
Port buyers seize pricing leverage with 98–99% SLAs, >50% telematics, 68% open interfaces
Buyers concentrated in major ports/terminals (global container throughput >800m TEU in 2023–24) exert strong price and service pressure via multi-year volume contracts and multi-sourcing. 98–99% uptime SLAs, >50% telematics adoption (2024) and TCO focus give customers leverage; cyclical capex and interoperability (68% demand open interfaces) further strengthen bargaining power.
| Metric | 2024 |
|---|---|
| Throughput (TEU) | >800m |
Preview the Actual Deliverable
Cargotec Porter's Five Forces Analysis
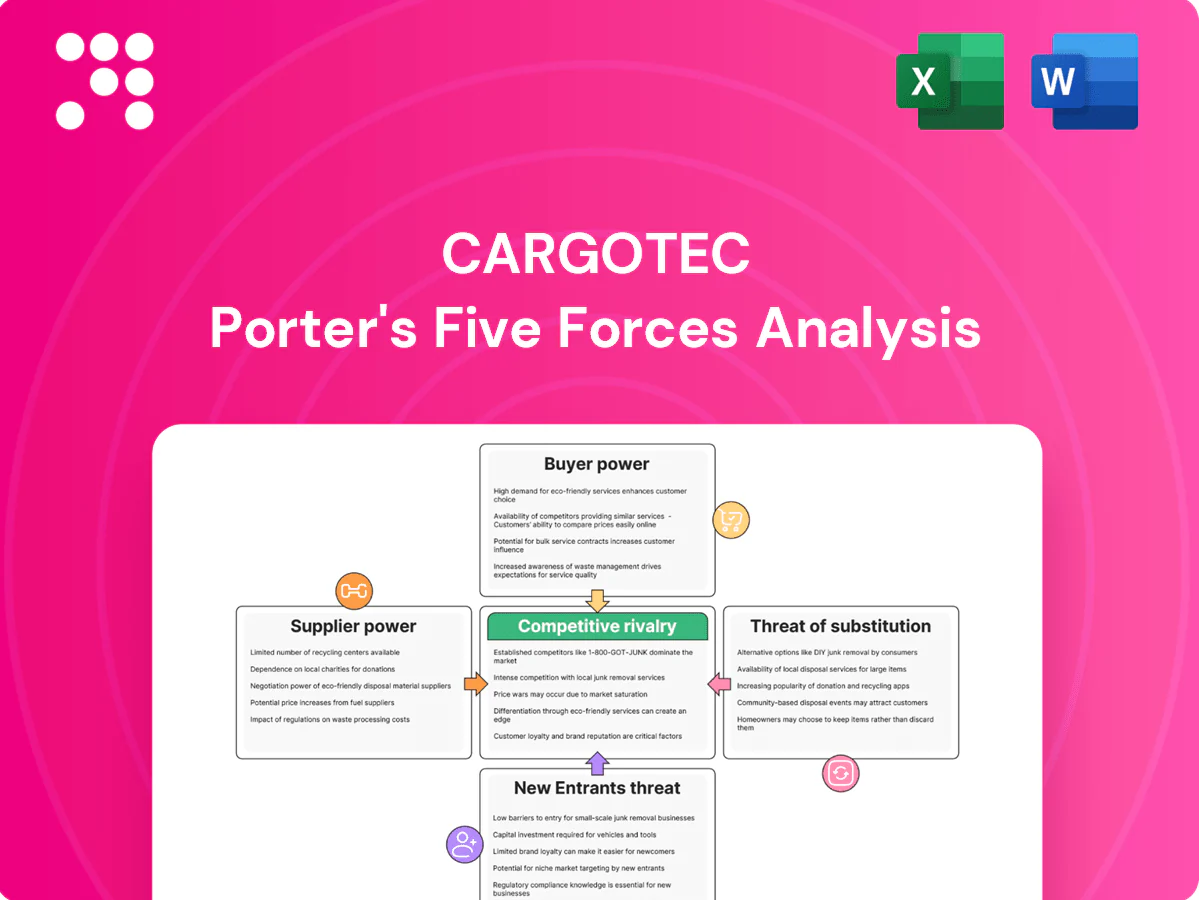
This preview shows the exact Cargotec Porter's Five Forces Analysis you'll receive immediately after purchase—no placeholders or edits. The analysis covers threat of new entrants, bargaining power of suppliers and buyers, substitutes, and competitive rivalry. It's fully formatted, professionally written, and ready for immediate download and use.

Don't Miss the Bigger Picture
Cargotec faces intense competitive pressure from global equipment makers, tight buyer negotiations, and concentrated suppliers impacting margins. Substitutes and regulatory shifts raise strategic risk while capital intensity deters new entrants. This snapshot scratches the surface—unlock the full Porter's Five Forces Analysis for force-by-force ratings, visuals, and actionable strategy recommendations.
Suppliers Bargaining Power
Concentrated critical components
Cargotec depends on specialized suppliers for hydraulics, powertrains, electronic controls and steel fabrications, and many niches have fewer than 10 globally qualified vendors, increasing supplier leverage. Qualification and safety standards typically require 6–12 month approval cycles, limiting rapid dual-sourcing. This concentration has pushed lead times to 24+ weeks in recent market cycles and supported pricing uplifts.
Technological specificity
Key modules (battery systems, automation stacks, sensors) are deeply integrated into Kalmar, Hiab and MacGregor platforms, so swapping components often triggers re-certification cycles that commonly add 6–12 months and materially raise implementation costs. This technical lock-in raises switching costs and gives suppliers with proprietary tech leverage to command price premiums often in the 10–25% range. Suppliers therefore exert significant bargaining power over Cargotec’s unit economics and upgrade timelines.
Capacity and lead-time risks
Large welded structures and bespoke booms demand long-cycle capacity, with fabrication lead-times often reaching 20–26 weeks in 2024. Tightness in steel, semiconductors and batteries during 2024 further stretched supply; expediting efforts added an estimated 5–8% to component costs and caused missed delivery windows that erode margins. Suppliers increasingly prioritize higher-margin customers, intensifying Cargotecsourcing risk.
Geopolitical and logistics exposure
Geopolitical tensions and trade-policy shifts in 2024 continue to tighten inbound flows for Cargotec, with marine and port equipment dependent on cross-border subassemblies and long supplier lead times. Sanctions and export controls on advanced semiconductors and dual-use components restrict sourcing of critical parts. Suppliers have leveraged scarcity by revising payment, lead-time and MOQ terms, raising procurement risk and cost volatility.
- 2024: sanctions and export controls constrain advanced components
- High dependence on cross-border subassemblies
- Suppliers revise terms to exploit scarcity
Sustainability and compliance requirements
EU Green Deal and CSRD-driven rules (affecting about 50,000 firms from 2024) plus OEM ESG targets force stricter material specs and full traceability; approved sustainable suppliers are correspondingly fewer, increasing Cargotecs dependence. Heightened compliance audits shrink supplier-pool flexibility and shift pricing and lead-time power to compliant suppliers.
- Regulatory-pressure: CSRD ~50,000 (2024)
- Supplier-concentration: fewer approved vendors
- Audit-impact: reduced flexibility, higher negotiation leverage
High supplier concentration (under 10 vendors), 20–26 weeks lead-times, 5–25% cost pressure
Supplier concentration (<10 qualified vendors for key modules) and technical lock-in raise switching costs. Lead-times 20–26 weeks in 2024 and semiconductor/battery tightness added ~5–8% to component costs. Proprietary suppliers command 10–25% premiums; CSRD (affecting ~50,000 firms in 2024) narrows approved supplier pool.
| Metric | 2024 |
|---|---|
| Vendor concentration | <10 |
| Lead-times | 20–26 weeks |
| Cost uplift | 5–8% |
| Supplier premium | 10–25% |
| CSRD scope | ~50,000 firms |
What is included in the product
Detailed Word Document
Tailored Porter's Five Forces analysis for Cargotec that uncovers competitive drivers, buyer and supplier power, entry barriers, substitutes and disruptive threats, evaluating how each force shapes pricing, profitability and strategic positioning in the cargo-handling equipment and services market.
Customizable Excel Spreadsheet
A concise, one-sheet Porter's Five Forces analysis for Cargotec that quickly highlights competitive pressures and relieves strategic uncertainty, with customizable force levels and an instant radar visualization ready for decks or boardroom decisions.
Customers Bargaining Power
Large professional buyers
Ports, terminal operators, logistics giants, municipalities and shipyards buy via global tenders, with global container throughput exceeding 800 million TEU in 2023–24, concentrating buying power among major operators. These customers are price-savvy and benchmark offers across brands, using multi-year volume contracts to extract better pricing and service levels. Large contracts enable demands for customization and extended service concessions.
High switching but multi-sourcing
Installed base and operator training create material switching frictions for Cargotec, slowing full fleet replacements and preserving aftersales revenue. Yet in 2024 buyers frequently multi-source across OEMs to hedge supply and financing risk, forcing discipline on Cargotec pricing. Robust references and lifecycle cost comparisons remain primary selection criteria, with total cost of ownership and uptime metrics guiding procurement decisions.
Total cost of ownership focus
Buyers base procurement on total cost of ownership: ports demand 98–99% uptime SLAs, with energy often 20–30% of TCO and maintenance a key driver. Customers insist on performance guarantees and uptime SLAs; transparent telematics (adoption >50% by 2024) strengthens claims. Predictive maintenance can cut unplanned downtime ~25%, and 10–15% discounts on long-term service agreements often clinch deals.
Cyclical and project-based demand
Standardization and interoperability
Open interfaces and standardized specs erode product differentiation, forcing buyers to prioritize compatibility with yard systems and mixed fleets; a 2024 industry survey found about 68% of port operators list interoperability as a top procurement criterion, intensifying price competition and pushing back on custom integration fees.
Port buyers seize pricing leverage with 98–99% SLAs, >50% telematics, 68% open interfaces
Buyers concentrated in major ports/terminals (global container throughput >800m TEU in 2023–24) exert strong price and service pressure via multi-year volume contracts and multi-sourcing. 98–99% uptime SLAs, >50% telematics adoption (2024) and TCO focus give customers leverage; cyclical capex and interoperability (68% demand open interfaces) further strengthen bargaining power.
| Metric | 2024 |
|---|---|
| Throughput (TEU) | >800m |
Preview the Actual Deliverable
Cargotec Porter's Five Forces Analysis
This preview shows the exact Cargotec Porter's Five Forces Analysis you'll receive immediately after purchase—no placeholders or edits. The analysis covers threat of new entrants, bargaining power of suppliers and buyers, substitutes, and competitive rivalry. It's fully formatted, professionally written, and ready for immediate download and use.
Description
Don't Miss the Bigger Picture
Cargotec faces intense competitive pressure from global equipment makers, tight buyer negotiations, and concentrated suppliers impacting margins. Substitutes and regulatory shifts raise strategic risk while capital intensity deters new entrants. This snapshot scratches the surface—unlock the full Porter's Five Forces Analysis for force-by-force ratings, visuals, and actionable strategy recommendations.
Suppliers Bargaining Power
Concentrated critical components
Cargotec depends on specialized suppliers for hydraulics, powertrains, electronic controls and steel fabrications, and many niches have fewer than 10 globally qualified vendors, increasing supplier leverage. Qualification and safety standards typically require 6–12 month approval cycles, limiting rapid dual-sourcing. This concentration has pushed lead times to 24+ weeks in recent market cycles and supported pricing uplifts.
Technological specificity
Key modules (battery systems, automation stacks, sensors) are deeply integrated into Kalmar, Hiab and MacGregor platforms, so swapping components often triggers re-certification cycles that commonly add 6–12 months and materially raise implementation costs. This technical lock-in raises switching costs and gives suppliers with proprietary tech leverage to command price premiums often in the 10–25% range. Suppliers therefore exert significant bargaining power over Cargotec’s unit economics and upgrade timelines.
Capacity and lead-time risks
Large welded structures and bespoke booms demand long-cycle capacity, with fabrication lead-times often reaching 20–26 weeks in 2024. Tightness in steel, semiconductors and batteries during 2024 further stretched supply; expediting efforts added an estimated 5–8% to component costs and caused missed delivery windows that erode margins. Suppliers increasingly prioritize higher-margin customers, intensifying Cargotecsourcing risk.
Geopolitical and logistics exposure
Geopolitical tensions and trade-policy shifts in 2024 continue to tighten inbound flows for Cargotec, with marine and port equipment dependent on cross-border subassemblies and long supplier lead times. Sanctions and export controls on advanced semiconductors and dual-use components restrict sourcing of critical parts. Suppliers have leveraged scarcity by revising payment, lead-time and MOQ terms, raising procurement risk and cost volatility.
- 2024: sanctions and export controls constrain advanced components
- High dependence on cross-border subassemblies
- Suppliers revise terms to exploit scarcity
Sustainability and compliance requirements
EU Green Deal and CSRD-driven rules (affecting about 50,000 firms from 2024) plus OEM ESG targets force stricter material specs and full traceability; approved sustainable suppliers are correspondingly fewer, increasing Cargotecs dependence. Heightened compliance audits shrink supplier-pool flexibility and shift pricing and lead-time power to compliant suppliers.
- Regulatory-pressure: CSRD ~50,000 (2024)
- Supplier-concentration: fewer approved vendors
- Audit-impact: reduced flexibility, higher negotiation leverage
High supplier concentration (under 10 vendors), 20–26 weeks lead-times, 5–25% cost pressure
Supplier concentration (<10 qualified vendors for key modules) and technical lock-in raise switching costs. Lead-times 20–26 weeks in 2024 and semiconductor/battery tightness added ~5–8% to component costs. Proprietary suppliers command 10–25% premiums; CSRD (affecting ~50,000 firms in 2024) narrows approved supplier pool.
| Metric | 2024 |
|---|---|
| Vendor concentration | <10 |
| Lead-times | 20–26 weeks |
| Cost uplift | 5–8% |
| Supplier premium | 10–25% |
| CSRD scope | ~50,000 firms |
What is included in the product
Detailed Word Document
Tailored Porter's Five Forces analysis for Cargotec that uncovers competitive drivers, buyer and supplier power, entry barriers, substitutes and disruptive threats, evaluating how each force shapes pricing, profitability and strategic positioning in the cargo-handling equipment and services market.
Customizable Excel Spreadsheet
A concise, one-sheet Porter's Five Forces analysis for Cargotec that quickly highlights competitive pressures and relieves strategic uncertainty, with customizable force levels and an instant radar visualization ready for decks or boardroom decisions.
Customers Bargaining Power
Large professional buyers
Ports, terminal operators, logistics giants, municipalities and shipyards buy via global tenders, with global container throughput exceeding 800 million TEU in 2023–24, concentrating buying power among major operators. These customers are price-savvy and benchmark offers across brands, using multi-year volume contracts to extract better pricing and service levels. Large contracts enable demands for customization and extended service concessions.
High switching but multi-sourcing
Installed base and operator training create material switching frictions for Cargotec, slowing full fleet replacements and preserving aftersales revenue. Yet in 2024 buyers frequently multi-source across OEMs to hedge supply and financing risk, forcing discipline on Cargotec pricing. Robust references and lifecycle cost comparisons remain primary selection criteria, with total cost of ownership and uptime metrics guiding procurement decisions.
Total cost of ownership focus
Buyers base procurement on total cost of ownership: ports demand 98–99% uptime SLAs, with energy often 20–30% of TCO and maintenance a key driver. Customers insist on performance guarantees and uptime SLAs; transparent telematics (adoption >50% by 2024) strengthens claims. Predictive maintenance can cut unplanned downtime ~25%, and 10–15% discounts on long-term service agreements often clinch deals.
Cyclical and project-based demand
Standardization and interoperability
Open interfaces and standardized specs erode product differentiation, forcing buyers to prioritize compatibility with yard systems and mixed fleets; a 2024 industry survey found about 68% of port operators list interoperability as a top procurement criterion, intensifying price competition and pushing back on custom integration fees.
Port buyers seize pricing leverage with 98–99% SLAs, >50% telematics, 68% open interfaces
Buyers concentrated in major ports/terminals (global container throughput >800m TEU in 2023–24) exert strong price and service pressure via multi-year volume contracts and multi-sourcing. 98–99% uptime SLAs, >50% telematics adoption (2024) and TCO focus give customers leverage; cyclical capex and interoperability (68% demand open interfaces) further strengthen bargaining power.
| Metric | 2024 |
|---|---|
| Throughput (TEU) | >800m |
Preview the Actual Deliverable
Cargotec Porter's Five Forces Analysis
This preview shows the exact Cargotec Porter's Five Forces Analysis you'll receive immediately after purchase—no placeholders or edits. The analysis covers threat of new entrants, bargaining power of suppliers and buyers, substitutes, and competitive rivalry. It's fully formatted, professionally written, and ready for immediate download and use.











