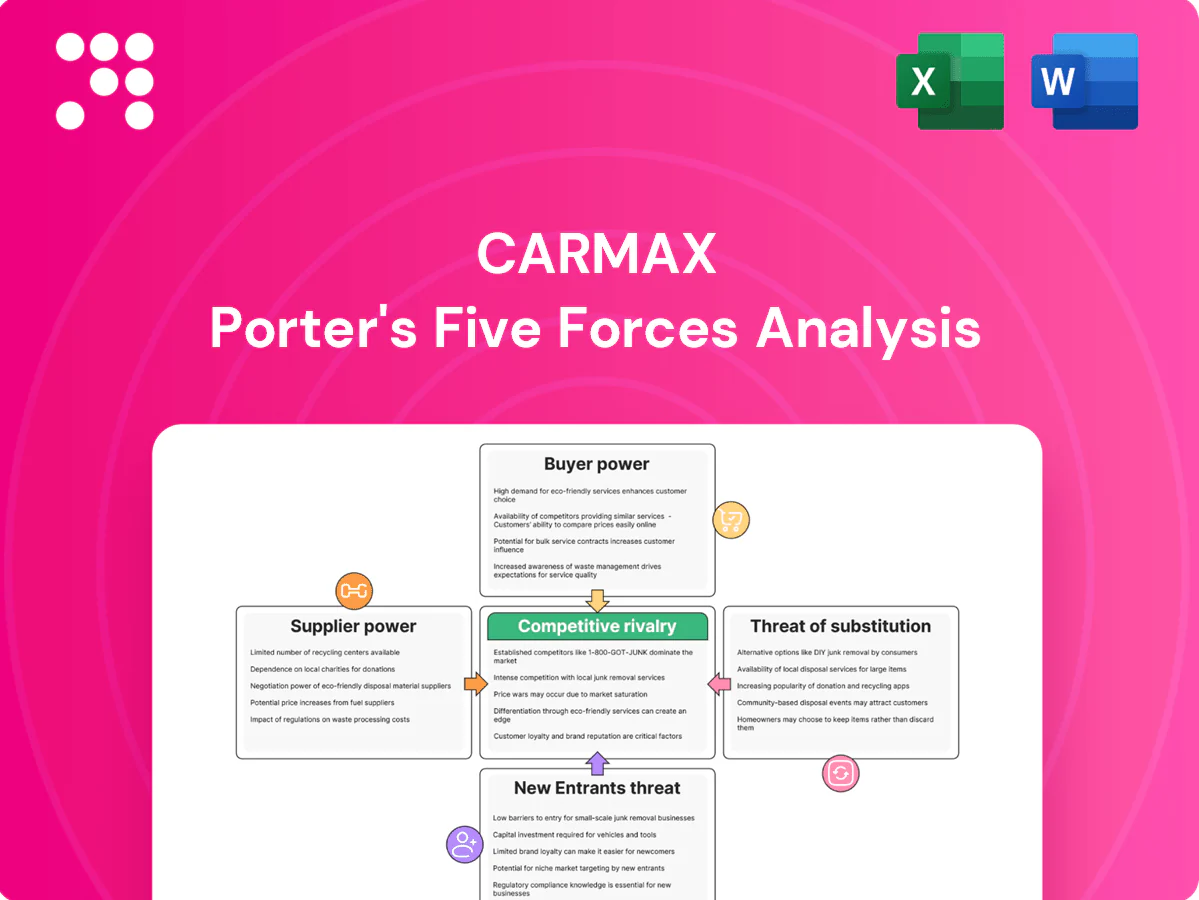
CarMax Porter's Five Forces Analysis

From Overview to Strategy Blueprint
CarMax faces intense buyer power, evolving digital competition, and moderate supplier leverage, while scale and brand shield it from many new entrants and substitutes; however, margin pressures persist. This brief snapshot only scratches the surface. Unlock the full Porter's Five Forces Analysis to explore CarMax’s competitive dynamics in detail.
Suppliers Bargaining Power

Fragmented vehicle sources
CarMax, the largest used-vehicle retailer in the US, sources inventory from numerous consumer trade-ins, auctions, off-lease and fleet channels and wholesalers, creating a highly fragmented supplier base that limits any single supplier's bargaining power.
Short-term shocks—for example, tighter off-lease volumes in 2022–23—can still compress supply and push up acquisition costs, raising wholesale prices in the near term.
Diversified sourcing across channels and markets, supported by a national footprint of about 238 stores in fiscal 2024, mitigates concentration risk and preserves pricing flexibility.
Auctions set floor prices
Wholesale auctions set clear market-clearing floors, and in tight markets these auction bids can compress CarMax’s gross margins; CarMax operated about 225 stores in FY2024, giving scale to source inventory. CarMax’s analytic bidding and large buying pools help maintain purchasing discipline, while in-house reconditioning and reconditioning throughput let CarMax selectively pay premiums when ROI is justified.

Dependence on reconditioning inputs
Parts, service equipment, and third-party vendors underpin CarMaxs reconditioning throughput, and 2024 saw supplier cost pressure as parts and labor inflation tightened margins. While supplier count is large, episodic bottlenecks can spike reconditioning cycle costs and holding times. Preferred-vendor programs and national contracts negotiated in 2024 improved pricing and lead times. In-house reconditioning expertise reduces switching costs and preserves throughput flexibility.

Data and tech vendors
Data, DMS and ad platforms underpin CarMax pricing, appraisal and marketing; CarMax reported FY2024 net sales of about $24.2 billion, increasing leverage to standardize vendor terms. Providers are not unique, but 6–12 month integration and data-migration costs create moderate stickiness; multi-vendor sourcing and proprietary analytics reduce dependency and negotiated enterprise agreements limit vendor pricing power.
- Pricing reliance: high
- Integration costs: moderate (6–12 months)
- Vendor uniqueness: low
- Mitigants: multi-vendor + proprietary analytics
- Negotiated deals: temper pricing power
Capital markets for CAF
CarMax Auto Finance funds receivables primarily through asset-backed securities and committed credit lines; stressed credit markets can push investor yield demands higher, raising CAF funding costs, while consistent credit performance and scale improve investor access and pricing.
- Funding: ABS and credit lines
- Risk: spreads widen in stress
- Mitigant: strong credit history and scale
- Flexibility: balance-sheet liquidity offsets cycles
National scale limits supplier power; off-lease shocks raise costs and ABS spread risk
CarMax’s supplier power is low due to highly fragmented trade-in/auction/off-lease sourcing and national scale (238 stores in FY2024, net sales $24.2B), but 2022–24 off-lease shocks and 2024 parts/labor inflation raised acquisition and reconditioning costs; auctions set market floors, analytic bidding and preferred-vendor deals preserve margins; CAF funding via ABS/credit lines faces spread risk in stressed markets.
| Metric | 2024 | Impact |
|---|---|---|
| Stores | 238 | Scale reduces supplier power |
| Net sales | $24.2B | Stronger vendor terms |
| Integration cost | 6–12 months | Moderate stickiness |
| Funding | ABS / credit lines | Spread risk in stress |
What is included in the product
 Detailed Word Document
Uncovers key drivers of competition, customer influence, and market entry risks tailored exclusively for CarMax, with a detailed look at supplier and buyer power, substitutes, and competitive rivalry. Identifies disruptive forces and emerging threats that affect pricing, profitability, and market share, suitable for investor, strategic, or academic use.

 Customizable Excel Spreadsheet
A one-sheet CarMax Five Forces summary with customizable pressure levels and an instant spider chart—clean, no-macro layout ready to drop into decks or Excel dashboards; swap in your data for fast, board-ready strategic decisions.
Customers Bargaining Power

High price transparency
High price transparency lets consumers compare listings instantly across platforms, elevating buyer bargaining power and compressing spreads; online research now informs roughly 80% of car purchases. CarMax’s no-haggle pricing shifts the decision to trust and convenience rather than price fights. Its data-driven pricing and ~239 store footprint in 2024 keep offers competitive despite full market visibility.
Low switching costs
Low switching costs let shoppers pivot to rival dealers, Carvana, or private sellers with minimal friction, intensifying pressure on CarMax to deliver superior service and value; the US sees roughly 40 million used-vehicle transactions annually (2024). CarMax counters with a nationwide inventory and transfer network plus a 7-day/250-mile return guarantee to reduce perceived risk and retain buyers.

Financing optionality
Customers bring outside financing and rate-shop online—average U.S. new/used auto loan rates rose to roughly 7% in 2024—limiting CAF’s pricing latitude and boosting buyer leverage. CAF competes on approval rates, same-day funding speed, and simplicity to retain capture. Bundled protection plans and transparent fee disclosure reinforce overall deal value and reduce defections to third-party lenders.

Condition and history sensitivity
Buyers are highly sensitive to vehicle condition, mileage and history reports, and any perceived quality gap can quickly shift demand away from a retailer. CarMax’s standardized reconditioning process and transparent vehicle history disclosures strengthen trust and reduce search friction. Rigorous inspections aim to lower post-sale dissatisfaction and returns, supporting repeat purchases and pricing power.
- Condition focus: drives buyer decisions
- Transparency: history reports reduce uncertainty
- Reconditioning: builds trust, lowers returns
Omnichannel expectations
Customers demand seamless online-to-store experiences, delivery, and self-serve tools; failure to meet UX standards drives churn. CarMax reported FY2024 net sales of 21.8 billion and has prioritized omnichannel investments to boost retention. Its integrated platform reduces friction, increases stickiness, and narrows effective buyer power.
- Omnichannel lowers friction
- Higher retention reduces churn
- Narrows buyer bargaining power
High buyer leverage: ~80% online research, 40M used sales
High price transparency and ~80% online research increase buyer leverage; CarMax FY2024 net sales 21.8B and 239 stores help offset pressure. Low switching costs amid ~40M annual used transactions keep bargaining power high; 7% avg auto loan rates in 2024 constrain financing margins. Omnichannel, 7-day return, and reconditioning reduce defections.
| Metric | 2024 |
|---|---|
| Net sales | 21.8B |
| Stores | 239 |
| Used transactions | 40M |
| Online research | ~80% |
| Avg loan rate | ~7% |
What You See Is What You Get
CarMax Porter's Five Forces Analysis
This preview shows the exact CarMax Porter's Five Forces Analysis you'll receive immediately after purchase—no surprises, no placeholders. The document is the complete, professionally formatted analysis, ready for download and immediate use. It covers threat of new entrants, supplier and buyer power, substitute threats, and competitive rivalry with actionable insights for investors and strategists.

From Overview to Strategy Blueprint
CarMax faces intense buyer power, evolving digital competition, and moderate supplier leverage, while scale and brand shield it from many new entrants and substitutes; however, margin pressures persist. This brief snapshot only scratches the surface. Unlock the full Porter's Five Forces Analysis to explore CarMax’s competitive dynamics in detail.
Suppliers Bargaining Power
Fragmented vehicle sources
CarMax, the largest used-vehicle retailer in the US, sources inventory from numerous consumer trade-ins, auctions, off-lease and fleet channels and wholesalers, creating a highly fragmented supplier base that limits any single supplier's bargaining power.
Short-term shocks—for example, tighter off-lease volumes in 2022–23—can still compress supply and push up acquisition costs, raising wholesale prices in the near term.
Diversified sourcing across channels and markets, supported by a national footprint of about 238 stores in fiscal 2024, mitigates concentration risk and preserves pricing flexibility.
Auctions set floor prices
Wholesale auctions set clear market-clearing floors, and in tight markets these auction bids can compress CarMax’s gross margins; CarMax operated about 225 stores in FY2024, giving scale to source inventory. CarMax’s analytic bidding and large buying pools help maintain purchasing discipline, while in-house reconditioning and reconditioning throughput let CarMax selectively pay premiums when ROI is justified.
Dependence on reconditioning inputs
Parts, service equipment, and third-party vendors underpin CarMaxs reconditioning throughput, and 2024 saw supplier cost pressure as parts and labor inflation tightened margins. While supplier count is large, episodic bottlenecks can spike reconditioning cycle costs and holding times. Preferred-vendor programs and national contracts negotiated in 2024 improved pricing and lead times. In-house reconditioning expertise reduces switching costs and preserves throughput flexibility.
Data and tech vendors
Data, DMS and ad platforms underpin CarMax pricing, appraisal and marketing; CarMax reported FY2024 net sales of about $24.2 billion, increasing leverage to standardize vendor terms. Providers are not unique, but 6–12 month integration and data-migration costs create moderate stickiness; multi-vendor sourcing and proprietary analytics reduce dependency and negotiated enterprise agreements limit vendor pricing power.
- Pricing reliance: high
- Integration costs: moderate (6–12 months)
- Vendor uniqueness: low
- Mitigants: multi-vendor + proprietary analytics
- Negotiated deals: temper pricing power
Capital markets for CAF
CarMax Auto Finance funds receivables primarily through asset-backed securities and committed credit lines; stressed credit markets can push investor yield demands higher, raising CAF funding costs, while consistent credit performance and scale improve investor access and pricing.
- Funding: ABS and credit lines
- Risk: spreads widen in stress
- Mitigant: strong credit history and scale
- Flexibility: balance-sheet liquidity offsets cycles
National scale limits supplier power; off-lease shocks raise costs and ABS spread risk
CarMax’s supplier power is low due to highly fragmented trade-in/auction/off-lease sourcing and national scale (238 stores in FY2024, net sales $24.2B), but 2022–24 off-lease shocks and 2024 parts/labor inflation raised acquisition and reconditioning costs; auctions set market floors, analytic bidding and preferred-vendor deals preserve margins; CAF funding via ABS/credit lines faces spread risk in stressed markets.
| Metric | 2024 | Impact |
|---|---|---|
| Stores | 238 | Scale reduces supplier power |
| Net sales | $24.2B | Stronger vendor terms |
| Integration cost | 6–12 months | Moderate stickiness |
| Funding | ABS / credit lines | Spread risk in stress |
What is included in the product
Detailed Word Document
Uncovers key drivers of competition, customer influence, and market entry risks tailored exclusively for CarMax, with a detailed look at supplier and buyer power, substitutes, and competitive rivalry. Identifies disruptive forces and emerging threats that affect pricing, profitability, and market share, suitable for investor, strategic, or academic use.
Customizable Excel Spreadsheet
A one-sheet CarMax Five Forces summary with customizable pressure levels and an instant spider chart—clean, no-macro layout ready to drop into decks or Excel dashboards; swap in your data for fast, board-ready strategic decisions.
Customers Bargaining Power
High price transparency
High price transparency lets consumers compare listings instantly across platforms, elevating buyer bargaining power and compressing spreads; online research now informs roughly 80% of car purchases. CarMax’s no-haggle pricing shifts the decision to trust and convenience rather than price fights. Its data-driven pricing and ~239 store footprint in 2024 keep offers competitive despite full market visibility.
Low switching costs
Low switching costs let shoppers pivot to rival dealers, Carvana, or private sellers with minimal friction, intensifying pressure on CarMax to deliver superior service and value; the US sees roughly 40 million used-vehicle transactions annually (2024). CarMax counters with a nationwide inventory and transfer network plus a 7-day/250-mile return guarantee to reduce perceived risk and retain buyers.
Financing optionality
Customers bring outside financing and rate-shop online—average U.S. new/used auto loan rates rose to roughly 7% in 2024—limiting CAF’s pricing latitude and boosting buyer leverage. CAF competes on approval rates, same-day funding speed, and simplicity to retain capture. Bundled protection plans and transparent fee disclosure reinforce overall deal value and reduce defections to third-party lenders.
Condition and history sensitivity
Buyers are highly sensitive to vehicle condition, mileage and history reports, and any perceived quality gap can quickly shift demand away from a retailer. CarMax’s standardized reconditioning process and transparent vehicle history disclosures strengthen trust and reduce search friction. Rigorous inspections aim to lower post-sale dissatisfaction and returns, supporting repeat purchases and pricing power.
- Condition focus: drives buyer decisions
- Transparency: history reports reduce uncertainty
- Reconditioning: builds trust, lowers returns
Omnichannel expectations
Customers demand seamless online-to-store experiences, delivery, and self-serve tools; failure to meet UX standards drives churn. CarMax reported FY2024 net sales of 21.8 billion and has prioritized omnichannel investments to boost retention. Its integrated platform reduces friction, increases stickiness, and narrows effective buyer power.
- Omnichannel lowers friction
- Higher retention reduces churn
- Narrows buyer bargaining power
High buyer leverage: ~80% online research, 40M used sales
High price transparency and ~80% online research increase buyer leverage; CarMax FY2024 net sales 21.8B and 239 stores help offset pressure. Low switching costs amid ~40M annual used transactions keep bargaining power high; 7% avg auto loan rates in 2024 constrain financing margins. Omnichannel, 7-day return, and reconditioning reduce defections.
| Metric | 2024 |
|---|---|
| Net sales | 21.8B |
| Stores | 239 |
| Used transactions | 40M |
| Online research | ~80% |
| Avg loan rate | ~7% |
What You See Is What You Get
CarMax Porter's Five Forces Analysis
This preview shows the exact CarMax Porter's Five Forces Analysis you'll receive immediately after purchase—no surprises, no placeholders. The document is the complete, professionally formatted analysis, ready for download and immediate use. It covers threat of new entrants, supplier and buyer power, substitute threats, and competitive rivalry with actionable insights for investors and strategists.
Original: $10.00
-65%$10.00
$3.50Description
From Overview to Strategy Blueprint
CarMax faces intense buyer power, evolving digital competition, and moderate supplier leverage, while scale and brand shield it from many new entrants and substitutes; however, margin pressures persist. This brief snapshot only scratches the surface. Unlock the full Porter's Five Forces Analysis to explore CarMax’s competitive dynamics in detail.
Suppliers Bargaining Power
Fragmented vehicle sources
CarMax, the largest used-vehicle retailer in the US, sources inventory from numerous consumer trade-ins, auctions, off-lease and fleet channels and wholesalers, creating a highly fragmented supplier base that limits any single supplier's bargaining power.
Short-term shocks—for example, tighter off-lease volumes in 2022–23—can still compress supply and push up acquisition costs, raising wholesale prices in the near term.
Diversified sourcing across channels and markets, supported by a national footprint of about 238 stores in fiscal 2024, mitigates concentration risk and preserves pricing flexibility.
Auctions set floor prices
Wholesale auctions set clear market-clearing floors, and in tight markets these auction bids can compress CarMax’s gross margins; CarMax operated about 225 stores in FY2024, giving scale to source inventory. CarMax’s analytic bidding and large buying pools help maintain purchasing discipline, while in-house reconditioning and reconditioning throughput let CarMax selectively pay premiums when ROI is justified.
Dependence on reconditioning inputs
Parts, service equipment, and third-party vendors underpin CarMaxs reconditioning throughput, and 2024 saw supplier cost pressure as parts and labor inflation tightened margins. While supplier count is large, episodic bottlenecks can spike reconditioning cycle costs and holding times. Preferred-vendor programs and national contracts negotiated in 2024 improved pricing and lead times. In-house reconditioning expertise reduces switching costs and preserves throughput flexibility.
Data and tech vendors
Data, DMS and ad platforms underpin CarMax pricing, appraisal and marketing; CarMax reported FY2024 net sales of about $24.2 billion, increasing leverage to standardize vendor terms. Providers are not unique, but 6–12 month integration and data-migration costs create moderate stickiness; multi-vendor sourcing and proprietary analytics reduce dependency and negotiated enterprise agreements limit vendor pricing power.
- Pricing reliance: high
- Integration costs: moderate (6–12 months)
- Vendor uniqueness: low
- Mitigants: multi-vendor + proprietary analytics
- Negotiated deals: temper pricing power
Capital markets for CAF
CarMax Auto Finance funds receivables primarily through asset-backed securities and committed credit lines; stressed credit markets can push investor yield demands higher, raising CAF funding costs, while consistent credit performance and scale improve investor access and pricing.
- Funding: ABS and credit lines
- Risk: spreads widen in stress
- Mitigant: strong credit history and scale
- Flexibility: balance-sheet liquidity offsets cycles
National scale limits supplier power; off-lease shocks raise costs and ABS spread risk
CarMax’s supplier power is low due to highly fragmented trade-in/auction/off-lease sourcing and national scale (238 stores in FY2024, net sales $24.2B), but 2022–24 off-lease shocks and 2024 parts/labor inflation raised acquisition and reconditioning costs; auctions set market floors, analytic bidding and preferred-vendor deals preserve margins; CAF funding via ABS/credit lines faces spread risk in stressed markets.
| Metric | 2024 | Impact |
|---|---|---|
| Stores | 238 | Scale reduces supplier power |
| Net sales | $24.2B | Stronger vendor terms |
| Integration cost | 6–12 months | Moderate stickiness |
| Funding | ABS / credit lines | Spread risk in stress |
What is included in the product
Detailed Word Document
Uncovers key drivers of competition, customer influence, and market entry risks tailored exclusively for CarMax, with a detailed look at supplier and buyer power, substitutes, and competitive rivalry. Identifies disruptive forces and emerging threats that affect pricing, profitability, and market share, suitable for investor, strategic, or academic use.
Customizable Excel Spreadsheet
A one-sheet CarMax Five Forces summary with customizable pressure levels and an instant spider chart—clean, no-macro layout ready to drop into decks or Excel dashboards; swap in your data for fast, board-ready strategic decisions.
Customers Bargaining Power
High price transparency
High price transparency lets consumers compare listings instantly across platforms, elevating buyer bargaining power and compressing spreads; online research now informs roughly 80% of car purchases. CarMax’s no-haggle pricing shifts the decision to trust and convenience rather than price fights. Its data-driven pricing and ~239 store footprint in 2024 keep offers competitive despite full market visibility.
Low switching costs
Low switching costs let shoppers pivot to rival dealers, Carvana, or private sellers with minimal friction, intensifying pressure on CarMax to deliver superior service and value; the US sees roughly 40 million used-vehicle transactions annually (2024). CarMax counters with a nationwide inventory and transfer network plus a 7-day/250-mile return guarantee to reduce perceived risk and retain buyers.
Financing optionality
Customers bring outside financing and rate-shop online—average U.S. new/used auto loan rates rose to roughly 7% in 2024—limiting CAF’s pricing latitude and boosting buyer leverage. CAF competes on approval rates, same-day funding speed, and simplicity to retain capture. Bundled protection plans and transparent fee disclosure reinforce overall deal value and reduce defections to third-party lenders.
Condition and history sensitivity
Buyers are highly sensitive to vehicle condition, mileage and history reports, and any perceived quality gap can quickly shift demand away from a retailer. CarMax’s standardized reconditioning process and transparent vehicle history disclosures strengthen trust and reduce search friction. Rigorous inspections aim to lower post-sale dissatisfaction and returns, supporting repeat purchases and pricing power.
- Condition focus: drives buyer decisions
- Transparency: history reports reduce uncertainty
- Reconditioning: builds trust, lowers returns
Omnichannel expectations
Customers demand seamless online-to-store experiences, delivery, and self-serve tools; failure to meet UX standards drives churn. CarMax reported FY2024 net sales of 21.8 billion and has prioritized omnichannel investments to boost retention. Its integrated platform reduces friction, increases stickiness, and narrows effective buyer power.
- Omnichannel lowers friction
- Higher retention reduces churn
- Narrows buyer bargaining power
High buyer leverage: ~80% online research, 40M used sales
High price transparency and ~80% online research increase buyer leverage; CarMax FY2024 net sales 21.8B and 239 stores help offset pressure. Low switching costs amid ~40M annual used transactions keep bargaining power high; 7% avg auto loan rates in 2024 constrain financing margins. Omnichannel, 7-day return, and reconditioning reduce defections.
| Metric | 2024 |
|---|---|
| Net sales | 21.8B |
| Stores | 239 |
| Used transactions | 40M |
| Online research | ~80% |
| Avg loan rate | ~7% |
What You See Is What You Get
CarMax Porter's Five Forces Analysis
This preview shows the exact CarMax Porter's Five Forces Analysis you'll receive immediately after purchase—no surprises, no placeholders. The document is the complete, professionally formatted analysis, ready for download and immediate use. It covers threat of new entrants, supplier and buyer power, substitute threats, and competitive rivalry with actionable insights for investors and strategists.











