Carriage Services PESTLE Analysis

Skip the Research. Get the Strategy.
Unlock strategic clarity with our PESTLE Analysis of Carriage Services — concise insights show how political, economic, social, technological, legal, and environmental forces shape its outlook. Ideal for investors and strategists, this report turns external risks into actionable recommendations. Purchase the full, editable analysis now to access deep-dive findings and ready-to-use tools.
Political factors

Local zoning and land-use control
Funeral homes and cemeteries routinely require city council and planning commission approvals for siting, expansion and traffic plans, with special-use permits often adding 3–12 months to project timelines. Political sentiment on land use can materially delay projects or constrain inventory; U.S. has roughly 19,500 incorporated places with widely varying rules. Proactive community engagement reduces opposition and speeds permitting, lowering execution risk across municipalities.
State funeral board oversight
State funeral boards in all 50 states set operational standards and often tighten rules after high‑profile incidents, forcing changes in embalming, refrigeration and crematory protocols. Policy shifts matter as the U.S. cremation rate reached about 60% in 2024 (NFDA), altering facility mix and throughput needs. Compliance capacity—across Carriage Services' ~300 funeral/crematory locations—becomes a competitive differentiator. Increased inspections raise operating costs and can limit daily throughput.

Public health preparedness mandates
Epidemic and disaster policies dictate handling protocols, PPE standards and surge capacity requirements for funeral operators, often requiring rapid scaling of services. Government coordination can prioritize medical capacity or restrict gatherings, directly affecting demand patterns. FEMA and similar programs commonly cover ~75% of eligible emergency protective costs, offsetting expenses but adding heavy documentation burdens; preparedness planning therefore shapes operational resilience and public reputation.

Veterans and indigent burial programs
Federal, state and county veterans and indigent burial programs shape demand mix and pricing for eligible families; VA burial benefits (maximum federal allowance about $2,000 for certain cases) and varied state supplements change revenue per service, with policy adjustments directly altering margins. Contracting with agencies requires strict procurement and documentation processes; political budget cycles and one-time appropriations cause noticeable volume volatility year-to-year.
- Programs: federal/state/county
- Federal VA allowance ≈ $2,000
- Contract compliance mandatory
- Budget cycles → volume swings
Community relations and local politics
Neighborhood sentiment heavily influences municipal approvals for crematories and memorial parks, especially as the US cremation rate reached about 58% in 2023 (NFDA), driving demand and local scrutiny; elected officials routinely respond to constituent concerns over emissions, traffic, and aesthetics, and civic partnerships (sponsorships, public meetings) can build goodwill and reduce friction, while missteps have triggered restrictive ordinances in multiple municipalities.
- Local approvals tied to rising cremation demand (58% in 2023)
- Elected officials react to emissions, traffic, aesthetic complaints
- Civic partnerships lower opposition; missteps prompt ordinances
Permits add 3-12 months; inspections and ≈60% cremation increase siting risk
Municipal land‑use approvals and special‑use permits (≈19,500 incorporated places) add 3–12 months and drive siting risk. State funeral boards (all 50 states) and rising inspections raise compliance costs across Carriage Services’ ≈300 locations. U.S. cremation rate ≈60% in 2024 shifts facility mix and throughput needs. FEMA (~75% coverage) and VA burial allowance ≈$2,000 affect margins and volume volatility.
| Metric | Value |
|---|---|
| Incorporated places | ≈19,500 |
| State boards | 50 |
| Carriage locations | ≈300 |
| Cremation rate (2024) | ≈60% |
| FEMA cost share | ≈75% |
| VA allowance | ≈$2,000 |
What is included in the product
 Detailed Word Document
Explores how external macro-environmental factors uniquely affect Carriage Services across Political, Economic, Social, Technological, Environmental and Legal dimensions, with data-backed trends and forward-looking insights tailored to its region and industry to inform executives, investors and strategists.

 Customizable Excel Spreadsheet
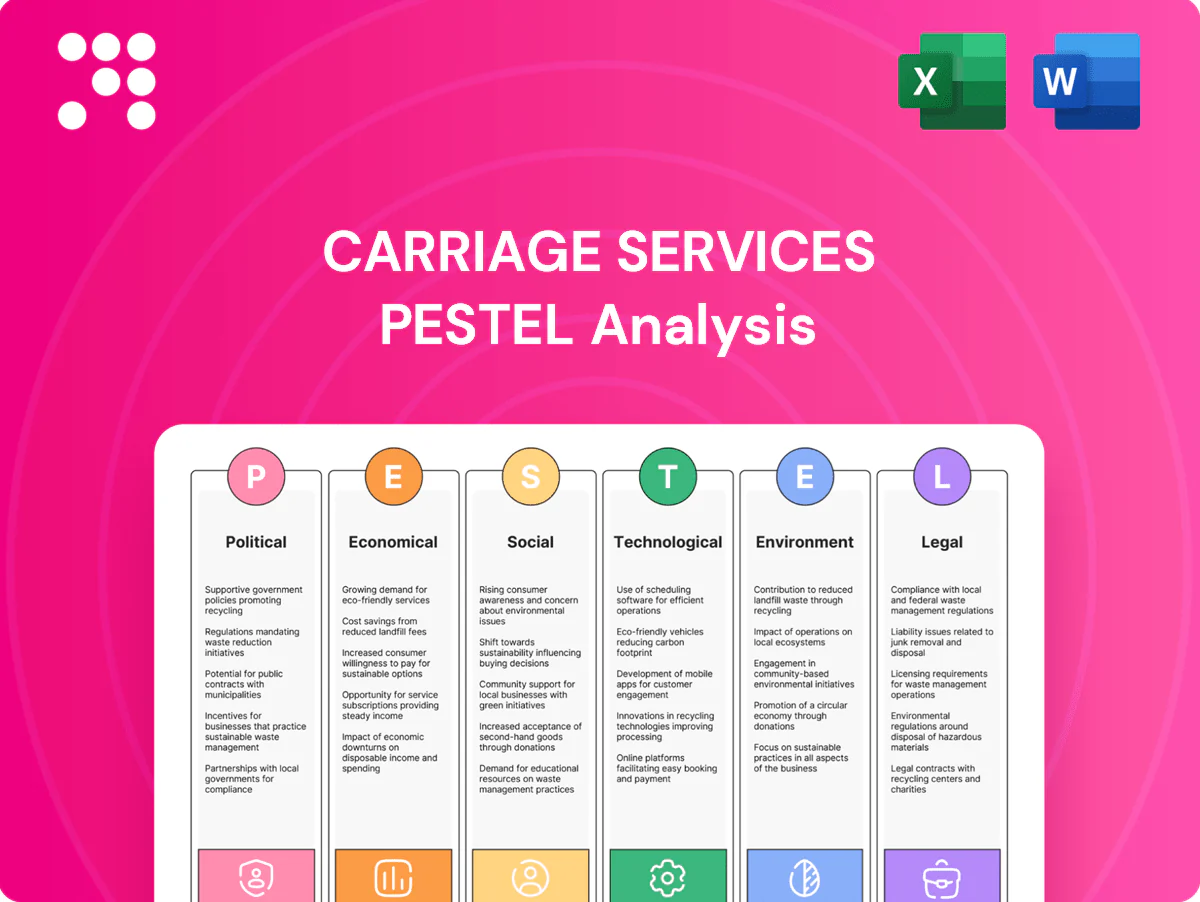
A concise, visually segmented PESTLE summary for Carriage Services that simplifies external risk assessment, can be dropped into presentations or strategy packs, and is easily shared and annotated for team planning and client reports.
Economic factors

Interest rates and preneed trust returns
Preneed funds at Carriage Services are invested and highly sensitive to rate cycles and asset performance; with the US 10-year yield near 4.2% and the fed funds rate around 5.25% in mid-2025, investment income has improved relative to the low-rate era. Higher yields can strengthen margins and trust adequacy against roughly $1.2B of preneed assets, while falling rates would compress earnings and force tighter asset-liability matching. Market volatility reduces cash flow predictability and increases reserve-management risk.
Inflation in input costs
Rising casket, urn, embalming chemical and energy costs have compressed service profitability, with suppliers citing double-digit price increases on select goods in 2023–24. Labor inflation and higher wage settlements in 2024 tightened margins for Carriage Services’ high-touch model. Pricing power varies by local competition and a cremation mix shift that exceeded 60% in recent years, reducing average revenue per disposition. Robust cost discipline and long-term supplier agreements are critical to preserve margins.

Demographic aging and mortality trends
Population aging underpins steady long-term demand for Carriage Services as US adults 65+ will outnumber children under 18 by 2034 (US Census), supporting predictable case volumes. Annual US deaths near 3.4 million (CDC 2022 provisional), though short-term mortality swings are region-specific and unpredictable. Rising cremation (about 58% in 2021, NFDA) shifts revenue per case lower versus burial, requiring capacity planning tied to local demographic projections.

Market consolidation dynamics
Market consolidation is driven by roughly 18,000 U.S. funeral homes, many family-owned, giving Carriage Services a sizable acquisition runway; public consolidators like CSV compete for bolt-ons. Valuation multiples have tracked credit conditions—spread volatility in 2022–24 affected deal pricing—and growth outlooks shift buyer willingness to pay. Integration capability determines realized synergies; paying premiums in hot markets can dilute returns.
- Fragmented supply: ~18,000 U.S. funeral homes
- Credit-sensitive multiples: deal pricing moved with 2022–24 spread volatility
- Integration = synergy capture
- Overpaying reduces IRR
Consumer price sensitivity
Families increasingly compare packages online and demand transparent pricing; with the U.S. cremation rate at about 59% in 2023 and inflation moderating to 3.4% in 2023, economic pressure pushes consumers toward lower-cost direct cremation options. Flexible offerings and point-of-sale financing can preserve market share, while strong brand trust supports premium tiers in affluent local markets.
- price-transparency
- 59%-cremation-rate-2023
- financing-preserves-share
- brand-trust-supports-premium
Permits add 3-12 months; inspections and ≈60% cremation increase siting risk
Preneed assets (~$1.2B) are highly rate-sensitive with the US 10-year ~4.2% and fed funds ~5.25% mid-2025, boosting investment income vs the low-rate era. Input and labor inflation (notable 2023–24 supplier price jumps) compressed margins while cremation (~59% in 2023) lowers revenue per case. A fragmented market (~18,000 funeral homes) creates M&A runway but multiples remain credit-sensitive after 2022–24 spread volatility.
| Metric | Value |
|---|---|
| US 10-yr yield (mid-2025) | ~4.2% |
| Fed funds (mid-2025) | ~5.25% |
| Preneed assets | $1.2B |
| Cremation rate (2023) | ~59% |
| Annual US deaths (CDC) | ~3.4M |
| US funeral homes | ~18,000 |
Preview Before You Purchase
Carriage Services PESTLE Analysis
The preview shown here is the exact Carriage Services PESTLE Analysis document you’ll receive after purchase—fully formatted and ready to use. The content, layout, and structure are identical to the downloadable file. No placeholders or excerpts; this is the final, professional report delivered instantly upon payment.

Skip the Research. Get the Strategy.
Unlock strategic clarity with our PESTLE Analysis of Carriage Services — concise insights show how political, economic, social, technological, legal, and environmental forces shape its outlook. Ideal for investors and strategists, this report turns external risks into actionable recommendations. Purchase the full, editable analysis now to access deep-dive findings and ready-to-use tools.
Political factors
Local zoning and land-use control
Funeral homes and cemeteries routinely require city council and planning commission approvals for siting, expansion and traffic plans, with special-use permits often adding 3–12 months to project timelines. Political sentiment on land use can materially delay projects or constrain inventory; U.S. has roughly 19,500 incorporated places with widely varying rules. Proactive community engagement reduces opposition and speeds permitting, lowering execution risk across municipalities.
State funeral board oversight
State funeral boards in all 50 states set operational standards and often tighten rules after high‑profile incidents, forcing changes in embalming, refrigeration and crematory protocols. Policy shifts matter as the U.S. cremation rate reached about 60% in 2024 (NFDA), altering facility mix and throughput needs. Compliance capacity—across Carriage Services' ~300 funeral/crematory locations—becomes a competitive differentiator. Increased inspections raise operating costs and can limit daily throughput.
Public health preparedness mandates
Epidemic and disaster policies dictate handling protocols, PPE standards and surge capacity requirements for funeral operators, often requiring rapid scaling of services. Government coordination can prioritize medical capacity or restrict gatherings, directly affecting demand patterns. FEMA and similar programs commonly cover ~75% of eligible emergency protective costs, offsetting expenses but adding heavy documentation burdens; preparedness planning therefore shapes operational resilience and public reputation.
Veterans and indigent burial programs
Federal, state and county veterans and indigent burial programs shape demand mix and pricing for eligible families; VA burial benefits (maximum federal allowance about $2,000 for certain cases) and varied state supplements change revenue per service, with policy adjustments directly altering margins. Contracting with agencies requires strict procurement and documentation processes; political budget cycles and one-time appropriations cause noticeable volume volatility year-to-year.
- Programs: federal/state/county
- Federal VA allowance ≈ $2,000
- Contract compliance mandatory
- Budget cycles → volume swings
Community relations and local politics
Neighborhood sentiment heavily influences municipal approvals for crematories and memorial parks, especially as the US cremation rate reached about 58% in 2023 (NFDA), driving demand and local scrutiny; elected officials routinely respond to constituent concerns over emissions, traffic, and aesthetics, and civic partnerships (sponsorships, public meetings) can build goodwill and reduce friction, while missteps have triggered restrictive ordinances in multiple municipalities.
- Local approvals tied to rising cremation demand (58% in 2023)
- Elected officials react to emissions, traffic, aesthetic complaints
- Civic partnerships lower opposition; missteps prompt ordinances
Permits add 3-12 months; inspections and ≈60% cremation increase siting risk
Municipal land‑use approvals and special‑use permits (≈19,500 incorporated places) add 3–12 months and drive siting risk. State funeral boards (all 50 states) and rising inspections raise compliance costs across Carriage Services’ ≈300 locations. U.S. cremation rate ≈60% in 2024 shifts facility mix and throughput needs. FEMA (~75% coverage) and VA burial allowance ≈$2,000 affect margins and volume volatility.
| Metric | Value |
|---|---|
| Incorporated places | ≈19,500 |
| State boards | 50 |
| Carriage locations | ≈300 |
| Cremation rate (2024) | ≈60% |
| FEMA cost share | ≈75% |
| VA allowance | ≈$2,000 |
What is included in the product
Detailed Word Document
Explores how external macro-environmental factors uniquely affect Carriage Services across Political, Economic, Social, Technological, Environmental and Legal dimensions, with data-backed trends and forward-looking insights tailored to its region and industry to inform executives, investors and strategists.
Customizable Excel Spreadsheet
A concise, visually segmented PESTLE summary for Carriage Services that simplifies external risk assessment, can be dropped into presentations or strategy packs, and is easily shared and annotated for team planning and client reports.
Economic factors
Interest rates and preneed trust returns
Preneed funds at Carriage Services are invested and highly sensitive to rate cycles and asset performance; with the US 10-year yield near 4.2% and the fed funds rate around 5.25% in mid-2025, investment income has improved relative to the low-rate era. Higher yields can strengthen margins and trust adequacy against roughly $1.2B of preneed assets, while falling rates would compress earnings and force tighter asset-liability matching. Market volatility reduces cash flow predictability and increases reserve-management risk.
Inflation in input costs
Rising casket, urn, embalming chemical and energy costs have compressed service profitability, with suppliers citing double-digit price increases on select goods in 2023–24. Labor inflation and higher wage settlements in 2024 tightened margins for Carriage Services’ high-touch model. Pricing power varies by local competition and a cremation mix shift that exceeded 60% in recent years, reducing average revenue per disposition. Robust cost discipline and long-term supplier agreements are critical to preserve margins.
Demographic aging and mortality trends
Population aging underpins steady long-term demand for Carriage Services as US adults 65+ will outnumber children under 18 by 2034 (US Census), supporting predictable case volumes. Annual US deaths near 3.4 million (CDC 2022 provisional), though short-term mortality swings are region-specific and unpredictable. Rising cremation (about 58% in 2021, NFDA) shifts revenue per case lower versus burial, requiring capacity planning tied to local demographic projections.
Market consolidation dynamics
Market consolidation is driven by roughly 18,000 U.S. funeral homes, many family-owned, giving Carriage Services a sizable acquisition runway; public consolidators like CSV compete for bolt-ons. Valuation multiples have tracked credit conditions—spread volatility in 2022–24 affected deal pricing—and growth outlooks shift buyer willingness to pay. Integration capability determines realized synergies; paying premiums in hot markets can dilute returns.
- Fragmented supply: ~18,000 U.S. funeral homes
- Credit-sensitive multiples: deal pricing moved with 2022–24 spread volatility
- Integration = synergy capture
- Overpaying reduces IRR
Consumer price sensitivity
Families increasingly compare packages online and demand transparent pricing; with the U.S. cremation rate at about 59% in 2023 and inflation moderating to 3.4% in 2023, economic pressure pushes consumers toward lower-cost direct cremation options. Flexible offerings and point-of-sale financing can preserve market share, while strong brand trust supports premium tiers in affluent local markets.
- price-transparency
- 59%-cremation-rate-2023
- financing-preserves-share
- brand-trust-supports-premium
Permits add 3-12 months; inspections and ≈60% cremation increase siting risk
Preneed assets (~$1.2B) are highly rate-sensitive with the US 10-year ~4.2% and fed funds ~5.25% mid-2025, boosting investment income vs the low-rate era. Input and labor inflation (notable 2023–24 supplier price jumps) compressed margins while cremation (~59% in 2023) lowers revenue per case. A fragmented market (~18,000 funeral homes) creates M&A runway but multiples remain credit-sensitive after 2022–24 spread volatility.
| Metric | Value |
|---|---|
| US 10-yr yield (mid-2025) | ~4.2% |
| Fed funds (mid-2025) | ~5.25% |
| Preneed assets | $1.2B |
| Cremation rate (2023) | ~59% |
| Annual US deaths (CDC) | ~3.4M |
| US funeral homes | ~18,000 |
Preview Before You Purchase
Carriage Services PESTLE Analysis
The preview shown here is the exact Carriage Services PESTLE Analysis document you’ll receive after purchase—fully formatted and ready to use. The content, layout, and structure are identical to the downloadable file. No placeholders or excerpts; this is the final, professional report delivered instantly upon payment.
Original: $10.00
-65%$10.00
$3.50Description
Skip the Research. Get the Strategy.
Unlock strategic clarity with our PESTLE Analysis of Carriage Services — concise insights show how political, economic, social, technological, legal, and environmental forces shape its outlook. Ideal for investors and strategists, this report turns external risks into actionable recommendations. Purchase the full, editable analysis now to access deep-dive findings and ready-to-use tools.
Political factors
Local zoning and land-use control
Funeral homes and cemeteries routinely require city council and planning commission approvals for siting, expansion and traffic plans, with special-use permits often adding 3–12 months to project timelines. Political sentiment on land use can materially delay projects or constrain inventory; U.S. has roughly 19,500 incorporated places with widely varying rules. Proactive community engagement reduces opposition and speeds permitting, lowering execution risk across municipalities.
State funeral board oversight
State funeral boards in all 50 states set operational standards and often tighten rules after high‑profile incidents, forcing changes in embalming, refrigeration and crematory protocols. Policy shifts matter as the U.S. cremation rate reached about 60% in 2024 (NFDA), altering facility mix and throughput needs. Compliance capacity—across Carriage Services' ~300 funeral/crematory locations—becomes a competitive differentiator. Increased inspections raise operating costs and can limit daily throughput.
Public health preparedness mandates
Epidemic and disaster policies dictate handling protocols, PPE standards and surge capacity requirements for funeral operators, often requiring rapid scaling of services. Government coordination can prioritize medical capacity or restrict gatherings, directly affecting demand patterns. FEMA and similar programs commonly cover ~75% of eligible emergency protective costs, offsetting expenses but adding heavy documentation burdens; preparedness planning therefore shapes operational resilience and public reputation.
Veterans and indigent burial programs
Federal, state and county veterans and indigent burial programs shape demand mix and pricing for eligible families; VA burial benefits (maximum federal allowance about $2,000 for certain cases) and varied state supplements change revenue per service, with policy adjustments directly altering margins. Contracting with agencies requires strict procurement and documentation processes; political budget cycles and one-time appropriations cause noticeable volume volatility year-to-year.
- Programs: federal/state/county
- Federal VA allowance ≈ $2,000
- Contract compliance mandatory
- Budget cycles → volume swings
Community relations and local politics
Neighborhood sentiment heavily influences municipal approvals for crematories and memorial parks, especially as the US cremation rate reached about 58% in 2023 (NFDA), driving demand and local scrutiny; elected officials routinely respond to constituent concerns over emissions, traffic, and aesthetics, and civic partnerships (sponsorships, public meetings) can build goodwill and reduce friction, while missteps have triggered restrictive ordinances in multiple municipalities.
- Local approvals tied to rising cremation demand (58% in 2023)
- Elected officials react to emissions, traffic, aesthetic complaints
- Civic partnerships lower opposition; missteps prompt ordinances
Permits add 3-12 months; inspections and ≈60% cremation increase siting risk
Municipal land‑use approvals and special‑use permits (≈19,500 incorporated places) add 3–12 months and drive siting risk. State funeral boards (all 50 states) and rising inspections raise compliance costs across Carriage Services’ ≈300 locations. U.S. cremation rate ≈60% in 2024 shifts facility mix and throughput needs. FEMA (~75% coverage) and VA burial allowance ≈$2,000 affect margins and volume volatility.
| Metric | Value |
|---|---|
| Incorporated places | ≈19,500 |
| State boards | 50 |
| Carriage locations | ≈300 |
| Cremation rate (2024) | ≈60% |
| FEMA cost share | ≈75% |
| VA allowance | ≈$2,000 |
What is included in the product
Detailed Word Document
Explores how external macro-environmental factors uniquely affect Carriage Services across Political, Economic, Social, Technological, Environmental and Legal dimensions, with data-backed trends and forward-looking insights tailored to its region and industry to inform executives, investors and strategists.
Customizable Excel Spreadsheet
A concise, visually segmented PESTLE summary for Carriage Services that simplifies external risk assessment, can be dropped into presentations or strategy packs, and is easily shared and annotated for team planning and client reports.
Economic factors
Interest rates and preneed trust returns
Preneed funds at Carriage Services are invested and highly sensitive to rate cycles and asset performance; with the US 10-year yield near 4.2% and the fed funds rate around 5.25% in mid-2025, investment income has improved relative to the low-rate era. Higher yields can strengthen margins and trust adequacy against roughly $1.2B of preneed assets, while falling rates would compress earnings and force tighter asset-liability matching. Market volatility reduces cash flow predictability and increases reserve-management risk.
Inflation in input costs
Rising casket, urn, embalming chemical and energy costs have compressed service profitability, with suppliers citing double-digit price increases on select goods in 2023–24. Labor inflation and higher wage settlements in 2024 tightened margins for Carriage Services’ high-touch model. Pricing power varies by local competition and a cremation mix shift that exceeded 60% in recent years, reducing average revenue per disposition. Robust cost discipline and long-term supplier agreements are critical to preserve margins.
Demographic aging and mortality trends
Population aging underpins steady long-term demand for Carriage Services as US adults 65+ will outnumber children under 18 by 2034 (US Census), supporting predictable case volumes. Annual US deaths near 3.4 million (CDC 2022 provisional), though short-term mortality swings are region-specific and unpredictable. Rising cremation (about 58% in 2021, NFDA) shifts revenue per case lower versus burial, requiring capacity planning tied to local demographic projections.
Market consolidation dynamics
Market consolidation is driven by roughly 18,000 U.S. funeral homes, many family-owned, giving Carriage Services a sizable acquisition runway; public consolidators like CSV compete for bolt-ons. Valuation multiples have tracked credit conditions—spread volatility in 2022–24 affected deal pricing—and growth outlooks shift buyer willingness to pay. Integration capability determines realized synergies; paying premiums in hot markets can dilute returns.
- Fragmented supply: ~18,000 U.S. funeral homes
- Credit-sensitive multiples: deal pricing moved with 2022–24 spread volatility
- Integration = synergy capture
- Overpaying reduces IRR
Consumer price sensitivity
Families increasingly compare packages online and demand transparent pricing; with the U.S. cremation rate at about 59% in 2023 and inflation moderating to 3.4% in 2023, economic pressure pushes consumers toward lower-cost direct cremation options. Flexible offerings and point-of-sale financing can preserve market share, while strong brand trust supports premium tiers in affluent local markets.
- price-transparency
- 59%-cremation-rate-2023
- financing-preserves-share
- brand-trust-supports-premium
Permits add 3-12 months; inspections and ≈60% cremation increase siting risk
Preneed assets (~$1.2B) are highly rate-sensitive with the US 10-year ~4.2% and fed funds ~5.25% mid-2025, boosting investment income vs the low-rate era. Input and labor inflation (notable 2023–24 supplier price jumps) compressed margins while cremation (~59% in 2023) lowers revenue per case. A fragmented market (~18,000 funeral homes) creates M&A runway but multiples remain credit-sensitive after 2022–24 spread volatility.
| Metric | Value |
|---|---|
| US 10-yr yield (mid-2025) | ~4.2% |
| Fed funds (mid-2025) | ~5.25% |
| Preneed assets | $1.2B |
| Cremation rate (2023) | ~59% |
| Annual US deaths (CDC) | ~3.4M |
| US funeral homes | ~18,000 |
Preview Before You Purchase
Carriage Services PESTLE Analysis
The preview shown here is the exact Carriage Services PESTLE Analysis document you’ll receive after purchase—fully formatted and ready to use. The content, layout, and structure are identical to the downloadable file. No placeholders or excerpts; this is the final, professional report delivered instantly upon payment.











