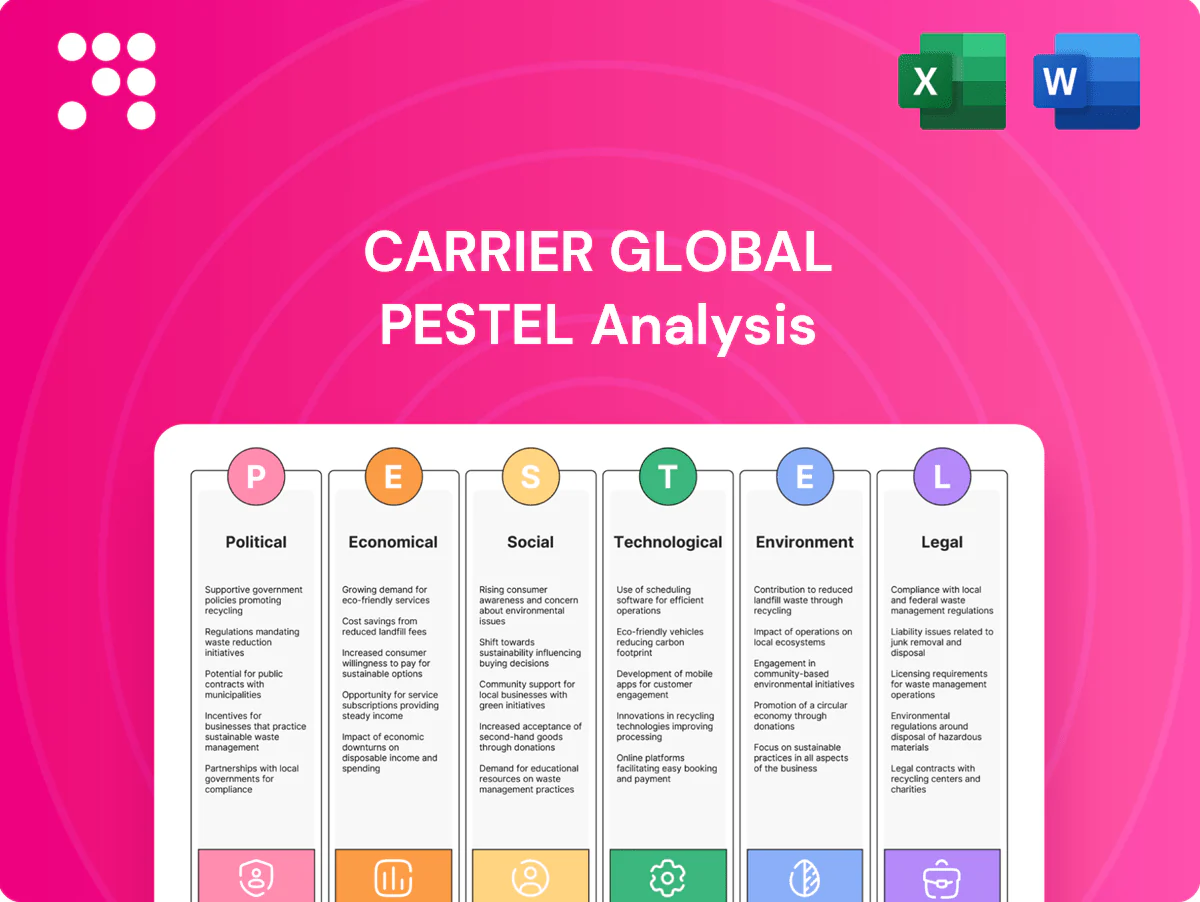
Carrier Global PESTLE Analysis

Your Shortcut to Market Insight Starts Here
Discover how political, economic, social, technological, legal, and environmental forces are reshaping Carrier Global’s trajectory in our concise PESTLE snapshot; gain clarity on regulatory risks, market drivers, and innovation levers. This analysis is ideal for investors and strategists seeking actionable insights. Purchase the full PESTLE to access the complete, exportable report and make smarter decisions.
Political factors

Energy-efficiency mandates
Governments tightening building codes and MEPS by 2024–25, raising minimum SEER, EER and AFUE thresholds, forces Carrier to pivot toward higher‑efficiency HVAC portfolios and higher R&D intensity. Carrier, with full‑year 2024 revenue around 21.0 billion USD, has signaled increased investment in efficient product lines to meet new standards. Compliance creates price premiums and raises barriers to low‑end competitors, while non‑compliance risks market access loss and regulatory penalties.
Refrigerant phase-down policy
Global Kigali targets a >80% HFC phasedown by mid-century, the US AIM Act mandates an 85% cut by 2036 and the EU F-gas regime cuts quotas ~79% by 2030, forcing Carrier to redesign systems, retool plants and train staff for low-GWP refrigerants. Early compliance can win tenders and access rebates; lagging risks stranded inventory, retrofit costs and regulatory fines.

Industrial policy and incentives
Heat pump subsidies and green tax credits from measures such as the US Inflation Reduction Act (roughly $369 billion for clean energy incentives) have materially stimulated demand and retrofit activity, lifting market opportunities for Carrier. Localization incentives across jurisdictions drive manufacturing siting and supplier selection to capture incentives. Policy volatility changes project pipelines and backlog visibility. Active government relations improve access to standards-setting and funding programs.

Trade policy and geopolitics
Tariffs on steel (25%) and aluminum (10%) directly raise BOM costs and pricing volatility for Carrier’s HVAC, refrigeration and components; expanded US export controls and sanctions (2023–24) limit sales of certain security and building-tech to China and sanctioned states; regionalization and nearshoring trends force diversified sourcing and higher capex; political instability in key markets disrupts service operations across Carrier’s ~170-country footprint.
- Tariffs: 25% steel, 10% aluminum
- Export controls: expanded 2023–24, restrict China/sanctioned sales
- Regionalization: nearshoring raises sourcing costs
- Political stability: affects service/distributor reliability (~170 countries)
Public infrastructure and housing programs
Government-funded schools (about 98,000 K–12 schools in the US), hospitals (roughly 6,000 acute care hospitals) and social housing programs tied to the US Infrastructure Investment and Jobs Act (1.2 trillion USD framework) drive large HVAC and controls tenders, favoring energy-saving, lifecycle-service solutions.
Procurement rules increasingly require compliant, low-carbon systems; shifts in fiscal priorities can rapidly swing bookings, while strong local certifications materially boost bid competitiveness.
- Public projects scale: Infrastructure Act 1.2 trillion USD
- Targets: schools ~98,000; hospitals ~6,000
- Procurement favors lifecycle, energy-saving solutions
- Local certifications increase win rates
Regulatory, HFC and tariff pressures push HVAC makers into higher R&D, pricing and supply risk
Stronger efficiency/regulatory standards (higher SEER/EER/AFUE) and HFC phase‑down (AIM Act 85% by 2036; Kigali >80% by mid‑century) force Carrier into higher R&D, premium pricing and compliance costs. IRA incentives (~$369bn) and Infrastructure Act (1.2tn USD) expand heat‑pump and retrofit demand; tariffs (steel 25%, Al 10%) and export controls raise BOM and market access risks.
| Metric | Value |
|---|---|
| 2024 Revenue | ~$21.0bn |
| IRA spend | $369bn |
| Infrastructure Act | $1.2tn |
What is included in the product
 Detailed Word Document
Explores how macro-environmental factors uniquely affect Carrier Global across Political, Economic, Social, Technological, Environmental and Legal dimensions, with each section backed by current data and trend analysis. Designed for executives and investors, the PESTLE delivers forward-looking insights, practical examples and clean formatting ready for inclusion in plans, decks or reports.

 Customizable Excel Spreadsheet
A clean, summarized PESTLE of Carrier Global, visually segmented by category for quick interpretation and editable notes for regional or business-line context—ideal for drop-in slides, team alignment, and risk/market positioning discussions.
Economic factors

Construction and retrofit cycles
Carrier’s order intake closely follows residential and commercial construction starts; in 2024 Carrier reported $18.9 billion in revenue, reflecting construction-linked demand swings. Retrofits accelerate as building stock ages and energy costs rise—global building energy use grew ~2% in 2024, boosting retrofit activity. Downturns delay capex but lift recurring service and maintenance revenue, and Carrier’s balanced new-equipment versus aftermarket mix smooths overall revenue volatility.
Interest rates and financing
Higher rates (fed funds ~5.25–5.50% mid‑2025, 30‑yr mortgage ~7%+) have damped housing and commercial starts (US housing starts slowed to ~1.3M annualized in 2024), delaying HVAC installations. Performance‑contracting and as‑a‑service models help offset capex constraints. Channel partner inventories track financing availability. Elevated cost of capital raises hurdle rates for M&A and capacity spend.

Input costs and supply availability
Steel, copper, aluminum, compressors and semiconductors drive Carrier’s margin sensitivity, with commodity swings and component lead times materially affecting BOM costs; semiconductors lead times eased to roughly 20 weeks by 2024 from pandemic peaks, improving availability. Strategic sourcing and hedging programs—cited in Carrier’s 2024 filings—help defend gross margin, while supply disruptions prompt product redesigns and dual-sourcing. Pricing power varies by brand strength, demonstrable efficiency gains and service-bundling, enabling premium pricing where lifecycle energy savings exceed upfront cost differentials.

Energy prices and payback
Volatile U.S. retail electricity (~17 cents/kWh in 2024, EIA) and natural gas (Henry Hub ~3.5 $/MMBtu avg 2024) shift relative appeal toward heat pumps over gas furnaces; rising energy costs shorten paybacks for premium efficiency and controls, making total cost of ownership messaging a primary sales lever. Utility and IRA/state rebates (often several thousand dollars in 2024–25) amplify demand elasticity.
- Higher energy prices → faster payback for heat pumps
- TCO messaging increases conversion rates
- Rebates (up to $3k–$10k in some jurisdictions) widen addressable market
Emerging market growth
Rising incomes and rapid urbanization in Asia, LATAM and MEA are expanding HVAC penetration, with the UN reporting 4.4 billion urban residents in 2023 and the IMF projecting emerging-market growth near 4.1% in 2024. Competing requires localized price tiers and features; FX volatility compresses reported revenue and shifts cost bases. Robust aftermarket networks underpin lifetime customer value and recurring revenue.
- Urbanization: UN 4.4B (2023)
- EM growth: IMF ~4.1% (2024)
- Localize pricing/features
- FX swings affect reported revenue
- Aftermarket drives LTV
Regulatory, HFC and tariff pressures push HVAC makers into higher R&D, pricing and supply risk
Carrier revenue $18.9B (2024); demand tied to US housing starts ~1.3M (2024) and EM growth ~4.1% (2024). Fed funds ~5.25–5.50% mid‑2025 and 30y mortgage ~7%+ constrain capex but boost service. Retail electricity ~17¢/kWh (2024) and rebates $3k–$10k accelerate heat‑pump adoption; commodity, chip lead times and FX pressure margins.
| Metric | Value |
|---|---|
| Revenue | $18.9B (2024) |
| US housing starts | ~1.3M (2024) |
| Fed funds | ~5.25–5.50% (mid‑2025) |
| Electricity | ~17¢/kWh (2024) |
Preview the Actual Deliverable
Carrier Global PESTLE Analysis
The preview shown here is the exact Carrier Global PESTLE Analysis you’ll receive after purchase—fully formatted, professionally structured, and ready to use. No placeholders or teasers; the content, layout, and structure visible here are the final file you’ll download immediately after payment.

Your Shortcut to Market Insight Starts Here
Discover how political, economic, social, technological, legal, and environmental forces are reshaping Carrier Global’s trajectory in our concise PESTLE snapshot; gain clarity on regulatory risks, market drivers, and innovation levers. This analysis is ideal for investors and strategists seeking actionable insights. Purchase the full PESTLE to access the complete, exportable report and make smarter decisions.
Political factors
Energy-efficiency mandates
Governments tightening building codes and MEPS by 2024–25, raising minimum SEER, EER and AFUE thresholds, forces Carrier to pivot toward higher‑efficiency HVAC portfolios and higher R&D intensity. Carrier, with full‑year 2024 revenue around 21.0 billion USD, has signaled increased investment in efficient product lines to meet new standards. Compliance creates price premiums and raises barriers to low‑end competitors, while non‑compliance risks market access loss and regulatory penalties.
Refrigerant phase-down policy
Global Kigali targets a >80% HFC phasedown by mid-century, the US AIM Act mandates an 85% cut by 2036 and the EU F-gas regime cuts quotas ~79% by 2030, forcing Carrier to redesign systems, retool plants and train staff for low-GWP refrigerants. Early compliance can win tenders and access rebates; lagging risks stranded inventory, retrofit costs and regulatory fines.
Industrial policy and incentives
Heat pump subsidies and green tax credits from measures such as the US Inflation Reduction Act (roughly $369 billion for clean energy incentives) have materially stimulated demand and retrofit activity, lifting market opportunities for Carrier. Localization incentives across jurisdictions drive manufacturing siting and supplier selection to capture incentives. Policy volatility changes project pipelines and backlog visibility. Active government relations improve access to standards-setting and funding programs.
Trade policy and geopolitics
Tariffs on steel (25%) and aluminum (10%) directly raise BOM costs and pricing volatility for Carrier’s HVAC, refrigeration and components; expanded US export controls and sanctions (2023–24) limit sales of certain security and building-tech to China and sanctioned states; regionalization and nearshoring trends force diversified sourcing and higher capex; political instability in key markets disrupts service operations across Carrier’s ~170-country footprint.
- Tariffs: 25% steel, 10% aluminum
- Export controls: expanded 2023–24, restrict China/sanctioned sales
- Regionalization: nearshoring raises sourcing costs
- Political stability: affects service/distributor reliability (~170 countries)
Public infrastructure and housing programs
Government-funded schools (about 98,000 K–12 schools in the US), hospitals (roughly 6,000 acute care hospitals) and social housing programs tied to the US Infrastructure Investment and Jobs Act (1.2 trillion USD framework) drive large HVAC and controls tenders, favoring energy-saving, lifecycle-service solutions.
Procurement rules increasingly require compliant, low-carbon systems; shifts in fiscal priorities can rapidly swing bookings, while strong local certifications materially boost bid competitiveness.
- Public projects scale: Infrastructure Act 1.2 trillion USD
- Targets: schools ~98,000; hospitals ~6,000
- Procurement favors lifecycle, energy-saving solutions
- Local certifications increase win rates
Regulatory, HFC and tariff pressures push HVAC makers into higher R&D, pricing and supply risk
Stronger efficiency/regulatory standards (higher SEER/EER/AFUE) and HFC phase‑down (AIM Act 85% by 2036; Kigali >80% by mid‑century) force Carrier into higher R&D, premium pricing and compliance costs. IRA incentives (~$369bn) and Infrastructure Act (1.2tn USD) expand heat‑pump and retrofit demand; tariffs (steel 25%, Al 10%) and export controls raise BOM and market access risks.
| Metric | Value |
|---|---|
| 2024 Revenue | ~$21.0bn |
| IRA spend | $369bn |
| Infrastructure Act | $1.2tn |
What is included in the product
Detailed Word Document
Explores how macro-environmental factors uniquely affect Carrier Global across Political, Economic, Social, Technological, Environmental and Legal dimensions, with each section backed by current data and trend analysis. Designed for executives and investors, the PESTLE delivers forward-looking insights, practical examples and clean formatting ready for inclusion in plans, decks or reports.
Customizable Excel Spreadsheet
A clean, summarized PESTLE of Carrier Global, visually segmented by category for quick interpretation and editable notes for regional or business-line context—ideal for drop-in slides, team alignment, and risk/market positioning discussions.
Economic factors
Construction and retrofit cycles
Carrier’s order intake closely follows residential and commercial construction starts; in 2024 Carrier reported $18.9 billion in revenue, reflecting construction-linked demand swings. Retrofits accelerate as building stock ages and energy costs rise—global building energy use grew ~2% in 2024, boosting retrofit activity. Downturns delay capex but lift recurring service and maintenance revenue, and Carrier’s balanced new-equipment versus aftermarket mix smooths overall revenue volatility.
Interest rates and financing
Higher rates (fed funds ~5.25–5.50% mid‑2025, 30‑yr mortgage ~7%+) have damped housing and commercial starts (US housing starts slowed to ~1.3M annualized in 2024), delaying HVAC installations. Performance‑contracting and as‑a‑service models help offset capex constraints. Channel partner inventories track financing availability. Elevated cost of capital raises hurdle rates for M&A and capacity spend.
Input costs and supply availability
Steel, copper, aluminum, compressors and semiconductors drive Carrier’s margin sensitivity, with commodity swings and component lead times materially affecting BOM costs; semiconductors lead times eased to roughly 20 weeks by 2024 from pandemic peaks, improving availability. Strategic sourcing and hedging programs—cited in Carrier’s 2024 filings—help defend gross margin, while supply disruptions prompt product redesigns and dual-sourcing. Pricing power varies by brand strength, demonstrable efficiency gains and service-bundling, enabling premium pricing where lifecycle energy savings exceed upfront cost differentials.
Energy prices and payback
Volatile U.S. retail electricity (~17 cents/kWh in 2024, EIA) and natural gas (Henry Hub ~3.5 $/MMBtu avg 2024) shift relative appeal toward heat pumps over gas furnaces; rising energy costs shorten paybacks for premium efficiency and controls, making total cost of ownership messaging a primary sales lever. Utility and IRA/state rebates (often several thousand dollars in 2024–25) amplify demand elasticity.
- Higher energy prices → faster payback for heat pumps
- TCO messaging increases conversion rates
- Rebates (up to $3k–$10k in some jurisdictions) widen addressable market
Emerging market growth
Rising incomes and rapid urbanization in Asia, LATAM and MEA are expanding HVAC penetration, with the UN reporting 4.4 billion urban residents in 2023 and the IMF projecting emerging-market growth near 4.1% in 2024. Competing requires localized price tiers and features; FX volatility compresses reported revenue and shifts cost bases. Robust aftermarket networks underpin lifetime customer value and recurring revenue.
- Urbanization: UN 4.4B (2023)
- EM growth: IMF ~4.1% (2024)
- Localize pricing/features
- FX swings affect reported revenue
- Aftermarket drives LTV
Regulatory, HFC and tariff pressures push HVAC makers into higher R&D, pricing and supply risk
Carrier revenue $18.9B (2024); demand tied to US housing starts ~1.3M (2024) and EM growth ~4.1% (2024). Fed funds ~5.25–5.50% mid‑2025 and 30y mortgage ~7%+ constrain capex but boost service. Retail electricity ~17¢/kWh (2024) and rebates $3k–$10k accelerate heat‑pump adoption; commodity, chip lead times and FX pressure margins.
| Metric | Value |
|---|---|
| Revenue | $18.9B (2024) |
| US housing starts | ~1.3M (2024) |
| Fed funds | ~5.25–5.50% (mid‑2025) |
| Electricity | ~17¢/kWh (2024) |
Preview the Actual Deliverable
Carrier Global PESTLE Analysis
The preview shown here is the exact Carrier Global PESTLE Analysis you’ll receive after purchase—fully formatted, professionally structured, and ready to use. No placeholders or teasers; the content, layout, and structure visible here are the final file you’ll download immediately after payment.
Original: $10.00
-65%$10.00
$3.50Description
Your Shortcut to Market Insight Starts Here
Discover how political, economic, social, technological, legal, and environmental forces are reshaping Carrier Global’s trajectory in our concise PESTLE snapshot; gain clarity on regulatory risks, market drivers, and innovation levers. This analysis is ideal for investors and strategists seeking actionable insights. Purchase the full PESTLE to access the complete, exportable report and make smarter decisions.
Political factors
Energy-efficiency mandates
Governments tightening building codes and MEPS by 2024–25, raising minimum SEER, EER and AFUE thresholds, forces Carrier to pivot toward higher‑efficiency HVAC portfolios and higher R&D intensity. Carrier, with full‑year 2024 revenue around 21.0 billion USD, has signaled increased investment in efficient product lines to meet new standards. Compliance creates price premiums and raises barriers to low‑end competitors, while non‑compliance risks market access loss and regulatory penalties.
Refrigerant phase-down policy
Global Kigali targets a >80% HFC phasedown by mid-century, the US AIM Act mandates an 85% cut by 2036 and the EU F-gas regime cuts quotas ~79% by 2030, forcing Carrier to redesign systems, retool plants and train staff for low-GWP refrigerants. Early compliance can win tenders and access rebates; lagging risks stranded inventory, retrofit costs and regulatory fines.
Industrial policy and incentives
Heat pump subsidies and green tax credits from measures such as the US Inflation Reduction Act (roughly $369 billion for clean energy incentives) have materially stimulated demand and retrofit activity, lifting market opportunities for Carrier. Localization incentives across jurisdictions drive manufacturing siting and supplier selection to capture incentives. Policy volatility changes project pipelines and backlog visibility. Active government relations improve access to standards-setting and funding programs.
Trade policy and geopolitics
Tariffs on steel (25%) and aluminum (10%) directly raise BOM costs and pricing volatility for Carrier’s HVAC, refrigeration and components; expanded US export controls and sanctions (2023–24) limit sales of certain security and building-tech to China and sanctioned states; regionalization and nearshoring trends force diversified sourcing and higher capex; political instability in key markets disrupts service operations across Carrier’s ~170-country footprint.
- Tariffs: 25% steel, 10% aluminum
- Export controls: expanded 2023–24, restrict China/sanctioned sales
- Regionalization: nearshoring raises sourcing costs
- Political stability: affects service/distributor reliability (~170 countries)
Public infrastructure and housing programs
Government-funded schools (about 98,000 K–12 schools in the US), hospitals (roughly 6,000 acute care hospitals) and social housing programs tied to the US Infrastructure Investment and Jobs Act (1.2 trillion USD framework) drive large HVAC and controls tenders, favoring energy-saving, lifecycle-service solutions.
Procurement rules increasingly require compliant, low-carbon systems; shifts in fiscal priorities can rapidly swing bookings, while strong local certifications materially boost bid competitiveness.
- Public projects scale: Infrastructure Act 1.2 trillion USD
- Targets: schools ~98,000; hospitals ~6,000
- Procurement favors lifecycle, energy-saving solutions
- Local certifications increase win rates
Regulatory, HFC and tariff pressures push HVAC makers into higher R&D, pricing and supply risk
Stronger efficiency/regulatory standards (higher SEER/EER/AFUE) and HFC phase‑down (AIM Act 85% by 2036; Kigali >80% by mid‑century) force Carrier into higher R&D, premium pricing and compliance costs. IRA incentives (~$369bn) and Infrastructure Act (1.2tn USD) expand heat‑pump and retrofit demand; tariffs (steel 25%, Al 10%) and export controls raise BOM and market access risks.
| Metric | Value |
|---|---|
| 2024 Revenue | ~$21.0bn |
| IRA spend | $369bn |
| Infrastructure Act | $1.2tn |
What is included in the product
Detailed Word Document
Explores how macro-environmental factors uniquely affect Carrier Global across Political, Economic, Social, Technological, Environmental and Legal dimensions, with each section backed by current data and trend analysis. Designed for executives and investors, the PESTLE delivers forward-looking insights, practical examples and clean formatting ready for inclusion in plans, decks or reports.
Customizable Excel Spreadsheet
A clean, summarized PESTLE of Carrier Global, visually segmented by category for quick interpretation and editable notes for regional or business-line context—ideal for drop-in slides, team alignment, and risk/market positioning discussions.
Economic factors
Construction and retrofit cycles
Carrier’s order intake closely follows residential and commercial construction starts; in 2024 Carrier reported $18.9 billion in revenue, reflecting construction-linked demand swings. Retrofits accelerate as building stock ages and energy costs rise—global building energy use grew ~2% in 2024, boosting retrofit activity. Downturns delay capex but lift recurring service and maintenance revenue, and Carrier’s balanced new-equipment versus aftermarket mix smooths overall revenue volatility.
Interest rates and financing
Higher rates (fed funds ~5.25–5.50% mid‑2025, 30‑yr mortgage ~7%+) have damped housing and commercial starts (US housing starts slowed to ~1.3M annualized in 2024), delaying HVAC installations. Performance‑contracting and as‑a‑service models help offset capex constraints. Channel partner inventories track financing availability. Elevated cost of capital raises hurdle rates for M&A and capacity spend.
Input costs and supply availability
Steel, copper, aluminum, compressors and semiconductors drive Carrier’s margin sensitivity, with commodity swings and component lead times materially affecting BOM costs; semiconductors lead times eased to roughly 20 weeks by 2024 from pandemic peaks, improving availability. Strategic sourcing and hedging programs—cited in Carrier’s 2024 filings—help defend gross margin, while supply disruptions prompt product redesigns and dual-sourcing. Pricing power varies by brand strength, demonstrable efficiency gains and service-bundling, enabling premium pricing where lifecycle energy savings exceed upfront cost differentials.
Energy prices and payback
Volatile U.S. retail electricity (~17 cents/kWh in 2024, EIA) and natural gas (Henry Hub ~3.5 $/MMBtu avg 2024) shift relative appeal toward heat pumps over gas furnaces; rising energy costs shorten paybacks for premium efficiency and controls, making total cost of ownership messaging a primary sales lever. Utility and IRA/state rebates (often several thousand dollars in 2024–25) amplify demand elasticity.
- Higher energy prices → faster payback for heat pumps
- TCO messaging increases conversion rates
- Rebates (up to $3k–$10k in some jurisdictions) widen addressable market
Emerging market growth
Rising incomes and rapid urbanization in Asia, LATAM and MEA are expanding HVAC penetration, with the UN reporting 4.4 billion urban residents in 2023 and the IMF projecting emerging-market growth near 4.1% in 2024. Competing requires localized price tiers and features; FX volatility compresses reported revenue and shifts cost bases. Robust aftermarket networks underpin lifetime customer value and recurring revenue.
- Urbanization: UN 4.4B (2023)
- EM growth: IMF ~4.1% (2024)
- Localize pricing/features
- FX swings affect reported revenue
- Aftermarket drives LTV
Regulatory, HFC and tariff pressures push HVAC makers into higher R&D, pricing and supply risk
Carrier revenue $18.9B (2024); demand tied to US housing starts ~1.3M (2024) and EM growth ~4.1% (2024). Fed funds ~5.25–5.50% mid‑2025 and 30y mortgage ~7%+ constrain capex but boost service. Retail electricity ~17¢/kWh (2024) and rebates $3k–$10k accelerate heat‑pump adoption; commodity, chip lead times and FX pressure margins.
| Metric | Value |
|---|---|
| Revenue | $18.9B (2024) |
| US housing starts | ~1.3M (2024) |
| Fed funds | ~5.25–5.50% (mid‑2025) |
| Electricity | ~17¢/kWh (2024) |
Preview the Actual Deliverable
Carrier Global PESTLE Analysis
The preview shown here is the exact Carrier Global PESTLE Analysis you’ll receive after purchase—fully formatted, professionally structured, and ready to use. No placeholders or teasers; the content, layout, and structure visible here are the final file you’ll download immediately after payment.











