Carvana Boston Consulting Group Matrix

Unlock Strategic Clarity
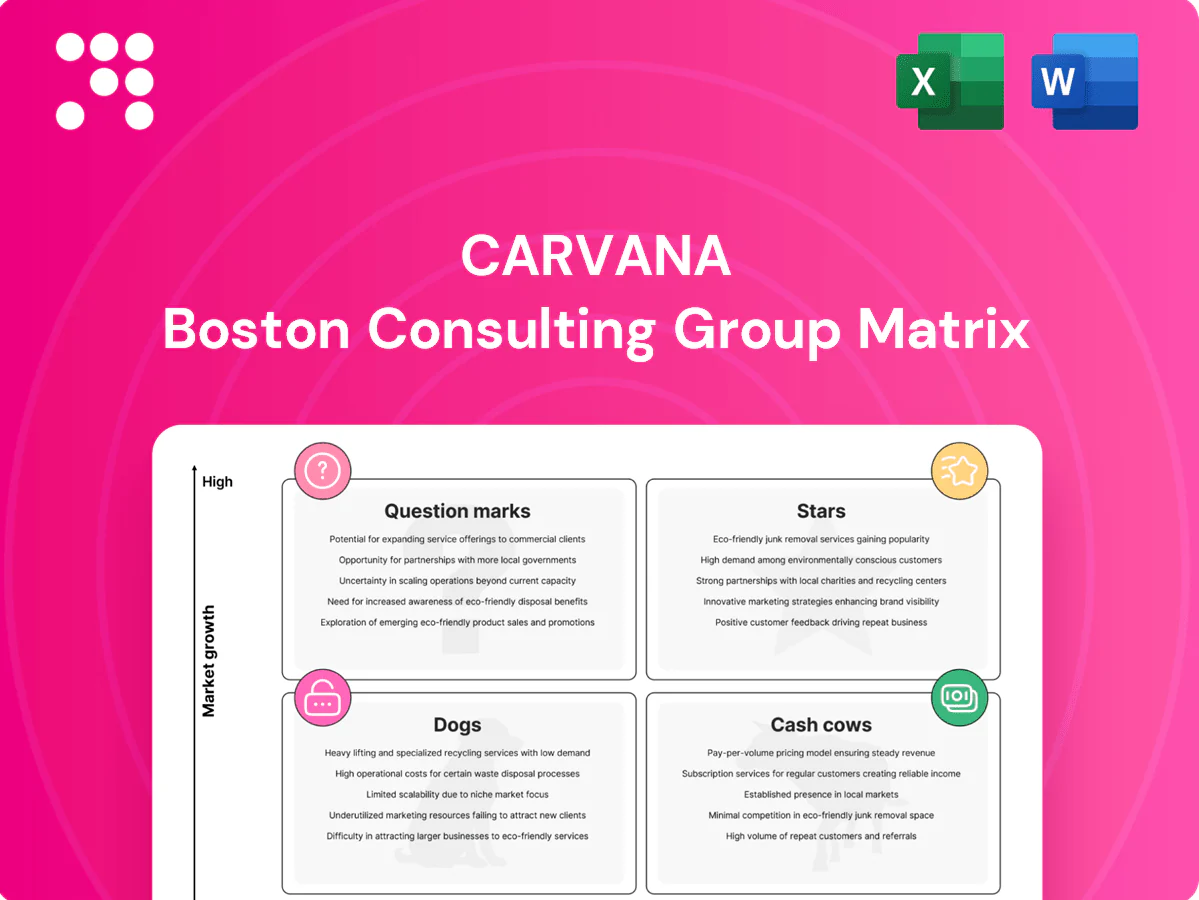
Curious where Carvana’s offerings land — Stars, Cash Cows, Dogs, or Question Marks? This preview teases the moves; the full BCG Matrix gives you quadrant-by-quadrant placement, data-backed recommendations, and a clear playbook for capital allocation and product focus. Buy the complete report and get a ready-to-present Word analysis plus a high-level Excel summary to slot straight into your board pack. Skip the guesswork—purchase now and start making sharper strategic calls today.
Stars

Core e-commerce used-car marketplace
High-growth demand meets a brand people now recognize: Carvana remains a core e-commerce used-car marketplace with digital used-car penetration hitting about 16% in 2024, supporting continued volume gains. Its end-to-end online journey removes friction, keeping market share rising in digital retail. Heavy investment in UX, inventory depth and rebuilding trust is still required; hold the lead and it can mature into a cash cow.
Integrated logistics and last‑mile delivery
Owning the transport spine speeds turns and protects margins in a growing category by cutting reliance on third parties and capturing last‑mile value; last‑mile logistics account for up to 53% of total delivery costs. Faster delivery is a real moat online—customers report higher satisfaction and conversion with shorter arrival windows. It burns capital to scale, but payoff shows in share gains and improved unit economics as routes, density, and fleet utilization are optimized.

Inspection & reconditioning centers (IRCs)
Quality control is the engine powering trust and repeat; standardized reconditioning and throughput preserve condition as volumes rise. IRCs are capital-heavy but scale-efficient: Cox Automotive reported average reconditioning costs around $1,200 per vehicle in 2024, making automation and lean flow ROI-positive. Invest in robotics, conveyorized bays, and tech-enabled QC to deliver consistent outcomes and shorter cycle times.

Instant appraisal and trade‑in funnel
Instant appraisal and trade-in is the sourcing linchpin for Carvana, where top-quality inventory originates and instant offers lift conversion while reducing auction dependency.
Carvana reported roughly $9.4B revenue in 2023, underscoring scale benefits from owning supply channels; the funnel demands heavy engineering and marketing investment but powers the retail flywheel.
Continuously iterate pricing models and seller UX to protect margins and supplier flow—instant offers are a Stars play that fuels growth and lowers variable acquisition costs.
- Supply-first
- Conversion boost
- Auction down
- High tech & marketing spend
- Iterate pricing & UX
In-house financing & checkout stack
Embedded lending lifts conversion and basket size in the growing online auto channel; by 2024 embedded finance became standard for leading e-retailers, and Carvana’s pre-qual-in-minutes plus seamless close forms a durable moat that increases share and lifetime value.
- Conversion uplift: higher with embedded lending
- Moat: quick pre-qual + seamless close
- Need: capital markets + risk discipline
- Outcome: drives share & LTV
Digital used-car star: 16% penetration, $9.4B scale
High-growth digital share (16% digital used-car penetration in 2024) and scale ($9.4B revenue in 2023) position Carvana as a Star; investment-heavy logistics and reconditioning ($1,200/vehicle est. 2024) compress near-term cash but lift unit economics. Owning last-mile (up to 53% of delivery costs) and embedded finance (standard by 2024) increases conversion and LTV, enabling maturation to a cash cow with sustained market share.
| Metric | Value |
|---|---|
| Digital penetration (2024) | 16% |
| Revenue (2023) | $9.4B |
| Reconditioning (2024) | $1,200/vehicle |
| Last-mile cost share (2024) | 53% |
What is included in the product
 Detailed Word Document
Assessment of Carvana's units across BCG quadrants with strategic moves: invest, hold, or divest, plus risks and market context.

 Customizable Excel Spreadsheet
One-page Carvana BCG Matrix highlighting growth vs market share to cut analysis time and speed C-suite decisions.
Cash Cows

Ancillary products (warranties, GAP, protection)
High-margin ancillary add-ons (service contracts, GAP, protection) deliver steady attach rates in a mature U.S. market—industry attach rates averaged 30–40% in 2024—producing outsized incremental margins and consistent cash flow for Carvana. Low incremental marketing and digital delivery keep acquisition costs down, making these products near pure cash cows. Optimizing bundles and timing in the funnel nudges uptake and quietly funds pricier growth bets.
Title, registration, and doc fees
Title, registration, and doc fees are regulatory, per-vehicle charges that provided Carvana with predictable, low-margin recurring revenue in 2024. The process is largely standardized and automated now, so incremental cost per unit is minimal and compliance focus preserves cash flow. Not glamorous but highly useful—these fees helped stabilize transaction-level cash generation in 2024.

Brand equity and organic demand
After years of heavy customer-acquisition spend, branded search and word-of-mouth now drive a larger share of inbound demand for Carvana, lowering CAC among repeat buyers in established markets. Focus on maintaining a baseline digital presence rather than national blitzes to preserve these efficiencies. Milk the improved unit economics while closely measuring organic decay rates and attribution to avoid backsliding.

Mature metro delivery zones
Mature metro delivery zones generate predictable cash flows from dense demand and near-full route utilization, with unit economics stabilizing once target density is reached. Minimal promotional spend is required beyond periodic inventory refresh, shifting emphasis to operational efficiency. Key levers are faster turn times, higher drop density and reduced empty miles to protect margin.
- Established markets, high utilization
- Stable unit economics at target density
- Low promo spend; refresh-only
- Efficiency focus: turn times, drop density, fewer empty miles
Wholesale disposition channels
Wholesale disposition channels convert non-retail inventory into fast cash, preserving margin by avoiding retail holding costs and reducing reconditioning; in 2024 Carvana continued to rely on wholesale lanes as a predictable cash source. The playbook is repeatable and low-growth but delivers reliable cash recovery with minimal marketing spend. Continuous focus on time-to-liquidation and fee compression improves net recovery.
Ancillary add-ons and fees drive steady, low-cost cash with stable unit economics
High-margin ancillary add-ons (industry attach 30–40% in 2024) and standardized title/registration fees produced steady, low-cost cash generation; mature metro delivery zones and wholesale lanes reinforced predictable unit-level cash flow while CAC fell among repeat buyers.
| Line | 2024 metric | Impact |
|---|---|---|
| Add-ons | Attach 30–40% | High incremental margin |
| Fees | Standardized | Predictable cash |
| Delivery/Wholesale | High utilization | Stable unit economics |
What You’re Viewing Is Included
Carvana BCG Matrix
The file you're previewing here is the exact BCG Matrix report you'll receive after purchase—no watermarks, no placeholders, just the finished product. It's been crafted for clarity, with market-backed analysis and clean formatting so you can present it straight away. After payment you'll get the full, editable file delivered to your inbox—ready for printing, editing, or sharing with your team. No surprises, no extra steps—just the real report, ready to use.

Unlock Strategic Clarity
Curious where Carvana’s offerings land — Stars, Cash Cows, Dogs, or Question Marks? This preview teases the moves; the full BCG Matrix gives you quadrant-by-quadrant placement, data-backed recommendations, and a clear playbook for capital allocation and product focus. Buy the complete report and get a ready-to-present Word analysis plus a high-level Excel summary to slot straight into your board pack. Skip the guesswork—purchase now and start making sharper strategic calls today.
Stars
Core e-commerce used-car marketplace
High-growth demand meets a brand people now recognize: Carvana remains a core e-commerce used-car marketplace with digital used-car penetration hitting about 16% in 2024, supporting continued volume gains. Its end-to-end online journey removes friction, keeping market share rising in digital retail. Heavy investment in UX, inventory depth and rebuilding trust is still required; hold the lead and it can mature into a cash cow.
Integrated logistics and last‑mile delivery
Owning the transport spine speeds turns and protects margins in a growing category by cutting reliance on third parties and capturing last‑mile value; last‑mile logistics account for up to 53% of total delivery costs. Faster delivery is a real moat online—customers report higher satisfaction and conversion with shorter arrival windows. It burns capital to scale, but payoff shows in share gains and improved unit economics as routes, density, and fleet utilization are optimized.
Inspection & reconditioning centers (IRCs)
Quality control is the engine powering trust and repeat; standardized reconditioning and throughput preserve condition as volumes rise. IRCs are capital-heavy but scale-efficient: Cox Automotive reported average reconditioning costs around $1,200 per vehicle in 2024, making automation and lean flow ROI-positive. Invest in robotics, conveyorized bays, and tech-enabled QC to deliver consistent outcomes and shorter cycle times.
Instant appraisal and trade‑in funnel
Instant appraisal and trade-in is the sourcing linchpin for Carvana, where top-quality inventory originates and instant offers lift conversion while reducing auction dependency.
Carvana reported roughly $9.4B revenue in 2023, underscoring scale benefits from owning supply channels; the funnel demands heavy engineering and marketing investment but powers the retail flywheel.
Continuously iterate pricing models and seller UX to protect margins and supplier flow—instant offers are a Stars play that fuels growth and lowers variable acquisition costs.
- Supply-first
- Conversion boost
- Auction down
- High tech & marketing spend
- Iterate pricing & UX
In-house financing & checkout stack
Embedded lending lifts conversion and basket size in the growing online auto channel; by 2024 embedded finance became standard for leading e-retailers, and Carvana’s pre-qual-in-minutes plus seamless close forms a durable moat that increases share and lifetime value.
- Conversion uplift: higher with embedded lending
- Moat: quick pre-qual + seamless close
- Need: capital markets + risk discipline
- Outcome: drives share & LTV
Digital used-car star: 16% penetration, $9.4B scale
High-growth digital share (16% digital used-car penetration in 2024) and scale ($9.4B revenue in 2023) position Carvana as a Star; investment-heavy logistics and reconditioning ($1,200/vehicle est. 2024) compress near-term cash but lift unit economics. Owning last-mile (up to 53% of delivery costs) and embedded finance (standard by 2024) increases conversion and LTV, enabling maturation to a cash cow with sustained market share.
| Metric | Value |
|---|---|
| Digital penetration (2024) | 16% |
| Revenue (2023) | $9.4B |
| Reconditioning (2024) | $1,200/vehicle |
| Last-mile cost share (2024) | 53% |
What is included in the product
Detailed Word Document
Assessment of Carvana's units across BCG quadrants with strategic moves: invest, hold, or divest, plus risks and market context.
Customizable Excel Spreadsheet
One-page Carvana BCG Matrix highlighting growth vs market share to cut analysis time and speed C-suite decisions.
Cash Cows
Ancillary products (warranties, GAP, protection)
High-margin ancillary add-ons (service contracts, GAP, protection) deliver steady attach rates in a mature U.S. market—industry attach rates averaged 30–40% in 2024—producing outsized incremental margins and consistent cash flow for Carvana. Low incremental marketing and digital delivery keep acquisition costs down, making these products near pure cash cows. Optimizing bundles and timing in the funnel nudges uptake and quietly funds pricier growth bets.
Title, registration, and doc fees
Title, registration, and doc fees are regulatory, per-vehicle charges that provided Carvana with predictable, low-margin recurring revenue in 2024. The process is largely standardized and automated now, so incremental cost per unit is minimal and compliance focus preserves cash flow. Not glamorous but highly useful—these fees helped stabilize transaction-level cash generation in 2024.
Brand equity and organic demand
After years of heavy customer-acquisition spend, branded search and word-of-mouth now drive a larger share of inbound demand for Carvana, lowering CAC among repeat buyers in established markets. Focus on maintaining a baseline digital presence rather than national blitzes to preserve these efficiencies. Milk the improved unit economics while closely measuring organic decay rates and attribution to avoid backsliding.
Mature metro delivery zones
Mature metro delivery zones generate predictable cash flows from dense demand and near-full route utilization, with unit economics stabilizing once target density is reached. Minimal promotional spend is required beyond periodic inventory refresh, shifting emphasis to operational efficiency. Key levers are faster turn times, higher drop density and reduced empty miles to protect margin.
- Established markets, high utilization
- Stable unit economics at target density
- Low promo spend; refresh-only
- Efficiency focus: turn times, drop density, fewer empty miles
Wholesale disposition channels
Wholesale disposition channels convert non-retail inventory into fast cash, preserving margin by avoiding retail holding costs and reducing reconditioning; in 2024 Carvana continued to rely on wholesale lanes as a predictable cash source. The playbook is repeatable and low-growth but delivers reliable cash recovery with minimal marketing spend. Continuous focus on time-to-liquidation and fee compression improves net recovery.
Ancillary add-ons and fees drive steady, low-cost cash with stable unit economics
High-margin ancillary add-ons (industry attach 30–40% in 2024) and standardized title/registration fees produced steady, low-cost cash generation; mature metro delivery zones and wholesale lanes reinforced predictable unit-level cash flow while CAC fell among repeat buyers.
| Line | 2024 metric | Impact |
|---|---|---|
| Add-ons | Attach 30–40% | High incremental margin |
| Fees | Standardized | Predictable cash |
| Delivery/Wholesale | High utilization | Stable unit economics |
What You’re Viewing Is Included
Carvana BCG Matrix
The file you're previewing here is the exact BCG Matrix report you'll receive after purchase—no watermarks, no placeholders, just the finished product. It's been crafted for clarity, with market-backed analysis and clean formatting so you can present it straight away. After payment you'll get the full, editable file delivered to your inbox—ready for printing, editing, or sharing with your team. No surprises, no extra steps—just the real report, ready to use.
Original: $10.00
-65%$10.00
$3.50Description
Unlock Strategic Clarity
Curious where Carvana’s offerings land — Stars, Cash Cows, Dogs, or Question Marks? This preview teases the moves; the full BCG Matrix gives you quadrant-by-quadrant placement, data-backed recommendations, and a clear playbook for capital allocation and product focus. Buy the complete report and get a ready-to-present Word analysis plus a high-level Excel summary to slot straight into your board pack. Skip the guesswork—purchase now and start making sharper strategic calls today.
Stars
Core e-commerce used-car marketplace
High-growth demand meets a brand people now recognize: Carvana remains a core e-commerce used-car marketplace with digital used-car penetration hitting about 16% in 2024, supporting continued volume gains. Its end-to-end online journey removes friction, keeping market share rising in digital retail. Heavy investment in UX, inventory depth and rebuilding trust is still required; hold the lead and it can mature into a cash cow.
Integrated logistics and last‑mile delivery
Owning the transport spine speeds turns and protects margins in a growing category by cutting reliance on third parties and capturing last‑mile value; last‑mile logistics account for up to 53% of total delivery costs. Faster delivery is a real moat online—customers report higher satisfaction and conversion with shorter arrival windows. It burns capital to scale, but payoff shows in share gains and improved unit economics as routes, density, and fleet utilization are optimized.
Inspection & reconditioning centers (IRCs)
Quality control is the engine powering trust and repeat; standardized reconditioning and throughput preserve condition as volumes rise. IRCs are capital-heavy but scale-efficient: Cox Automotive reported average reconditioning costs around $1,200 per vehicle in 2024, making automation and lean flow ROI-positive. Invest in robotics, conveyorized bays, and tech-enabled QC to deliver consistent outcomes and shorter cycle times.
Instant appraisal and trade‑in funnel
Instant appraisal and trade-in is the sourcing linchpin for Carvana, where top-quality inventory originates and instant offers lift conversion while reducing auction dependency.
Carvana reported roughly $9.4B revenue in 2023, underscoring scale benefits from owning supply channels; the funnel demands heavy engineering and marketing investment but powers the retail flywheel.
Continuously iterate pricing models and seller UX to protect margins and supplier flow—instant offers are a Stars play that fuels growth and lowers variable acquisition costs.
- Supply-first
- Conversion boost
- Auction down
- High tech & marketing spend
- Iterate pricing & UX
In-house financing & checkout stack
Embedded lending lifts conversion and basket size in the growing online auto channel; by 2024 embedded finance became standard for leading e-retailers, and Carvana’s pre-qual-in-minutes plus seamless close forms a durable moat that increases share and lifetime value.
- Conversion uplift: higher with embedded lending
- Moat: quick pre-qual + seamless close
- Need: capital markets + risk discipline
- Outcome: drives share & LTV
Digital used-car star: 16% penetration, $9.4B scale
High-growth digital share (16% digital used-car penetration in 2024) and scale ($9.4B revenue in 2023) position Carvana as a Star; investment-heavy logistics and reconditioning ($1,200/vehicle est. 2024) compress near-term cash but lift unit economics. Owning last-mile (up to 53% of delivery costs) and embedded finance (standard by 2024) increases conversion and LTV, enabling maturation to a cash cow with sustained market share.
| Metric | Value |
|---|---|
| Digital penetration (2024) | 16% |
| Revenue (2023) | $9.4B |
| Reconditioning (2024) | $1,200/vehicle |
| Last-mile cost share (2024) | 53% |
What is included in the product
Detailed Word Document
Assessment of Carvana's units across BCG quadrants with strategic moves: invest, hold, or divest, plus risks and market context.
Customizable Excel Spreadsheet
One-page Carvana BCG Matrix highlighting growth vs market share to cut analysis time and speed C-suite decisions.
Cash Cows
Ancillary products (warranties, GAP, protection)
High-margin ancillary add-ons (service contracts, GAP, protection) deliver steady attach rates in a mature U.S. market—industry attach rates averaged 30–40% in 2024—producing outsized incremental margins and consistent cash flow for Carvana. Low incremental marketing and digital delivery keep acquisition costs down, making these products near pure cash cows. Optimizing bundles and timing in the funnel nudges uptake and quietly funds pricier growth bets.
Title, registration, and doc fees
Title, registration, and doc fees are regulatory, per-vehicle charges that provided Carvana with predictable, low-margin recurring revenue in 2024. The process is largely standardized and automated now, so incremental cost per unit is minimal and compliance focus preserves cash flow. Not glamorous but highly useful—these fees helped stabilize transaction-level cash generation in 2024.
Brand equity and organic demand
After years of heavy customer-acquisition spend, branded search and word-of-mouth now drive a larger share of inbound demand for Carvana, lowering CAC among repeat buyers in established markets. Focus on maintaining a baseline digital presence rather than national blitzes to preserve these efficiencies. Milk the improved unit economics while closely measuring organic decay rates and attribution to avoid backsliding.
Mature metro delivery zones
Mature metro delivery zones generate predictable cash flows from dense demand and near-full route utilization, with unit economics stabilizing once target density is reached. Minimal promotional spend is required beyond periodic inventory refresh, shifting emphasis to operational efficiency. Key levers are faster turn times, higher drop density and reduced empty miles to protect margin.
- Established markets, high utilization
- Stable unit economics at target density
- Low promo spend; refresh-only
- Efficiency focus: turn times, drop density, fewer empty miles
Wholesale disposition channels
Wholesale disposition channels convert non-retail inventory into fast cash, preserving margin by avoiding retail holding costs and reducing reconditioning; in 2024 Carvana continued to rely on wholesale lanes as a predictable cash source. The playbook is repeatable and low-growth but delivers reliable cash recovery with minimal marketing spend. Continuous focus on time-to-liquidation and fee compression improves net recovery.
Ancillary add-ons and fees drive steady, low-cost cash with stable unit economics
High-margin ancillary add-ons (industry attach 30–40% in 2024) and standardized title/registration fees produced steady, low-cost cash generation; mature metro delivery zones and wholesale lanes reinforced predictable unit-level cash flow while CAC fell among repeat buyers.
| Line | 2024 metric | Impact |
|---|---|---|
| Add-ons | Attach 30–40% | High incremental margin |
| Fees | Standardized | Predictable cash |
| Delivery/Wholesale | High utilization | Stable unit economics |
What You’re Viewing Is Included
Carvana BCG Matrix
The file you're previewing here is the exact BCG Matrix report you'll receive after purchase—no watermarks, no placeholders, just the finished product. It's been crafted for clarity, with market-backed analysis and clean formatting so you can present it straight away. After payment you'll get the full, editable file delivered to your inbox—ready for printing, editing, or sharing with your team. No surprises, no extra steps—just the real report, ready to use.











