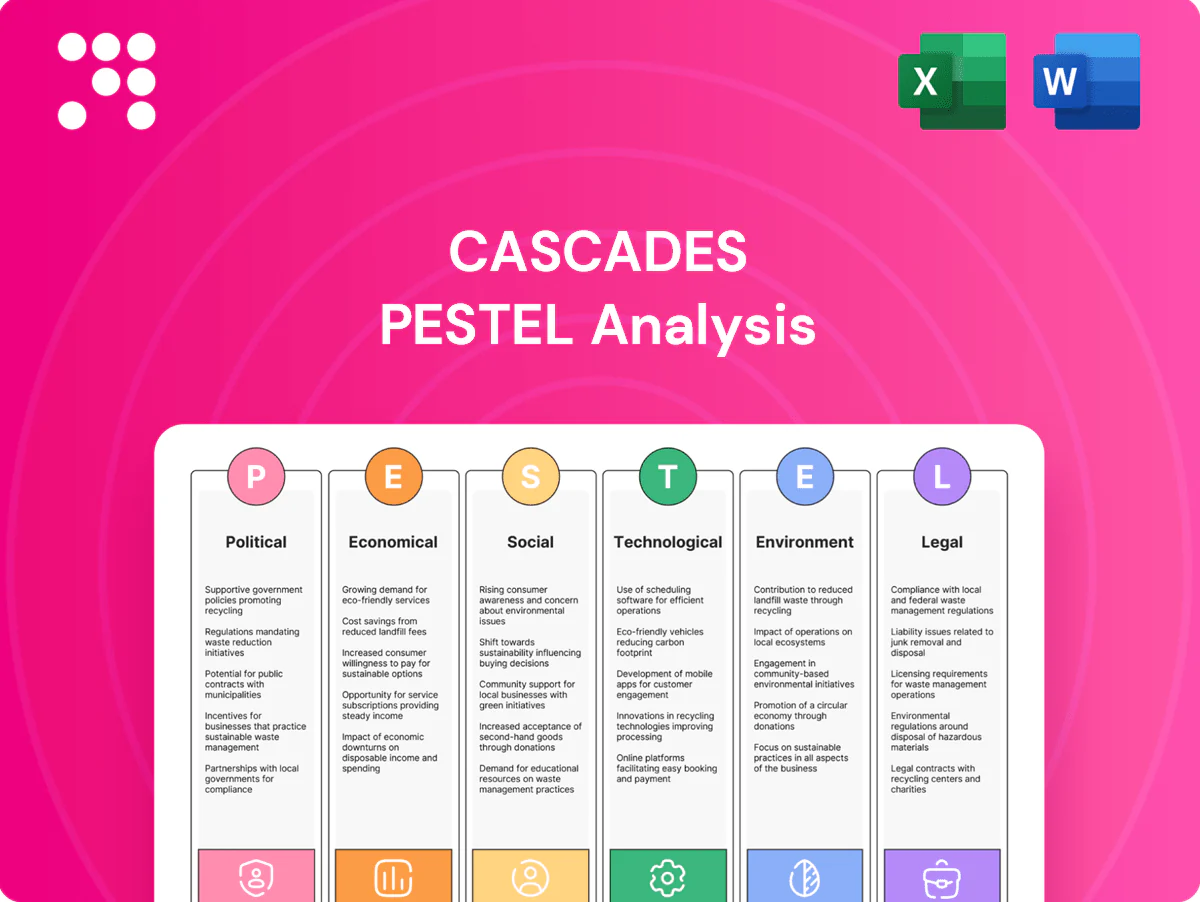
Cascades PESTLE Analysis

Make Smarter Strategic Decisions with a Complete PESTEL View
Unlock how political shifts, economic cycles, and sustainability trends are shaping Cascades' strategic path in our concise PESTLE snapshot—perfect for investors and strategists. See the risks and growth levers at a glance, then purchase the full PESTLE for detailed, actionable analysis you can implement immediately.
Political factors

Recycling and circular-economy policies
Canada and many provinces have adopted circular-economy roadmaps and extended producer responsibility programs (rolled out in BC, ON and QC in 2023–24) that align with Cascades’ recycled-fiber model and target higher collection and reuse by 2030. Tightening rules can expand feedstock access through improved collection rates and curbside capture. Compliance reporting and third-party auditing increase administrative costs and raise exposure to policy shifts affecting margins.
Trade policy and tariffs on paper products
USMCA stabilizes cross‑border sales for Cascades within a trilateral market worth over US$1.5 trillion annually, easing tariff uncertainty; however, anti‑dumping duties in pulp, paper or packaging—often in the 10–50% range—can rapidly alter price competitiveness. Any escalation with the U.S. or EU could compress margins or shift volumes by double‑digit percentages. Cascades must hedge via geographic diversification and broader product mix to protect EBITDA.

Government incentives for green manufacturing
Government incentives — notably the US Inflation Reduction Act’s $369 billion energy and climate package and Canada’s expanding federal clean‑tech funds — provide grants, tax credits and low‑interest loans that accelerate mill upgrades. Accessing these incentives shortens payback periods for CHP, electrification and heat‑recovery projects by improving upfront economics and IRR. Program design and eligibility criteria shape project sequencing and final ROI, determining which assets are prioritized.

Municipal and provincial procurement dynamics
Municipal and provincial procurement favors recycled, low-carbon packaging and tissue, with many Canadian and US municipalities requiring 100% recycled fiber for tissue and paper towels. Winning municipal contracts often secures 3–5 year volumes but requires meeting evolving sustainability specs and third-party certifications. Political budget cycles and tender timelines create timing and pricing uncertainty.
- Procurement tilt: recycled/low-carbon required
- Contract length: typically 3–5 years
- Specs: rising certification and recycled-content thresholds
- Risk: annual budgets and tenders cause timing/pricing volatility
Environmental permitting and siting politics
Mill expansions face local permitting, Indigenous consultation under the federal Impact Assessment Act (2019), and heightened community engagement requirements; delays from unresolved consultations can push projects past planned timelines. Political backing can accelerate approvals, while local opposition often forces downsizing or redesign. Early stakeholder alignment de-risks schedules and capital deployment.
- Indigenous consultation: mandatory under IAA 2019
- Opposition risk: can delay projects months–years
- Early alignment: reduces capital plan volatility
EPR expands feedstock but raises compliance; USMCA ~US$1.5T, duties 10-50%
Canada’s EPR/circular roadmaps (rolled out 2023–24) boost feedstock access for Cascades but raise compliance costs. USMCA stabilizes a ~US$1.5T trilateral market; anti‑dumping duties (10–50%) can quickly hit competitiveness. IRA’s US$369B and Canadian clean‑tech funds lower capex payback for mill upgrades. Municipal procurement often mandates 100% recycled fiber; IAA 2019 Indigenous consultation can delay projects months–years.
| Metric | Value |
|---|---|
| EPR rollout | 2023–24 |
| USMCA market | ~US$1.5T |
| IRA funding | US$369B |
| Anti‑dumping | 10–50% |
| Municipal req. | 100% recycled |
| IAA delays | months–years |
What is included in the product
 Detailed Word Document
Explores how Political, Economic, Social, Technological, Environmental and Legal forces uniquely affect the Cascades, with each category expanded into data-backed subpoints and examples specific to the business and region. Designed for executives, investors and consultants, it reflects current market and regulatory dynamics, offers forward-looking insights for scenario planning, and is formatted for direct use in plans or decks.

 Customizable Excel Spreadsheet
A clean, summarized Cascades PESTLE analysis that’s visually segmented by category for quick interpretation, easily shared across teams and dropped into presentations to streamline risk discussions and strategic planning.
Economic factors

Input cost volatility (fiber, energy, chemicals)
Recovered fiber prices for Cascades swing with municipal collection rates and export demand from competing mills, creating pronounced input volatility that directly affects raw material expenses. Energy and chemical costs materially influence unit economics in pulp and paper operations, often representing a significant portion of manufacturing cost. Hedging and long-term supply contracts can stabilize margins but may cap upside during down cycles.
Macroeconomic cycles and end-market demand
Industrial and food-packaging demand is cyclical and drove packaging volumes down in 2023–24, while tissue remained defensive; Cascades reported CAD 5.2B in 2024 revenue with tissue accounting for roughly 30% of sales. Slowdowns compress pricing and mix, pressuring margins, whereas recoveries lift demand for premium sustainable SKUs. Cascades can balance exposure by shifting sales toward resilient customer segments such as retail and healthcare.

FX movements (CAD/USD/EUR)
Revenues and costs for Cascades span CAD, USD and EUR, creating translation and transaction risk as USD/CAD averaged about 0.75 and EUR/CAD about 0.82 in 2024, exposing reported margins to FX swings.

Interest rates and capital intensity
Paper and packaging assets require significant maintenance and modernization capex, often reaching hundreds of millions per mill; higher policy rates (Bank of Canada peaked near 5% in 2023–24) lift financing costs and corporate hurdle rates, delaying upgrades. Timing projects to rate cycles and tapping green financing or sustainability-linked loans can materially improve project IRRs and payback.
- Capex intensity: hundreds of millions per mill
- Policy rate context: BoC ~5% peak (2023–24)
- Mitigants: rate timing, green loans/bonds, SLLs
Logistics and freight dynamics
Transport costs and reliability shape Cascades delivered pricing and service: global container rates eased to roughly US$1,200–1,800/FEU in 2024 versus 2021 peaks, but trucking tightness persists. North American driver shortage of about 80,000 drivers, fuel-price volatility and episodic port congestion increase disruption risk. Network optimization and near-customer converting lower miles, emissions and exposure to freight shocks.
- Container rates 2024 ~US$1.5k/FEU
- Driver shortage ~80,000 NA
- Near-customer converting cuts miles/emissions
EPR expands feedstock but raises compliance; USMCA ~US$1.5T, duties 10-50%
Recovered-fiber price swings and export demand drive input volatility, while energy/chemical costs materially affect unit economics; Cascades reported CAD 5.2B revenue in 2024 with tissue ~30% of sales. FX exposure (USD/CAD ~0.75, EUR/CAD ~0.82 in 2024) and BoC policy ~5% (2023–24) compress margins; capex per mill often reaches hundreds of millions. Transport costs eased to ~US$1.5k/FEU in 2024 but NA driver shortage (~80,000) raises service risk.
| Metric | 2024 |
|---|---|
| Revenue | CAD 5.2B |
| Tissue share | ~30% |
| USD/CAD avg | ~0.75 |
| EUR/CAD avg | ~0.82 |
| BoC peak rate | ~5% |
| Container rate | ~US$1.5k/FEU |
| NA driver shortage | ~80,000 |
| Capex per mill | hundreds of millions |
Full Version Awaits
Cascades PESTLE Analysis
The Cascades PESTLE Analysis preview shown here is the exact document you’ll receive after purchase—fully formatted, professionally structured, and ready to use. This is the real file with complete political, economic, social, technological, legal and environmental analysis; no placeholders or teasers. After payment you’ll instantly download the same finished document displayed here.

Make Smarter Strategic Decisions with a Complete PESTEL View
Unlock how political shifts, economic cycles, and sustainability trends are shaping Cascades' strategic path in our concise PESTLE snapshot—perfect for investors and strategists. See the risks and growth levers at a glance, then purchase the full PESTLE for detailed, actionable analysis you can implement immediately.
Political factors
Recycling and circular-economy policies
Canada and many provinces have adopted circular-economy roadmaps and extended producer responsibility programs (rolled out in BC, ON and QC in 2023–24) that align with Cascades’ recycled-fiber model and target higher collection and reuse by 2030. Tightening rules can expand feedstock access through improved collection rates and curbside capture. Compliance reporting and third-party auditing increase administrative costs and raise exposure to policy shifts affecting margins.
Trade policy and tariffs on paper products
USMCA stabilizes cross‑border sales for Cascades within a trilateral market worth over US$1.5 trillion annually, easing tariff uncertainty; however, anti‑dumping duties in pulp, paper or packaging—often in the 10–50% range—can rapidly alter price competitiveness. Any escalation with the U.S. or EU could compress margins or shift volumes by double‑digit percentages. Cascades must hedge via geographic diversification and broader product mix to protect EBITDA.
Government incentives for green manufacturing
Government incentives — notably the US Inflation Reduction Act’s $369 billion energy and climate package and Canada’s expanding federal clean‑tech funds — provide grants, tax credits and low‑interest loans that accelerate mill upgrades. Accessing these incentives shortens payback periods for CHP, electrification and heat‑recovery projects by improving upfront economics and IRR. Program design and eligibility criteria shape project sequencing and final ROI, determining which assets are prioritized.
Municipal and provincial procurement dynamics
Municipal and provincial procurement favors recycled, low-carbon packaging and tissue, with many Canadian and US municipalities requiring 100% recycled fiber for tissue and paper towels. Winning municipal contracts often secures 3–5 year volumes but requires meeting evolving sustainability specs and third-party certifications. Political budget cycles and tender timelines create timing and pricing uncertainty.
- Procurement tilt: recycled/low-carbon required
- Contract length: typically 3–5 years
- Specs: rising certification and recycled-content thresholds
- Risk: annual budgets and tenders cause timing/pricing volatility
Environmental permitting and siting politics
Mill expansions face local permitting, Indigenous consultation under the federal Impact Assessment Act (2019), and heightened community engagement requirements; delays from unresolved consultations can push projects past planned timelines. Political backing can accelerate approvals, while local opposition often forces downsizing or redesign. Early stakeholder alignment de-risks schedules and capital deployment.
- Indigenous consultation: mandatory under IAA 2019
- Opposition risk: can delay projects months–years
- Early alignment: reduces capital plan volatility
EPR expands feedstock but raises compliance; USMCA ~US$1.5T, duties 10-50%
Canada’s EPR/circular roadmaps (rolled out 2023–24) boost feedstock access for Cascades but raise compliance costs. USMCA stabilizes a ~US$1.5T trilateral market; anti‑dumping duties (10–50%) can quickly hit competitiveness. IRA’s US$369B and Canadian clean‑tech funds lower capex payback for mill upgrades. Municipal procurement often mandates 100% recycled fiber; IAA 2019 Indigenous consultation can delay projects months–years.
| Metric | Value |
|---|---|
| EPR rollout | 2023–24 |
| USMCA market | ~US$1.5T |
| IRA funding | US$369B |
| Anti‑dumping | 10–50% |
| Municipal req. | 100% recycled |
| IAA delays | months–years |
What is included in the product
Detailed Word Document
Explores how Political, Economic, Social, Technological, Environmental and Legal forces uniquely affect the Cascades, with each category expanded into data-backed subpoints and examples specific to the business and region. Designed for executives, investors and consultants, it reflects current market and regulatory dynamics, offers forward-looking insights for scenario planning, and is formatted for direct use in plans or decks.
Customizable Excel Spreadsheet
A clean, summarized Cascades PESTLE analysis that’s visually segmented by category for quick interpretation, easily shared across teams and dropped into presentations to streamline risk discussions and strategic planning.
Economic factors
Input cost volatility (fiber, energy, chemicals)
Recovered fiber prices for Cascades swing with municipal collection rates and export demand from competing mills, creating pronounced input volatility that directly affects raw material expenses. Energy and chemical costs materially influence unit economics in pulp and paper operations, often representing a significant portion of manufacturing cost. Hedging and long-term supply contracts can stabilize margins but may cap upside during down cycles.
Macroeconomic cycles and end-market demand
Industrial and food-packaging demand is cyclical and drove packaging volumes down in 2023–24, while tissue remained defensive; Cascades reported CAD 5.2B in 2024 revenue with tissue accounting for roughly 30% of sales. Slowdowns compress pricing and mix, pressuring margins, whereas recoveries lift demand for premium sustainable SKUs. Cascades can balance exposure by shifting sales toward resilient customer segments such as retail and healthcare.
FX movements (CAD/USD/EUR)
Revenues and costs for Cascades span CAD, USD and EUR, creating translation and transaction risk as USD/CAD averaged about 0.75 and EUR/CAD about 0.82 in 2024, exposing reported margins to FX swings.
Interest rates and capital intensity
Paper and packaging assets require significant maintenance and modernization capex, often reaching hundreds of millions per mill; higher policy rates (Bank of Canada peaked near 5% in 2023–24) lift financing costs and corporate hurdle rates, delaying upgrades. Timing projects to rate cycles and tapping green financing or sustainability-linked loans can materially improve project IRRs and payback.
- Capex intensity: hundreds of millions per mill
- Policy rate context: BoC ~5% peak (2023–24)
- Mitigants: rate timing, green loans/bonds, SLLs
Logistics and freight dynamics
Transport costs and reliability shape Cascades delivered pricing and service: global container rates eased to roughly US$1,200–1,800/FEU in 2024 versus 2021 peaks, but trucking tightness persists. North American driver shortage of about 80,000 drivers, fuel-price volatility and episodic port congestion increase disruption risk. Network optimization and near-customer converting lower miles, emissions and exposure to freight shocks.
- Container rates 2024 ~US$1.5k/FEU
- Driver shortage ~80,000 NA
- Near-customer converting cuts miles/emissions
EPR expands feedstock but raises compliance; USMCA ~US$1.5T, duties 10-50%
Recovered-fiber price swings and export demand drive input volatility, while energy/chemical costs materially affect unit economics; Cascades reported CAD 5.2B revenue in 2024 with tissue ~30% of sales. FX exposure (USD/CAD ~0.75, EUR/CAD ~0.82 in 2024) and BoC policy ~5% (2023–24) compress margins; capex per mill often reaches hundreds of millions. Transport costs eased to ~US$1.5k/FEU in 2024 but NA driver shortage (~80,000) raises service risk.
| Metric | 2024 |
|---|---|
| Revenue | CAD 5.2B |
| Tissue share | ~30% |
| USD/CAD avg | ~0.75 |
| EUR/CAD avg | ~0.82 |
| BoC peak rate | ~5% |
| Container rate | ~US$1.5k/FEU |
| NA driver shortage | ~80,000 |
| Capex per mill | hundreds of millions |
Full Version Awaits
Cascades PESTLE Analysis
The Cascades PESTLE Analysis preview shown here is the exact document you’ll receive after purchase—fully formatted, professionally structured, and ready to use. This is the real file with complete political, economic, social, technological, legal and environmental analysis; no placeholders or teasers. After payment you’ll instantly download the same finished document displayed here.
Original: $10.00
-65%$10.00
$3.50Description
Make Smarter Strategic Decisions with a Complete PESTEL View
Unlock how political shifts, economic cycles, and sustainability trends are shaping Cascades' strategic path in our concise PESTLE snapshot—perfect for investors and strategists. See the risks and growth levers at a glance, then purchase the full PESTLE for detailed, actionable analysis you can implement immediately.
Political factors
Recycling and circular-economy policies
Canada and many provinces have adopted circular-economy roadmaps and extended producer responsibility programs (rolled out in BC, ON and QC in 2023–24) that align with Cascades’ recycled-fiber model and target higher collection and reuse by 2030. Tightening rules can expand feedstock access through improved collection rates and curbside capture. Compliance reporting and third-party auditing increase administrative costs and raise exposure to policy shifts affecting margins.
Trade policy and tariffs on paper products
USMCA stabilizes cross‑border sales for Cascades within a trilateral market worth over US$1.5 trillion annually, easing tariff uncertainty; however, anti‑dumping duties in pulp, paper or packaging—often in the 10–50% range—can rapidly alter price competitiveness. Any escalation with the U.S. or EU could compress margins or shift volumes by double‑digit percentages. Cascades must hedge via geographic diversification and broader product mix to protect EBITDA.
Government incentives for green manufacturing
Government incentives — notably the US Inflation Reduction Act’s $369 billion energy and climate package and Canada’s expanding federal clean‑tech funds — provide grants, tax credits and low‑interest loans that accelerate mill upgrades. Accessing these incentives shortens payback periods for CHP, electrification and heat‑recovery projects by improving upfront economics and IRR. Program design and eligibility criteria shape project sequencing and final ROI, determining which assets are prioritized.
Municipal and provincial procurement dynamics
Municipal and provincial procurement favors recycled, low-carbon packaging and tissue, with many Canadian and US municipalities requiring 100% recycled fiber for tissue and paper towels. Winning municipal contracts often secures 3–5 year volumes but requires meeting evolving sustainability specs and third-party certifications. Political budget cycles and tender timelines create timing and pricing uncertainty.
- Procurement tilt: recycled/low-carbon required
- Contract length: typically 3–5 years
- Specs: rising certification and recycled-content thresholds
- Risk: annual budgets and tenders cause timing/pricing volatility
Environmental permitting and siting politics
Mill expansions face local permitting, Indigenous consultation under the federal Impact Assessment Act (2019), and heightened community engagement requirements; delays from unresolved consultations can push projects past planned timelines. Political backing can accelerate approvals, while local opposition often forces downsizing or redesign. Early stakeholder alignment de-risks schedules and capital deployment.
- Indigenous consultation: mandatory under IAA 2019
- Opposition risk: can delay projects months–years
- Early alignment: reduces capital plan volatility
EPR expands feedstock but raises compliance; USMCA ~US$1.5T, duties 10-50%
Canada’s EPR/circular roadmaps (rolled out 2023–24) boost feedstock access for Cascades but raise compliance costs. USMCA stabilizes a ~US$1.5T trilateral market; anti‑dumping duties (10–50%) can quickly hit competitiveness. IRA’s US$369B and Canadian clean‑tech funds lower capex payback for mill upgrades. Municipal procurement often mandates 100% recycled fiber; IAA 2019 Indigenous consultation can delay projects months–years.
| Metric | Value |
|---|---|
| EPR rollout | 2023–24 |
| USMCA market | ~US$1.5T |
| IRA funding | US$369B |
| Anti‑dumping | 10–50% |
| Municipal req. | 100% recycled |
| IAA delays | months–years |
What is included in the product
Detailed Word Document
Explores how Political, Economic, Social, Technological, Environmental and Legal forces uniquely affect the Cascades, with each category expanded into data-backed subpoints and examples specific to the business and region. Designed for executives, investors and consultants, it reflects current market and regulatory dynamics, offers forward-looking insights for scenario planning, and is formatted for direct use in plans or decks.
Customizable Excel Spreadsheet
A clean, summarized Cascades PESTLE analysis that’s visually segmented by category for quick interpretation, easily shared across teams and dropped into presentations to streamline risk discussions and strategic planning.
Economic factors
Input cost volatility (fiber, energy, chemicals)
Recovered fiber prices for Cascades swing with municipal collection rates and export demand from competing mills, creating pronounced input volatility that directly affects raw material expenses. Energy and chemical costs materially influence unit economics in pulp and paper operations, often representing a significant portion of manufacturing cost. Hedging and long-term supply contracts can stabilize margins but may cap upside during down cycles.
Macroeconomic cycles and end-market demand
Industrial and food-packaging demand is cyclical and drove packaging volumes down in 2023–24, while tissue remained defensive; Cascades reported CAD 5.2B in 2024 revenue with tissue accounting for roughly 30% of sales. Slowdowns compress pricing and mix, pressuring margins, whereas recoveries lift demand for premium sustainable SKUs. Cascades can balance exposure by shifting sales toward resilient customer segments such as retail and healthcare.
FX movements (CAD/USD/EUR)
Revenues and costs for Cascades span CAD, USD and EUR, creating translation and transaction risk as USD/CAD averaged about 0.75 and EUR/CAD about 0.82 in 2024, exposing reported margins to FX swings.
Interest rates and capital intensity
Paper and packaging assets require significant maintenance and modernization capex, often reaching hundreds of millions per mill; higher policy rates (Bank of Canada peaked near 5% in 2023–24) lift financing costs and corporate hurdle rates, delaying upgrades. Timing projects to rate cycles and tapping green financing or sustainability-linked loans can materially improve project IRRs and payback.
- Capex intensity: hundreds of millions per mill
- Policy rate context: BoC ~5% peak (2023–24)
- Mitigants: rate timing, green loans/bonds, SLLs
Logistics and freight dynamics
Transport costs and reliability shape Cascades delivered pricing and service: global container rates eased to roughly US$1,200–1,800/FEU in 2024 versus 2021 peaks, but trucking tightness persists. North American driver shortage of about 80,000 drivers, fuel-price volatility and episodic port congestion increase disruption risk. Network optimization and near-customer converting lower miles, emissions and exposure to freight shocks.
- Container rates 2024 ~US$1.5k/FEU
- Driver shortage ~80,000 NA
- Near-customer converting cuts miles/emissions
EPR expands feedstock but raises compliance; USMCA ~US$1.5T, duties 10-50%
Recovered-fiber price swings and export demand drive input volatility, while energy/chemical costs materially affect unit economics; Cascades reported CAD 5.2B revenue in 2024 with tissue ~30% of sales. FX exposure (USD/CAD ~0.75, EUR/CAD ~0.82 in 2024) and BoC policy ~5% (2023–24) compress margins; capex per mill often reaches hundreds of millions. Transport costs eased to ~US$1.5k/FEU in 2024 but NA driver shortage (~80,000) raises service risk.
| Metric | 2024 |
|---|---|
| Revenue | CAD 5.2B |
| Tissue share | ~30% |
| USD/CAD avg | ~0.75 |
| EUR/CAD avg | ~0.82 |
| BoC peak rate | ~5% |
| Container rate | ~US$1.5k/FEU |
| NA driver shortage | ~80,000 |
| Capex per mill | hundreds of millions |
Full Version Awaits
Cascades PESTLE Analysis
The Cascades PESTLE Analysis preview shown here is the exact document you’ll receive after purchase—fully formatted, professionally structured, and ready to use. This is the real file with complete political, economic, social, technological, legal and environmental analysis; no placeholders or teasers. After payment you’ll instantly download the same finished document displayed here.











