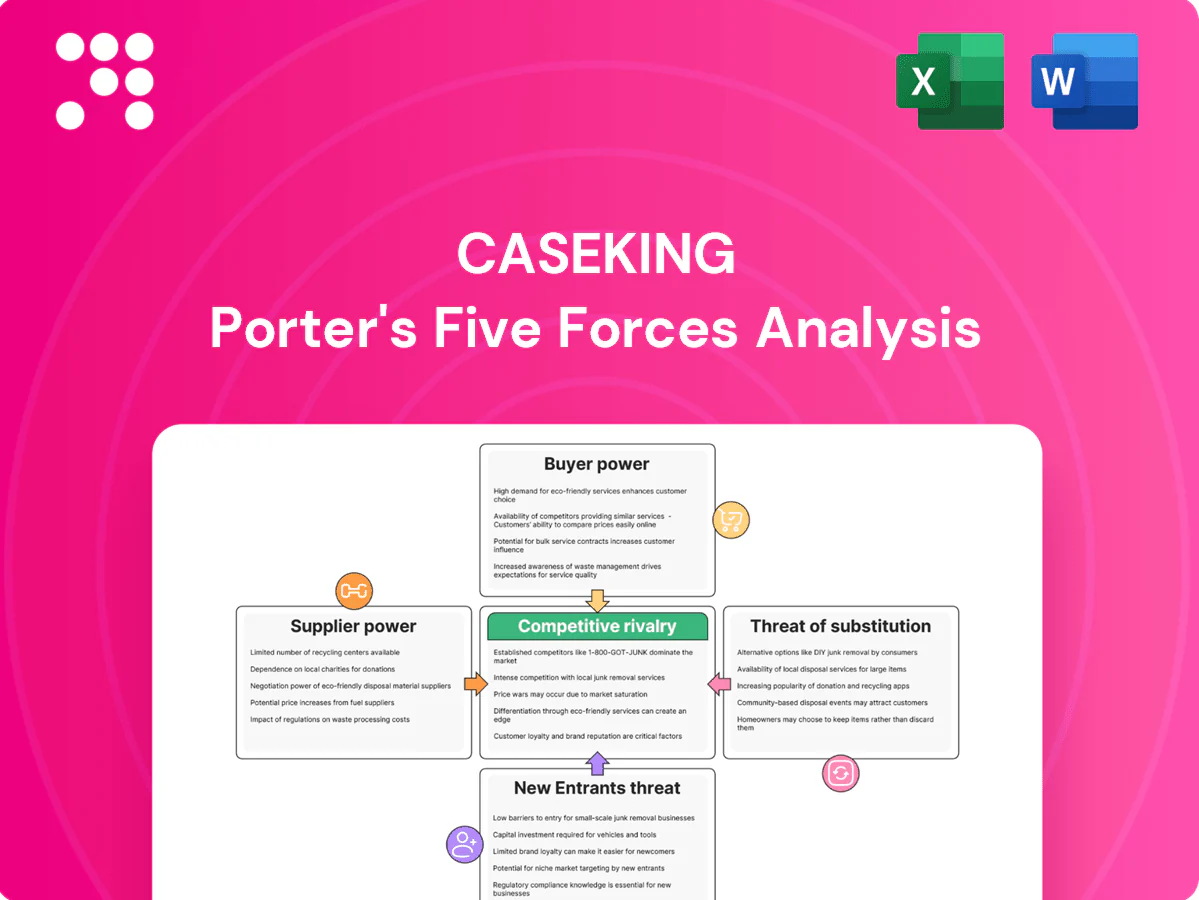
Caseking Porter's Five Forces Analysis

From Overview to Strategy Blueprint
Caseking’s Porter's Five Forces snapshot highlights competitive intensity, supplier and buyer leverage, substitute threats, and barriers to entry shaping its niche in PC hardware retail. The brief identifies key pressures on margins and growth but stops short of force-by-force ratings and quantified implications. Unlock the full Porter's Five Forces Analysis to explore Caseking’s competitive dynamics, market pressures, and strategic advantages in detail.
Suppliers Bargaining Power

Concentrated OEM brands
GPU, CPU and premium peripheral categories are highly concentrated: NVIDIA commanded roughly 80% of the discrete GPU market in 2024 while Intel held about 65% of desktop CPU share in 2024, and Corsair and Razer lead the premium peripherals segment (combined market-leading positions). This concentration gives suppliers strong leverage on pricing, allocations and launch timing; Caseking must adhere to branding, MAP and allocation rules to access marquee inventory, and dependence on hero SKUs increases exposure to supplier policies.
Allocation and scarcity cycles
Hardware launches and chip shortages create tight allocation windows that shift bargaining power upstream, with lead times swinging from pre-pandemic averages around 4–6 weeks to peaks exceeding 20 weeks in scarcity periods. Suppliers routinely prioritize larger OEMs and key regions, directly lowering Caseking’s fill rates and forcing acceptance of bundle terms and mixed-case allocations. Limited allocations depress margin control and tie capital to unpredictable stock, amplifying cash-flow strain.

Switching and differentiation limits
Many core PC components are not easily substitutable due to platform lock-in and ecosystem fit, especially given the x86 CPU duopoly of Intel and AMD controlling virtually all desktop CPU shipments in 2024. Switching suppliers risks warranty fragmentation and incompatibility for customers, reducing Caseking’s negotiating flexibility on CPUs, motherboards and GPUs. Logistics requalification and testing add hidden switching costs and lead-time delays that further entrench suppliers.

House brands and bundling offsets
Private-label accessories and curated bundles at Caseking dilute supplier power by creating lower-cost alternatives and improving negotiated margins, while exclusive SKUs and co-branded runs strengthen retailer bargaining through differentiation.
Core silicon categories such as CPUs and GPUs remain supplier-dominated and hard to replace, so the offset is partial and varies by category.
- Private-label + bundles: alternative sourcing
- Exclusive SKUs: higher margins, better leverage
- Silicon: persistent supplier dominance
- Offset: category-dependent, partial
Global cost and FX exposure
Hardware supply chains spanning Asia, the EU and the US make Caseking’s landed costs highly sensitive to freight, tariffs and FX, and in 2024 suppliers continued to push cost pass-throughs to retailers.
Caseking’s bargaining power weakens when currency swings compress margins; hedging and multi-sourcing in 2024 mitigated risk only partially due to concentrated component sourcing and freight volatility.
- 2024: suppliers increased pass-throughs to retailers
- FX swings reduced retailer margins
- Hedging and multi-sourcing provided limited mitigation
Supplier concentration (GPU ~80%, CPU ~65%) pushed lead times past 20 weeks
High supplier concentration (NVIDIA ~80% discrete GPU, Intel ~65% desktop CPU in 2024) gives suppliers strong pricing and allocation leverage. Scarcity-driven lead times spiked from 4–6 weeks pre-pandemic to peaks >20 weeks, lowering fill rates and compressing margins. Caseking’s private-labels and exclusives partially offset power but core silicon categories remain supplier-dominated.
| Metric | 2024 Value |
|---|---|
| Discrete GPU share (NVIDIA) | ~80% |
| Desktop CPU share (Intel) | ~65% |
| Lead time peak | >20 weeks |
What is included in the product
 Detailed Word Document
Tailored Porter's Five Forces analysis for Caseking that uncovers key drivers of competition, supplier and buyer influence, barriers to entry, substitutes and disruptive threats, with strategic commentary to assess pricing power and market risks.

 Customizable Excel Spreadsheet
Compact Caseking Porter's Five Forces one-sheet that highlights key competitive pressures and relief strategies—ideal for quick decisions, slide-ready, and easily customizable to reflect changing market dynamics.
Customers Bargaining Power

Highly informed shoppers
Gamers and PC enthusiasts aggressively compare specs, prices and reviews across sites, shifting leverage to buyers on commodity SKUs. BrightLocal 2024 finds 93% of consumers read online reviews, while Baymard Institute reported a 69.8% global cart abandonment rate in 2023, underscoring price sensitivity and negotiation via carts. Content creators and forums further amplify transparency, pressuring margins on standard components.
Low switching costs online
Marketplace listings and rival e-tailers are a click away, and with 76% of EU internet users shopping online in 2024 (Eurostat 2024) customers easily compare alternatives. Minimal friction to switch erodes pricing power and loyalty, reflected in a ~70% global cart abandonment rate where shipping cost/speed is the top factor. Fast shipping and lenient returns are decisive tie-breakers; Caseking must match or exceed these service benchmarks to retain baskets.

Large orders and B2B segments
System integrators, esports orgs and SMEs place volume orders and seek discounts; with the global esports audience around 532 million in 2024, demand from orgs is sizable and concentrated, enabling better terms and custom SLAs. This buying power can compress margins but provides predictable throughput and inventory turnover, and negotiated B2B deals establish pricing corridors that influence Caseking’s retail price points.

Promotion-driven behavior
Promotion-driven behavior: flash sales, launch events and seasonal promos anchor customer expectations at Caseking, causing buyers to delay purchases and reinforcing recurring discount cycles; basket attachments like peripherals are highly promo-sensitive, pressuring average selling price and margin. Caseking must enforce a disciplined promo cadence and threshold rules to protect gross margin and CLV.
- Flash sales anchor expectations
- Buyers delay purchases awaiting deals
- Basket items are promo-sensitive
- Need disciplined promo cadence to protect margin
Service and warranty expectations
- Fast RMA: reduces returns
- DOA replacement: limits negative reviews
- Expert support: increases perceived value
Shoppers favor fast shipping and lenient returns as reviews and prices drive purchase decisions
Buyers compare specs, prices and reviews, shifting leverage on commodity SKUs (BrightLocal 2024: 93% read reviews; Baymard 2023 cart abandonment 69.8%).
Low switching costs (EU online shoppers 76% in 2024) make fast shipping and lenient returns decisive.
Volume buyers (esports audience ~532M, 2024) negotiate discounts; electronics online returns 20–25% (2024).
| Metric | Value |
|---|---|
| Read reviews | 93% (BrightLocal 2024) |
| Cart abandonment | 69.8% (Baymard 2023) |
| EU online shoppers | 76% (Eurostat 2024) |
| Esports audience | 532M (2024) |
| Electronics returns | 20–25% (2024) |
Full Version Awaits
Caseking Porter's Five Forces Analysis
This preview shows the exact Caseking Porter's Five Forces Analysis you'll receive immediately after purchase—no placeholders or mockups. The document displayed is the full, professionally formatted file ready for download and use the moment you buy. You're looking at the final deliverable; purchase grants instant access to this same complete analysis.

From Overview to Strategy Blueprint
Caseking’s Porter's Five Forces snapshot highlights competitive intensity, supplier and buyer leverage, substitute threats, and barriers to entry shaping its niche in PC hardware retail. The brief identifies key pressures on margins and growth but stops short of force-by-force ratings and quantified implications. Unlock the full Porter's Five Forces Analysis to explore Caseking’s competitive dynamics, market pressures, and strategic advantages in detail.
Suppliers Bargaining Power
Concentrated OEM brands
GPU, CPU and premium peripheral categories are highly concentrated: NVIDIA commanded roughly 80% of the discrete GPU market in 2024 while Intel held about 65% of desktop CPU share in 2024, and Corsair and Razer lead the premium peripherals segment (combined market-leading positions). This concentration gives suppliers strong leverage on pricing, allocations and launch timing; Caseking must adhere to branding, MAP and allocation rules to access marquee inventory, and dependence on hero SKUs increases exposure to supplier policies.
Allocation and scarcity cycles
Hardware launches and chip shortages create tight allocation windows that shift bargaining power upstream, with lead times swinging from pre-pandemic averages around 4–6 weeks to peaks exceeding 20 weeks in scarcity periods. Suppliers routinely prioritize larger OEMs and key regions, directly lowering Caseking’s fill rates and forcing acceptance of bundle terms and mixed-case allocations. Limited allocations depress margin control and tie capital to unpredictable stock, amplifying cash-flow strain.
Switching and differentiation limits
Many core PC components are not easily substitutable due to platform lock-in and ecosystem fit, especially given the x86 CPU duopoly of Intel and AMD controlling virtually all desktop CPU shipments in 2024. Switching suppliers risks warranty fragmentation and incompatibility for customers, reducing Caseking’s negotiating flexibility on CPUs, motherboards and GPUs. Logistics requalification and testing add hidden switching costs and lead-time delays that further entrench suppliers.
House brands and bundling offsets
Private-label accessories and curated bundles at Caseking dilute supplier power by creating lower-cost alternatives and improving negotiated margins, while exclusive SKUs and co-branded runs strengthen retailer bargaining through differentiation.
Core silicon categories such as CPUs and GPUs remain supplier-dominated and hard to replace, so the offset is partial and varies by category.
- Private-label + bundles: alternative sourcing
- Exclusive SKUs: higher margins, better leverage
- Silicon: persistent supplier dominance
- Offset: category-dependent, partial
Global cost and FX exposure
Hardware supply chains spanning Asia, the EU and the US make Caseking’s landed costs highly sensitive to freight, tariffs and FX, and in 2024 suppliers continued to push cost pass-throughs to retailers.
Caseking’s bargaining power weakens when currency swings compress margins; hedging and multi-sourcing in 2024 mitigated risk only partially due to concentrated component sourcing and freight volatility.
- 2024: suppliers increased pass-throughs to retailers
- FX swings reduced retailer margins
- Hedging and multi-sourcing provided limited mitigation
Supplier concentration (GPU ~80%, CPU ~65%) pushed lead times past 20 weeks
High supplier concentration (NVIDIA ~80% discrete GPU, Intel ~65% desktop CPU in 2024) gives suppliers strong pricing and allocation leverage. Scarcity-driven lead times spiked from 4–6 weeks pre-pandemic to peaks >20 weeks, lowering fill rates and compressing margins. Caseking’s private-labels and exclusives partially offset power but core silicon categories remain supplier-dominated.
| Metric | 2024 Value |
|---|---|
| Discrete GPU share (NVIDIA) | ~80% |
| Desktop CPU share (Intel) | ~65% |
| Lead time peak | >20 weeks |
What is included in the product
Detailed Word Document
Tailored Porter's Five Forces analysis for Caseking that uncovers key drivers of competition, supplier and buyer influence, barriers to entry, substitutes and disruptive threats, with strategic commentary to assess pricing power and market risks.
Customizable Excel Spreadsheet
Compact Caseking Porter's Five Forces one-sheet that highlights key competitive pressures and relief strategies—ideal for quick decisions, slide-ready, and easily customizable to reflect changing market dynamics.
Customers Bargaining Power
Highly informed shoppers
Gamers and PC enthusiasts aggressively compare specs, prices and reviews across sites, shifting leverage to buyers on commodity SKUs. BrightLocal 2024 finds 93% of consumers read online reviews, while Baymard Institute reported a 69.8% global cart abandonment rate in 2023, underscoring price sensitivity and negotiation via carts. Content creators and forums further amplify transparency, pressuring margins on standard components.
Low switching costs online
Marketplace listings and rival e-tailers are a click away, and with 76% of EU internet users shopping online in 2024 (Eurostat 2024) customers easily compare alternatives. Minimal friction to switch erodes pricing power and loyalty, reflected in a ~70% global cart abandonment rate where shipping cost/speed is the top factor. Fast shipping and lenient returns are decisive tie-breakers; Caseking must match or exceed these service benchmarks to retain baskets.
Large orders and B2B segments
System integrators, esports orgs and SMEs place volume orders and seek discounts; with the global esports audience around 532 million in 2024, demand from orgs is sizable and concentrated, enabling better terms and custom SLAs. This buying power can compress margins but provides predictable throughput and inventory turnover, and negotiated B2B deals establish pricing corridors that influence Caseking’s retail price points.
Promotion-driven behavior
Promotion-driven behavior: flash sales, launch events and seasonal promos anchor customer expectations at Caseking, causing buyers to delay purchases and reinforcing recurring discount cycles; basket attachments like peripherals are highly promo-sensitive, pressuring average selling price and margin. Caseking must enforce a disciplined promo cadence and threshold rules to protect gross margin and CLV.
- Flash sales anchor expectations
- Buyers delay purchases awaiting deals
- Basket items are promo-sensitive
- Need disciplined promo cadence to protect margin
Service and warranty expectations
- Fast RMA: reduces returns
- DOA replacement: limits negative reviews
- Expert support: increases perceived value
Shoppers favor fast shipping and lenient returns as reviews and prices drive purchase decisions
Buyers compare specs, prices and reviews, shifting leverage on commodity SKUs (BrightLocal 2024: 93% read reviews; Baymard 2023 cart abandonment 69.8%).
Low switching costs (EU online shoppers 76% in 2024) make fast shipping and lenient returns decisive.
Volume buyers (esports audience ~532M, 2024) negotiate discounts; electronics online returns 20–25% (2024).
| Metric | Value |
|---|---|
| Read reviews | 93% (BrightLocal 2024) |
| Cart abandonment | 69.8% (Baymard 2023) |
| EU online shoppers | 76% (Eurostat 2024) |
| Esports audience | 532M (2024) |
| Electronics returns | 20–25% (2024) |
Full Version Awaits
Caseking Porter's Five Forces Analysis
This preview shows the exact Caseking Porter's Five Forces Analysis you'll receive immediately after purchase—no placeholders or mockups. The document displayed is the full, professionally formatted file ready for download and use the moment you buy. You're looking at the final deliverable; purchase grants instant access to this same complete analysis.
Description
From Overview to Strategy Blueprint
Caseking’s Porter's Five Forces snapshot highlights competitive intensity, supplier and buyer leverage, substitute threats, and barriers to entry shaping its niche in PC hardware retail. The brief identifies key pressures on margins and growth but stops short of force-by-force ratings and quantified implications. Unlock the full Porter's Five Forces Analysis to explore Caseking’s competitive dynamics, market pressures, and strategic advantages in detail.
Suppliers Bargaining Power
Concentrated OEM brands
GPU, CPU and premium peripheral categories are highly concentrated: NVIDIA commanded roughly 80% of the discrete GPU market in 2024 while Intel held about 65% of desktop CPU share in 2024, and Corsair and Razer lead the premium peripherals segment (combined market-leading positions). This concentration gives suppliers strong leverage on pricing, allocations and launch timing; Caseking must adhere to branding, MAP and allocation rules to access marquee inventory, and dependence on hero SKUs increases exposure to supplier policies.
Allocation and scarcity cycles
Hardware launches and chip shortages create tight allocation windows that shift bargaining power upstream, with lead times swinging from pre-pandemic averages around 4–6 weeks to peaks exceeding 20 weeks in scarcity periods. Suppliers routinely prioritize larger OEMs and key regions, directly lowering Caseking’s fill rates and forcing acceptance of bundle terms and mixed-case allocations. Limited allocations depress margin control and tie capital to unpredictable stock, amplifying cash-flow strain.
Switching and differentiation limits
Many core PC components are not easily substitutable due to platform lock-in and ecosystem fit, especially given the x86 CPU duopoly of Intel and AMD controlling virtually all desktop CPU shipments in 2024. Switching suppliers risks warranty fragmentation and incompatibility for customers, reducing Caseking’s negotiating flexibility on CPUs, motherboards and GPUs. Logistics requalification and testing add hidden switching costs and lead-time delays that further entrench suppliers.
House brands and bundling offsets
Private-label accessories and curated bundles at Caseking dilute supplier power by creating lower-cost alternatives and improving negotiated margins, while exclusive SKUs and co-branded runs strengthen retailer bargaining through differentiation.
Core silicon categories such as CPUs and GPUs remain supplier-dominated and hard to replace, so the offset is partial and varies by category.
- Private-label + bundles: alternative sourcing
- Exclusive SKUs: higher margins, better leverage
- Silicon: persistent supplier dominance
- Offset: category-dependent, partial
Global cost and FX exposure
Hardware supply chains spanning Asia, the EU and the US make Caseking’s landed costs highly sensitive to freight, tariffs and FX, and in 2024 suppliers continued to push cost pass-throughs to retailers.
Caseking’s bargaining power weakens when currency swings compress margins; hedging and multi-sourcing in 2024 mitigated risk only partially due to concentrated component sourcing and freight volatility.
- 2024: suppliers increased pass-throughs to retailers
- FX swings reduced retailer margins
- Hedging and multi-sourcing provided limited mitigation
Supplier concentration (GPU ~80%, CPU ~65%) pushed lead times past 20 weeks
High supplier concentration (NVIDIA ~80% discrete GPU, Intel ~65% desktop CPU in 2024) gives suppliers strong pricing and allocation leverage. Scarcity-driven lead times spiked from 4–6 weeks pre-pandemic to peaks >20 weeks, lowering fill rates and compressing margins. Caseking’s private-labels and exclusives partially offset power but core silicon categories remain supplier-dominated.
| Metric | 2024 Value |
|---|---|
| Discrete GPU share (NVIDIA) | ~80% |
| Desktop CPU share (Intel) | ~65% |
| Lead time peak | >20 weeks |
What is included in the product
Detailed Word Document
Tailored Porter's Five Forces analysis for Caseking that uncovers key drivers of competition, supplier and buyer influence, barriers to entry, substitutes and disruptive threats, with strategic commentary to assess pricing power and market risks.
Customizable Excel Spreadsheet
Compact Caseking Porter's Five Forces one-sheet that highlights key competitive pressures and relief strategies—ideal for quick decisions, slide-ready, and easily customizable to reflect changing market dynamics.
Customers Bargaining Power
Highly informed shoppers
Gamers and PC enthusiasts aggressively compare specs, prices and reviews across sites, shifting leverage to buyers on commodity SKUs. BrightLocal 2024 finds 93% of consumers read online reviews, while Baymard Institute reported a 69.8% global cart abandonment rate in 2023, underscoring price sensitivity and negotiation via carts. Content creators and forums further amplify transparency, pressuring margins on standard components.
Low switching costs online
Marketplace listings and rival e-tailers are a click away, and with 76% of EU internet users shopping online in 2024 (Eurostat 2024) customers easily compare alternatives. Minimal friction to switch erodes pricing power and loyalty, reflected in a ~70% global cart abandonment rate where shipping cost/speed is the top factor. Fast shipping and lenient returns are decisive tie-breakers; Caseking must match or exceed these service benchmarks to retain baskets.
Large orders and B2B segments
System integrators, esports orgs and SMEs place volume orders and seek discounts; with the global esports audience around 532 million in 2024, demand from orgs is sizable and concentrated, enabling better terms and custom SLAs. This buying power can compress margins but provides predictable throughput and inventory turnover, and negotiated B2B deals establish pricing corridors that influence Caseking’s retail price points.
Promotion-driven behavior
Promotion-driven behavior: flash sales, launch events and seasonal promos anchor customer expectations at Caseking, causing buyers to delay purchases and reinforcing recurring discount cycles; basket attachments like peripherals are highly promo-sensitive, pressuring average selling price and margin. Caseking must enforce a disciplined promo cadence and threshold rules to protect gross margin and CLV.
- Flash sales anchor expectations
- Buyers delay purchases awaiting deals
- Basket items are promo-sensitive
- Need disciplined promo cadence to protect margin
Service and warranty expectations
- Fast RMA: reduces returns
- DOA replacement: limits negative reviews
- Expert support: increases perceived value
Shoppers favor fast shipping and lenient returns as reviews and prices drive purchase decisions
Buyers compare specs, prices and reviews, shifting leverage on commodity SKUs (BrightLocal 2024: 93% read reviews; Baymard 2023 cart abandonment 69.8%).
Low switching costs (EU online shoppers 76% in 2024) make fast shipping and lenient returns decisive.
Volume buyers (esports audience ~532M, 2024) negotiate discounts; electronics online returns 20–25% (2024).
| Metric | Value |
|---|---|
| Read reviews | 93% (BrightLocal 2024) |
| Cart abandonment | 69.8% (Baymard 2023) |
| EU online shoppers | 76% (Eurostat 2024) |
| Esports audience | 532M (2024) |
| Electronics returns | 20–25% (2024) |
Full Version Awaits
Caseking Porter's Five Forces Analysis
This preview shows the exact Caseking Porter's Five Forces Analysis you'll receive immediately after purchase—no placeholders or mockups. The document displayed is the full, professionally formatted file ready for download and use the moment you buy. You're looking at the final deliverable; purchase grants instant access to this same complete analysis.











