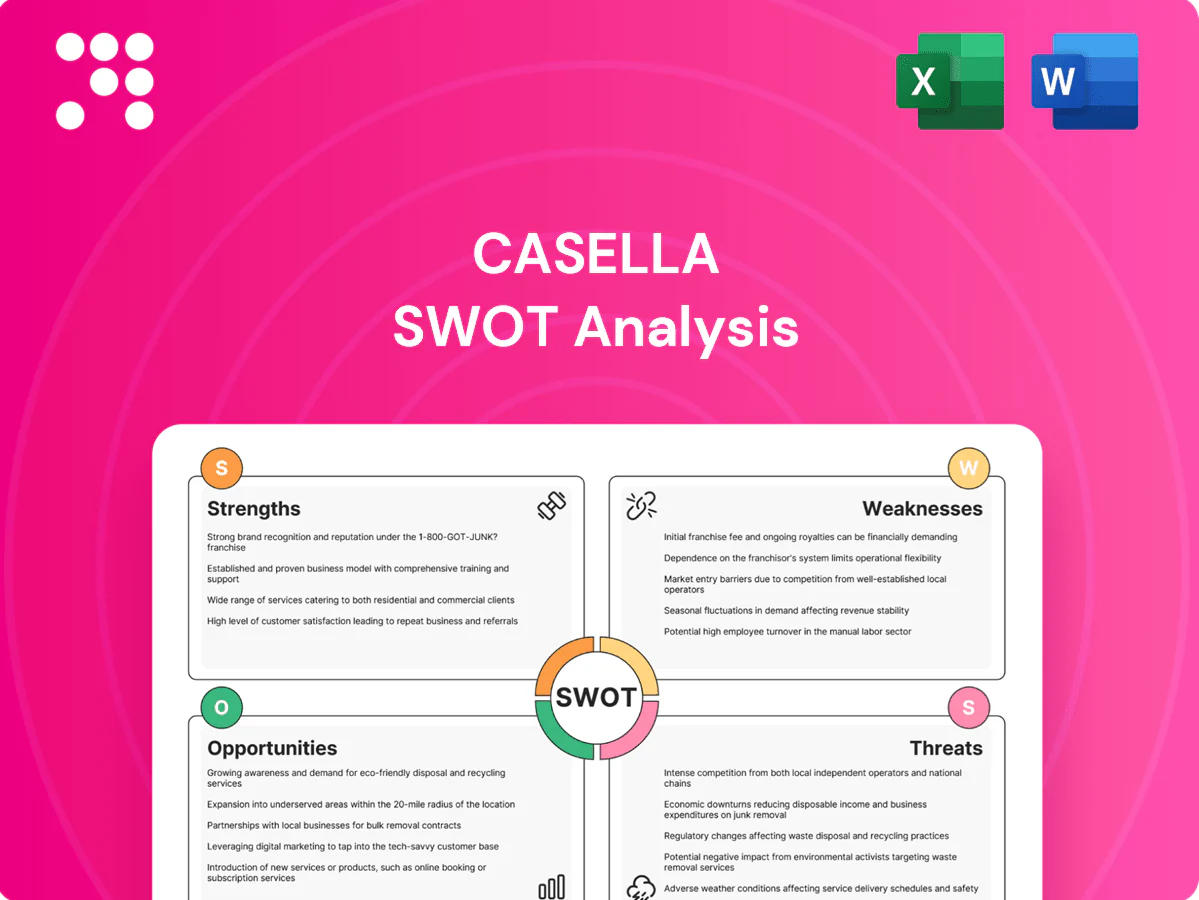
Casella SWOT Analysis

Elevate Your Analysis with the Complete SWOT Report
Casella’s strengths include a diversified regional footprint and growing sustainable waste-management services, while weaknesses stem from commodity-price sensitivity and integration risks from acquisitions. Opportunities lie in expanding organics and recycling demand; threats include regulatory shifts and intense competition. Purchase the full SWOT for a detailed, editable Word and Excel package to support strategy and investment decisions.
Strengths

Vertically integrated operations
Owning collection, transfer, landfill and recycling assets gives Casella end-to-end control of service quality and costs, supporting consistent route economics across core markets. Vertical integration internalizes disposal, improving margins and contributing to reported FY2024 revenue of $1.52 billion and adjusted EBITDA around $320 million. Reduced third-party dependence stabilizes pricing and creates a defensible competitive advantage in its Northeast footprint.
Strong Northeast footprint
Casella’s strong Northeast footprint benefits from concentrated population density—the U.S. Northeast had about 56 million residents in 2023—supporting efficient routing and higher asset utilization. Deep local knowledge and long-standing relationships improve bidding and permitting outcomes. Aging regional infrastructure and persistent disposal demand sustain stable volumes. Close proximity between stops reduces fuel use and drive-time per route.

Long-term, sticky contracts
Multi-year municipal and commercial agreements (typically 3–10 years) give Casella high recurring revenue visibility and stable route volumes. Route density compounds as contracts renew, lowering churn and improving unit economics over time. Predictable cash flows support capex and acquisition pipelines, with many contracts including CPI or fuel-adjustment clauses to protect margins.

Landfill gas-to-energy capabilities
Converting landfill gas to renewable energy creates incremental revenue through power sales and RNG pathways, strengthens Casella’s ESG profile and aligns with tightening regulations, and helps mitigate methane liabilities given methane’s 100-year GWP of ~28 (IPCC AR5). Energy projects often qualify for RINs and California LCFS credits (LCFS averages near $145/tCO2e in 2024), enabling premium pricing and long-term cash flows.
- Revenue diversification
- ESG/regulatory alignment
- Credit eligibility (RINs/LCFS)
- Emissions liability reduction
Scale and operating know-how
Decades of operational expertise at Casella drive consistent safety, regulatory compliance, and tight cost control across its Northeast-focused footprint, underpinned by data-driven routing and predictive maintenance that compress unit costs and improve fleet utilization.
- Decades of operational expertise
- Data-driven routing & maintenance
- Centralized procurement & standardization
- Difficult for smaller rivals to replicate
Vertical integration fuels route margins; FY24 revenue $1.52B
Casella’s vertical integration of collection, transfer, landfill and recycling secures route economics and drove FY2024 revenue of $1.52B and adjusted EBITDA near $320M. Dense Northeast footprint (≈56M residents in 2023) boosts route density and lowers unit costs. RNG and landfill-gas projects capture RINs/LCFS value (LCFS ≈$145/tCO2e in 2024), diversifying cash flow.
| Metric | Value |
|---|---|
| FY2024 Revenue | $1.52B |
| Adj. EBITDA | $320M |
| Northeast pop (2023) | ~56M |
What is included in the product
 Detailed Word Document
Delivers a strategic overview of Casella’s internal and external business factors, outlining strengths, weaknesses, opportunities, and threats to assess competitive position, growth drivers, operational gaps, and market risks shaping the company’s future.

 Customizable Excel Spreadsheet
Casella SWOT Analysis provides a concise, editable matrix that quickly aligns strategy, streamlines communication, and serves as an ideal snapshot for executives, reports, and stakeholder presentations.
Weaknesses

Geographic concentration
Casella operates primarily in the Northeast and upstate New York, meaning a majority (>50%) of revenue and assets are regionally concentrated, which amplifies exposure to local weather, regulatory and economic risks.
Market slowdowns or policy shifts in the region can disproportionately affect quarterly results and margins compared with more diversified national peers.
Limited geographic diversification increases the chance that localized disruptions ripple through Casella’s collection, disposal and recycling network.
Capital intensity and leverage
Capital-intensive collection fleets, landfills and MRFs require substantial ongoing capex, often necessitating hundreds of millions over multi-year cycles. Casella’s elevated debt levels can constrain strategic flexibility in downturns, while rising interest rates raise interest expense and increase project hurdle rates. Delays in ROI on infrastructure investments can strain free cash flow and limit reinvestment capacity.

Environmental liabilities
Landfills carry closure and post-closure obligations that extend for decades, with EPA rules requiring at least 30 years of post-closure care for municipal solid waste sites. Remediation needs or regulatory changes can create sudden, material expense swings and project overruns. Any environmental incident risks regulatory fines and reputational damage, so reserve adequacy must be closely managed.

Recycling commodity exposure
- Recovered paper, metals, plastics volatility — 2024–2025
- Processing spread compression impacting margins
- Pass-through lag creates earnings volatility
- Revenue mix can skew unfavorable in downturns
Smaller scale than national majors
Casella is materially smaller than national majors: Waste Management reported about $20.8B and Republic Services $13.3B in 2024 versus Casella roughly $1.7B, which weakens bargaining power with suppliers and customers. Limited scale can restrict access to lowest-cost capital and the newest route optimization and landfill technologies. National accounts often favor multi-region providers, capping Casella’s share gains outside its core Northeast territory.
- Smaller revenue base (~$1.7B) vs WM $20.8B, RSG $13.3B
- Weaker supplier/contract leverage
- Higher relative cost of capital/tech adoption
- National account preference limits expansion
50% Northeast revenue concentration and commodity swings raise 2024-25 earnings volatility
Casella’s >50% revenue concentration in the Northeast amplifies exposure to local weather, policy and economic shocks, increasing 2024–25 earnings volatility. Recycled-commodity price swings in 2024–2025 compressed processing spreads and margins while pass-throughs lagged. Capital-intensive assets and >=30-year landfill post-closure obligations plus smaller scale (~$1.7B vs WM $20.8B, RSG $13.3B) limit strategic flexibility.
| Metric | Value |
|---|---|
| Revenue (2024) | ~$1.7B |
| WM (2024) | $20.8B |
| RSG (2024) | $13.3B |
| Landfill post-closure | >=30 yrs |
Full Version Awaits
Casella SWOT Analysis
This is the actual Casella SWOT analysis document you’ll receive upon purchase—no surprises, just professional quality. The preview below is taken directly from the full report; purchase unlocks the complete, editable version. You’re viewing a live excerpt of the final file, ready for download after checkout.

Elevate Your Analysis with the Complete SWOT Report
Casella’s strengths include a diversified regional footprint and growing sustainable waste-management services, while weaknesses stem from commodity-price sensitivity and integration risks from acquisitions. Opportunities lie in expanding organics and recycling demand; threats include regulatory shifts and intense competition. Purchase the full SWOT for a detailed, editable Word and Excel package to support strategy and investment decisions.
Strengths
Vertically integrated operations
Owning collection, transfer, landfill and recycling assets gives Casella end-to-end control of service quality and costs, supporting consistent route economics across core markets. Vertical integration internalizes disposal, improving margins and contributing to reported FY2024 revenue of $1.52 billion and adjusted EBITDA around $320 million. Reduced third-party dependence stabilizes pricing and creates a defensible competitive advantage in its Northeast footprint.
Strong Northeast footprint
Casella’s strong Northeast footprint benefits from concentrated population density—the U.S. Northeast had about 56 million residents in 2023—supporting efficient routing and higher asset utilization. Deep local knowledge and long-standing relationships improve bidding and permitting outcomes. Aging regional infrastructure and persistent disposal demand sustain stable volumes. Close proximity between stops reduces fuel use and drive-time per route.
Long-term, sticky contracts
Multi-year municipal and commercial agreements (typically 3–10 years) give Casella high recurring revenue visibility and stable route volumes. Route density compounds as contracts renew, lowering churn and improving unit economics over time. Predictable cash flows support capex and acquisition pipelines, with many contracts including CPI or fuel-adjustment clauses to protect margins.
Landfill gas-to-energy capabilities
Converting landfill gas to renewable energy creates incremental revenue through power sales and RNG pathways, strengthens Casella’s ESG profile and aligns with tightening regulations, and helps mitigate methane liabilities given methane’s 100-year GWP of ~28 (IPCC AR5). Energy projects often qualify for RINs and California LCFS credits (LCFS averages near $145/tCO2e in 2024), enabling premium pricing and long-term cash flows.
- Revenue diversification
- ESG/regulatory alignment
- Credit eligibility (RINs/LCFS)
- Emissions liability reduction
Scale and operating know-how
Decades of operational expertise at Casella drive consistent safety, regulatory compliance, and tight cost control across its Northeast-focused footprint, underpinned by data-driven routing and predictive maintenance that compress unit costs and improve fleet utilization.
- Decades of operational expertise
- Data-driven routing & maintenance
- Centralized procurement & standardization
- Difficult for smaller rivals to replicate
Vertical integration fuels route margins; FY24 revenue $1.52B
Casella’s vertical integration of collection, transfer, landfill and recycling secures route economics and drove FY2024 revenue of $1.52B and adjusted EBITDA near $320M. Dense Northeast footprint (≈56M residents in 2023) boosts route density and lowers unit costs. RNG and landfill-gas projects capture RINs/LCFS value (LCFS ≈$145/tCO2e in 2024), diversifying cash flow.
| Metric | Value |
|---|---|
| FY2024 Revenue | $1.52B |
| Adj. EBITDA | $320M |
| Northeast pop (2023) | ~56M |
What is included in the product
Detailed Word Document
Delivers a strategic overview of Casella’s internal and external business factors, outlining strengths, weaknesses, opportunities, and threats to assess competitive position, growth drivers, operational gaps, and market risks shaping the company’s future.
Customizable Excel Spreadsheet
Casella SWOT Analysis provides a concise, editable matrix that quickly aligns strategy, streamlines communication, and serves as an ideal snapshot for executives, reports, and stakeholder presentations.
Weaknesses
Geographic concentration
Casella operates primarily in the Northeast and upstate New York, meaning a majority (>50%) of revenue and assets are regionally concentrated, which amplifies exposure to local weather, regulatory and economic risks.
Market slowdowns or policy shifts in the region can disproportionately affect quarterly results and margins compared with more diversified national peers.
Limited geographic diversification increases the chance that localized disruptions ripple through Casella’s collection, disposal and recycling network.
Capital intensity and leverage
Capital-intensive collection fleets, landfills and MRFs require substantial ongoing capex, often necessitating hundreds of millions over multi-year cycles. Casella’s elevated debt levels can constrain strategic flexibility in downturns, while rising interest rates raise interest expense and increase project hurdle rates. Delays in ROI on infrastructure investments can strain free cash flow and limit reinvestment capacity.
Environmental liabilities
Landfills carry closure and post-closure obligations that extend for decades, with EPA rules requiring at least 30 years of post-closure care for municipal solid waste sites. Remediation needs or regulatory changes can create sudden, material expense swings and project overruns. Any environmental incident risks regulatory fines and reputational damage, so reserve adequacy must be closely managed.
Recycling commodity exposure
- Recovered paper, metals, plastics volatility — 2024–2025
- Processing spread compression impacting margins
- Pass-through lag creates earnings volatility
- Revenue mix can skew unfavorable in downturns
Smaller scale than national majors
Casella is materially smaller than national majors: Waste Management reported about $20.8B and Republic Services $13.3B in 2024 versus Casella roughly $1.7B, which weakens bargaining power with suppliers and customers. Limited scale can restrict access to lowest-cost capital and the newest route optimization and landfill technologies. National accounts often favor multi-region providers, capping Casella’s share gains outside its core Northeast territory.
- Smaller revenue base (~$1.7B) vs WM $20.8B, RSG $13.3B
- Weaker supplier/contract leverage
- Higher relative cost of capital/tech adoption
- National account preference limits expansion
50% Northeast revenue concentration and commodity swings raise 2024-25 earnings volatility
Casella’s >50% revenue concentration in the Northeast amplifies exposure to local weather, policy and economic shocks, increasing 2024–25 earnings volatility. Recycled-commodity price swings in 2024–2025 compressed processing spreads and margins while pass-throughs lagged. Capital-intensive assets and >=30-year landfill post-closure obligations plus smaller scale (~$1.7B vs WM $20.8B, RSG $13.3B) limit strategic flexibility.
| Metric | Value |
|---|---|
| Revenue (2024) | ~$1.7B |
| WM (2024) | $20.8B |
| RSG (2024) | $13.3B |
| Landfill post-closure | >=30 yrs |
Full Version Awaits
Casella SWOT Analysis
This is the actual Casella SWOT analysis document you’ll receive upon purchase—no surprises, just professional quality. The preview below is taken directly from the full report; purchase unlocks the complete, editable version. You’re viewing a live excerpt of the final file, ready for download after checkout.
Description
Elevate Your Analysis with the Complete SWOT Report
Casella’s strengths include a diversified regional footprint and growing sustainable waste-management services, while weaknesses stem from commodity-price sensitivity and integration risks from acquisitions. Opportunities lie in expanding organics and recycling demand; threats include regulatory shifts and intense competition. Purchase the full SWOT for a detailed, editable Word and Excel package to support strategy and investment decisions.
Strengths
Vertically integrated operations
Owning collection, transfer, landfill and recycling assets gives Casella end-to-end control of service quality and costs, supporting consistent route economics across core markets. Vertical integration internalizes disposal, improving margins and contributing to reported FY2024 revenue of $1.52 billion and adjusted EBITDA around $320 million. Reduced third-party dependence stabilizes pricing and creates a defensible competitive advantage in its Northeast footprint.
Strong Northeast footprint
Casella’s strong Northeast footprint benefits from concentrated population density—the U.S. Northeast had about 56 million residents in 2023—supporting efficient routing and higher asset utilization. Deep local knowledge and long-standing relationships improve bidding and permitting outcomes. Aging regional infrastructure and persistent disposal demand sustain stable volumes. Close proximity between stops reduces fuel use and drive-time per route.
Long-term, sticky contracts
Multi-year municipal and commercial agreements (typically 3–10 years) give Casella high recurring revenue visibility and stable route volumes. Route density compounds as contracts renew, lowering churn and improving unit economics over time. Predictable cash flows support capex and acquisition pipelines, with many contracts including CPI or fuel-adjustment clauses to protect margins.
Landfill gas-to-energy capabilities
Converting landfill gas to renewable energy creates incremental revenue through power sales and RNG pathways, strengthens Casella’s ESG profile and aligns with tightening regulations, and helps mitigate methane liabilities given methane’s 100-year GWP of ~28 (IPCC AR5). Energy projects often qualify for RINs and California LCFS credits (LCFS averages near $145/tCO2e in 2024), enabling premium pricing and long-term cash flows.
- Revenue diversification
- ESG/regulatory alignment
- Credit eligibility (RINs/LCFS)
- Emissions liability reduction
Scale and operating know-how
Decades of operational expertise at Casella drive consistent safety, regulatory compliance, and tight cost control across its Northeast-focused footprint, underpinned by data-driven routing and predictive maintenance that compress unit costs and improve fleet utilization.
- Decades of operational expertise
- Data-driven routing & maintenance
- Centralized procurement & standardization
- Difficult for smaller rivals to replicate
Vertical integration fuels route margins; FY24 revenue $1.52B
Casella’s vertical integration of collection, transfer, landfill and recycling secures route economics and drove FY2024 revenue of $1.52B and adjusted EBITDA near $320M. Dense Northeast footprint (≈56M residents in 2023) boosts route density and lowers unit costs. RNG and landfill-gas projects capture RINs/LCFS value (LCFS ≈$145/tCO2e in 2024), diversifying cash flow.
| Metric | Value |
|---|---|
| FY2024 Revenue | $1.52B |
| Adj. EBITDA | $320M |
| Northeast pop (2023) | ~56M |
What is included in the product
Detailed Word Document
Delivers a strategic overview of Casella’s internal and external business factors, outlining strengths, weaknesses, opportunities, and threats to assess competitive position, growth drivers, operational gaps, and market risks shaping the company’s future.
Customizable Excel Spreadsheet
Casella SWOT Analysis provides a concise, editable matrix that quickly aligns strategy, streamlines communication, and serves as an ideal snapshot for executives, reports, and stakeholder presentations.
Weaknesses
Geographic concentration
Casella operates primarily in the Northeast and upstate New York, meaning a majority (>50%) of revenue and assets are regionally concentrated, which amplifies exposure to local weather, regulatory and economic risks.
Market slowdowns or policy shifts in the region can disproportionately affect quarterly results and margins compared with more diversified national peers.
Limited geographic diversification increases the chance that localized disruptions ripple through Casella’s collection, disposal and recycling network.
Capital intensity and leverage
Capital-intensive collection fleets, landfills and MRFs require substantial ongoing capex, often necessitating hundreds of millions over multi-year cycles. Casella’s elevated debt levels can constrain strategic flexibility in downturns, while rising interest rates raise interest expense and increase project hurdle rates. Delays in ROI on infrastructure investments can strain free cash flow and limit reinvestment capacity.
Environmental liabilities
Landfills carry closure and post-closure obligations that extend for decades, with EPA rules requiring at least 30 years of post-closure care for municipal solid waste sites. Remediation needs or regulatory changes can create sudden, material expense swings and project overruns. Any environmental incident risks regulatory fines and reputational damage, so reserve adequacy must be closely managed.
Recycling commodity exposure
- Recovered paper, metals, plastics volatility — 2024–2025
- Processing spread compression impacting margins
- Pass-through lag creates earnings volatility
- Revenue mix can skew unfavorable in downturns
Smaller scale than national majors
Casella is materially smaller than national majors: Waste Management reported about $20.8B and Republic Services $13.3B in 2024 versus Casella roughly $1.7B, which weakens bargaining power with suppliers and customers. Limited scale can restrict access to lowest-cost capital and the newest route optimization and landfill technologies. National accounts often favor multi-region providers, capping Casella’s share gains outside its core Northeast territory.
- Smaller revenue base (~$1.7B) vs WM $20.8B, RSG $13.3B
- Weaker supplier/contract leverage
- Higher relative cost of capital/tech adoption
- National account preference limits expansion
50% Northeast revenue concentration and commodity swings raise 2024-25 earnings volatility
Casella’s >50% revenue concentration in the Northeast amplifies exposure to local weather, policy and economic shocks, increasing 2024–25 earnings volatility. Recycled-commodity price swings in 2024–2025 compressed processing spreads and margins while pass-throughs lagged. Capital-intensive assets and >=30-year landfill post-closure obligations plus smaller scale (~$1.7B vs WM $20.8B, RSG $13.3B) limit strategic flexibility.
| Metric | Value |
|---|---|
| Revenue (2024) | ~$1.7B |
| WM (2024) | $20.8B |
| RSG (2024) | $13.3B |
| Landfill post-closure | >=30 yrs |
Full Version Awaits
Casella SWOT Analysis
This is the actual Casella SWOT analysis document you’ll receive upon purchase—no surprises, just professional quality. The preview below is taken directly from the full report; purchase unlocks the complete, editable version. You’re viewing a live excerpt of the final file, ready for download after checkout.











