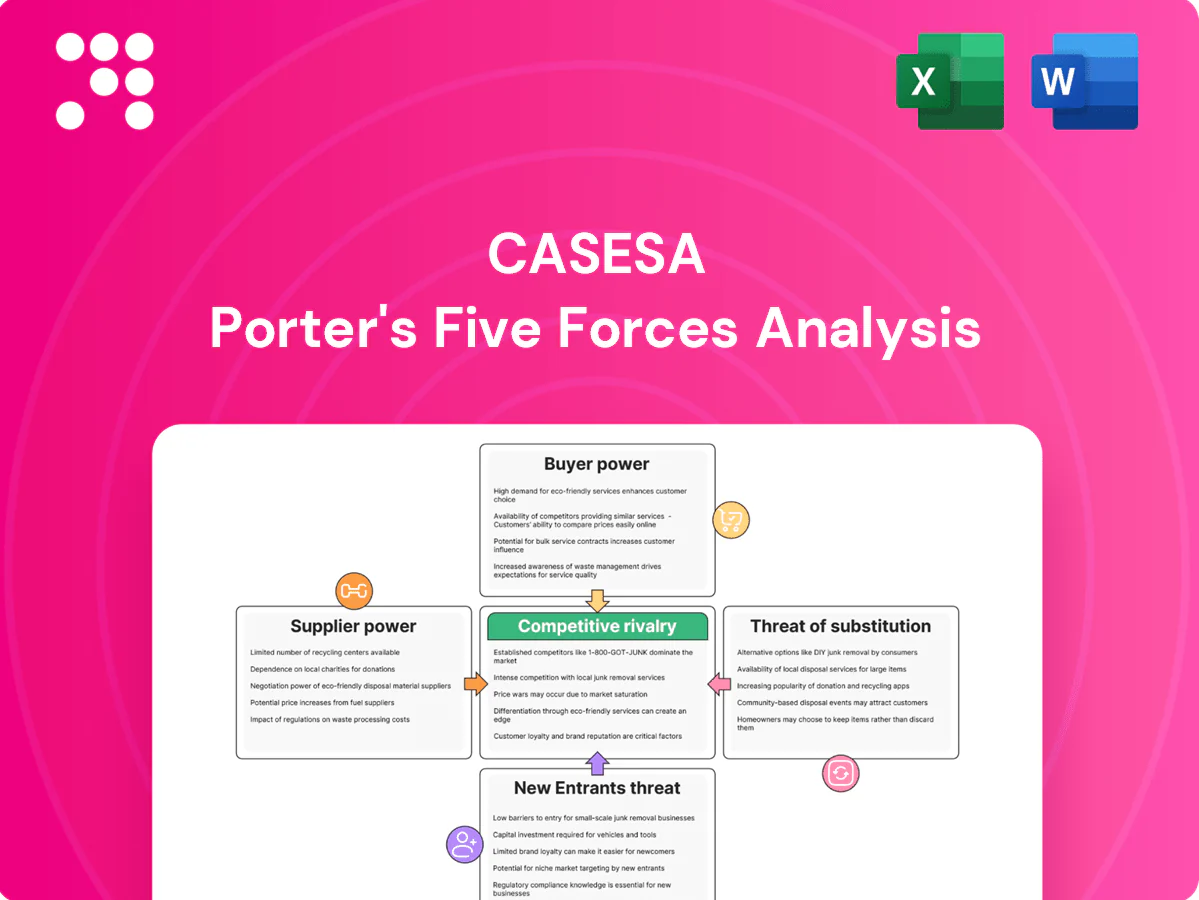
Casesa Porter's Five Forces Analysis

Don't Miss the Bigger Picture
Casesa's Porter's Five Forces snapshot highlights intense competitive rivalry, moderate supplier leverage, rising buyer sophistication, and evolving substitute threats that could reshape margins and growth prospects. Strategic entry barriers and niche positioning temper—but do not eliminate—industry risk. This brief scratches the surface; unlock the full Porter's Five Forces Analysis for force-by-force ratings, visuals, and actionable recommendations tailored to Casesa.
Suppliers Bargaining Power

Critical tech vendors
Critical camera, access-control and VMS vendors can exert strong leverage when platforms are proprietary; in 2024 the top five vendors accounted for over 60% of commercial deployments, raising switching costs for Casesa. Certification programs frequently lock roadmaps and pricing, driving multi-year dependencies and 5–15% annual maintenance escalations. Multi-sourcing and adoption of ONVIF and open APIs materially reduce this supplier power.
Telecom and cloud dependence
Alarm monitoring depends on carriers and cloud storage providers; top cloud vendors hold concentrated market share—AWS ~33%, Microsoft Azure ~22%, Google Cloud ~11% (2024 Synergy Research). Outages or price hikes from these suppliers can compress margins; enterprise cloud and network costs rose notably in 2023–24. Long-term contracts hedge volatility but reduce flexibility, while multi‑carrier/multi‑cloud redundancy mitigates disruption risk.

Specialized software licensing
Specialized PSIM, analytics and cybersecurity tools frequently use per-device fees, driving licensing costs higher as deployments scale; enterprise rollouts can see software line items grow by tens of percent as device counts rise. In 2024 global cybersecurity spend topped roughly $180 billion, increasing supplier leverage for per-unit pricing. Negotiated enterprise terms and volume discounts can cap year-to-year license inflation, often below mid-single digits, while Casesa’s integration expertise lets it replace or substitute modules over time to control total cost of ownership.

Guard labor market
Qualified guards and supervisors are a constrained supply in tight 2024 labor markets (US unemployment ~4.0%), shifting bargaining power to labor suppliers as wage inflation (average hourly earnings +4.1% YoY in 2024) and compliance costs rise; strong training pipelines can internalize capability while retention programs stabilize cost and quality.
- Supply constraint: high demand for trained guards
- Cost pressure: wages up ~4% in 2024
- Mitigation: training pipelines, retention programs
Hardware supply chain volatility
Sensor and chip shortages drive lead-time and price risks, with some components facing 8–20 week waits in 2024, causing project delays that harm cash flow and client satisfaction. Rigorous forecasting and 3–6 months of safety stock reduce exposure, while approved-alternative BOMs keep installations on schedule and limit rework.
Concentrated cameras (>60%) and cloud (AWS 33%) heighten security and supply risk
Critical proprietary camera/VMS vendors concentrate power (top 5 >60% of commercial deployments, 2024), raising switching costs; cloud providers concentrate infrastructure risk (AWS ~33%, Azure ~22%, GCP ~11%, 2024). Cybersecurity spend ~180B (2024) and per-device licensing increase software leverage; guard wages +4.1% YoY (2024) and component lead times 8–20 weeks shift bargaining toward suppliers.
| Metric | 2024 |
|---|---|
| Top-5 camera share | >60% |
| Cloud share (AWS/Azure/GCP) | 33%/22%/11% |
| Cybersecurity spend | ~180B |
| Guard wage growth | +4.1% YoY |
| Component lead times | 8–20 weeks |
What is included in the product
 Detailed Word Document
Tailored Porter's Five Forces analysis for Casesa that uncovers key competitive drivers, supplier and buyer power, entry barriers, substitutes and disruptive threats, and offers strategic commentary and editable Word format for investor reports, strategy decks, or academic use.

 Customizable Excel Spreadsheet
A clean one-sheet Casesa Porter's Five Forces analysis that visualizes strategic pressure with a spider chart and lets you customize force levels and labels—ready to paste into pitch decks or integrate with Excel, no macros needed.
Customers Bargaining Power

Large enterprise RFPs
Corporate buyers aggregate volume to extract discounts often up to 30%, while competitive tenders intensify price pressure and raise SLA penalties (reports show SLA fines growing ~25% in tech RFPs). Multi-year contracts give revenue visibility but typically compress EBITDA margins 3–7 percentage points; deep integration can sustain a 5–15% premium.
Switching costs from installed base
Embedded controls and monitoring create high switching costs—rip-and-replace plus downtime (large-enterprise outages can exceed $300k/hour) deter churn, while by 2024 92% of enterprises run multi/hybrid cloud architectures, showing demand for openness; open architectures reduce lock-in and boost buyer power, and structured migration plans turn existing installed-base dependency into consultative upsell opportunities.

Service performance transparency
Service performance transparency—measured via response times, incident logs and uptime—lets buyers benchmark providers against common targets such as 99.99% uptime and critical incident response under 1 hour. Contracts frequently include service credits or penalties (commonly up to 10% of monthly fees) that buyers enforce. Clear SLAs shift negotiation to outcomes rather than hours, and continuous improvement programs shrink grounds for concessions.

Price sensitivity in guarding
Manned guarding is perceived as commoditized; US Bureau of Labor Statistics reports a median security guard wage near $15.00/hr in 2024, driving buyers to compare hourly rates across multiple local providers. Bundling with tech and remote monitoring—which saw enterprise trials rise double-digits in 2024—reframes value beyond hours. Outcome-based pricing, tying fees to incident reduction or response SLAs, aligns cost to measured risk reduction.
- Commoditization: hourly-rate comparisons
- Wage benchmark: ~15.00/hr (BLS 2024)
- Bundle impact: tech + remote monitoring adoption up in 2024
- Pricing shift: outcome-based fees tie cost to risk reduction
Compliance and liability transfer
Clients increasingly shift compliance burdens and liability to vendors, with buyer-driven contractual indemnities and insurance requirements raising provider costs and capital allocation; in 2024 over 50% of enterprise procurement templates included explicit indemnity clauses. Strong governance, SOC 2/ISO 27001 certification and demonstrable risk mitigation reduce buyer leverage and support firmer pricing and higher margin retention.
- Indemnities raise compliance costs
- Insurance increases operating expense
- Certifications cut buyer leverage
- Risk proof enables stronger pricing
Buyers win: up to 30% discounts, 92% multi/hybrid cloud
Corporate buyers extract discounts up to 30% and SLA fines rose ~25% in tech RFPs; multi-year deals compress EBITDA 3–7 ppt but deepen integration. 92% of enterprises ran multi/hybrid cloud in 2024, reducing lock‑in and upping buyer leverage. Median US guard wage ~$15.00/hr (BLS 2024); outcome pricing and tech bundles shift value. Over 50% of procurement templates in 2024 included indemnities.
| Metric | 2024 | Impact |
|---|---|---|
| Max discount | ~30% | Margin pressure |
| SLA fines growth | ~25% | Negotiation leverage |
| Multi/hybrid cloud | 92% | Reduces lock‑in |
| Median guard wage | $15.00/hr | Commoditization |
| Procurement indemnities | >50% | Raises compliance cost |
Preview the Actual Deliverable
Casesa Porter's Five Forces Analysis
This preview shows the exact Casesa Porter's Five Forces Analysis you'll receive immediately after purchase—no surprises, no placeholders. The document displayed is fully formatted, professionally written and ready for download and use the moment you buy. You're viewing the final deliverable and will get this same file instantly upon payment.

Don't Miss the Bigger Picture
Casesa's Porter's Five Forces snapshot highlights intense competitive rivalry, moderate supplier leverage, rising buyer sophistication, and evolving substitute threats that could reshape margins and growth prospects. Strategic entry barriers and niche positioning temper—but do not eliminate—industry risk. This brief scratches the surface; unlock the full Porter's Five Forces Analysis for force-by-force ratings, visuals, and actionable recommendations tailored to Casesa.
Suppliers Bargaining Power
Critical tech vendors
Critical camera, access-control and VMS vendors can exert strong leverage when platforms are proprietary; in 2024 the top five vendors accounted for over 60% of commercial deployments, raising switching costs for Casesa. Certification programs frequently lock roadmaps and pricing, driving multi-year dependencies and 5–15% annual maintenance escalations. Multi-sourcing and adoption of ONVIF and open APIs materially reduce this supplier power.
Telecom and cloud dependence
Alarm monitoring depends on carriers and cloud storage providers; top cloud vendors hold concentrated market share—AWS ~33%, Microsoft Azure ~22%, Google Cloud ~11% (2024 Synergy Research). Outages or price hikes from these suppliers can compress margins; enterprise cloud and network costs rose notably in 2023–24. Long-term contracts hedge volatility but reduce flexibility, while multi‑carrier/multi‑cloud redundancy mitigates disruption risk.
Specialized software licensing
Specialized PSIM, analytics and cybersecurity tools frequently use per-device fees, driving licensing costs higher as deployments scale; enterprise rollouts can see software line items grow by tens of percent as device counts rise. In 2024 global cybersecurity spend topped roughly $180 billion, increasing supplier leverage for per-unit pricing. Negotiated enterprise terms and volume discounts can cap year-to-year license inflation, often below mid-single digits, while Casesa’s integration expertise lets it replace or substitute modules over time to control total cost of ownership.
Guard labor market
Qualified guards and supervisors are a constrained supply in tight 2024 labor markets (US unemployment ~4.0%), shifting bargaining power to labor suppliers as wage inflation (average hourly earnings +4.1% YoY in 2024) and compliance costs rise; strong training pipelines can internalize capability while retention programs stabilize cost and quality.
- Supply constraint: high demand for trained guards
- Cost pressure: wages up ~4% in 2024
- Mitigation: training pipelines, retention programs
Hardware supply chain volatility
Sensor and chip shortages drive lead-time and price risks, with some components facing 8–20 week waits in 2024, causing project delays that harm cash flow and client satisfaction. Rigorous forecasting and 3–6 months of safety stock reduce exposure, while approved-alternative BOMs keep installations on schedule and limit rework.
Concentrated cameras (>60%) and cloud (AWS 33%) heighten security and supply risk
Critical proprietary camera/VMS vendors concentrate power (top 5 >60% of commercial deployments, 2024), raising switching costs; cloud providers concentrate infrastructure risk (AWS ~33%, Azure ~22%, GCP ~11%, 2024). Cybersecurity spend ~180B (2024) and per-device licensing increase software leverage; guard wages +4.1% YoY (2024) and component lead times 8–20 weeks shift bargaining toward suppliers.
| Metric | 2024 |
|---|---|
| Top-5 camera share | >60% |
| Cloud share (AWS/Azure/GCP) | 33%/22%/11% |
| Cybersecurity spend | ~180B |
| Guard wage growth | +4.1% YoY |
| Component lead times | 8–20 weeks |
What is included in the product
Detailed Word Document
Tailored Porter's Five Forces analysis for Casesa that uncovers key competitive drivers, supplier and buyer power, entry barriers, substitutes and disruptive threats, and offers strategic commentary and editable Word format for investor reports, strategy decks, or academic use.
Customizable Excel Spreadsheet
A clean one-sheet Casesa Porter's Five Forces analysis that visualizes strategic pressure with a spider chart and lets you customize force levels and labels—ready to paste into pitch decks or integrate with Excel, no macros needed.
Customers Bargaining Power
Large enterprise RFPs
Corporate buyers aggregate volume to extract discounts often up to 30%, while competitive tenders intensify price pressure and raise SLA penalties (reports show SLA fines growing ~25% in tech RFPs). Multi-year contracts give revenue visibility but typically compress EBITDA margins 3–7 percentage points; deep integration can sustain a 5–15% premium.
Switching costs from installed base
Embedded controls and monitoring create high switching costs—rip-and-replace plus downtime (large-enterprise outages can exceed $300k/hour) deter churn, while by 2024 92% of enterprises run multi/hybrid cloud architectures, showing demand for openness; open architectures reduce lock-in and boost buyer power, and structured migration plans turn existing installed-base dependency into consultative upsell opportunities.
Service performance transparency
Service performance transparency—measured via response times, incident logs and uptime—lets buyers benchmark providers against common targets such as 99.99% uptime and critical incident response under 1 hour. Contracts frequently include service credits or penalties (commonly up to 10% of monthly fees) that buyers enforce. Clear SLAs shift negotiation to outcomes rather than hours, and continuous improvement programs shrink grounds for concessions.
Price sensitivity in guarding
Manned guarding is perceived as commoditized; US Bureau of Labor Statistics reports a median security guard wage near $15.00/hr in 2024, driving buyers to compare hourly rates across multiple local providers. Bundling with tech and remote monitoring—which saw enterprise trials rise double-digits in 2024—reframes value beyond hours. Outcome-based pricing, tying fees to incident reduction or response SLAs, aligns cost to measured risk reduction.
- Commoditization: hourly-rate comparisons
- Wage benchmark: ~15.00/hr (BLS 2024)
- Bundle impact: tech + remote monitoring adoption up in 2024
- Pricing shift: outcome-based fees tie cost to risk reduction
Compliance and liability transfer
Clients increasingly shift compliance burdens and liability to vendors, with buyer-driven contractual indemnities and insurance requirements raising provider costs and capital allocation; in 2024 over 50% of enterprise procurement templates included explicit indemnity clauses. Strong governance, SOC 2/ISO 27001 certification and demonstrable risk mitigation reduce buyer leverage and support firmer pricing and higher margin retention.
- Indemnities raise compliance costs
- Insurance increases operating expense
- Certifications cut buyer leverage
- Risk proof enables stronger pricing
Buyers win: up to 30% discounts, 92% multi/hybrid cloud
Corporate buyers extract discounts up to 30% and SLA fines rose ~25% in tech RFPs; multi-year deals compress EBITDA 3–7 ppt but deepen integration. 92% of enterprises ran multi/hybrid cloud in 2024, reducing lock‑in and upping buyer leverage. Median US guard wage ~$15.00/hr (BLS 2024); outcome pricing and tech bundles shift value. Over 50% of procurement templates in 2024 included indemnities.
| Metric | 2024 | Impact |
|---|---|---|
| Max discount | ~30% | Margin pressure |
| SLA fines growth | ~25% | Negotiation leverage |
| Multi/hybrid cloud | 92% | Reduces lock‑in |
| Median guard wage | $15.00/hr | Commoditization |
| Procurement indemnities | >50% | Raises compliance cost |
Preview the Actual Deliverable
Casesa Porter's Five Forces Analysis
This preview shows the exact Casesa Porter's Five Forces Analysis you'll receive immediately after purchase—no surprises, no placeholders. The document displayed is fully formatted, professionally written and ready for download and use the moment you buy. You're viewing the final deliverable and will get this same file instantly upon payment.
Description
Don't Miss the Bigger Picture
Casesa's Porter's Five Forces snapshot highlights intense competitive rivalry, moderate supplier leverage, rising buyer sophistication, and evolving substitute threats that could reshape margins and growth prospects. Strategic entry barriers and niche positioning temper—but do not eliminate—industry risk. This brief scratches the surface; unlock the full Porter's Five Forces Analysis for force-by-force ratings, visuals, and actionable recommendations tailored to Casesa.
Suppliers Bargaining Power
Critical tech vendors
Critical camera, access-control and VMS vendors can exert strong leverage when platforms are proprietary; in 2024 the top five vendors accounted for over 60% of commercial deployments, raising switching costs for Casesa. Certification programs frequently lock roadmaps and pricing, driving multi-year dependencies and 5–15% annual maintenance escalations. Multi-sourcing and adoption of ONVIF and open APIs materially reduce this supplier power.
Telecom and cloud dependence
Alarm monitoring depends on carriers and cloud storage providers; top cloud vendors hold concentrated market share—AWS ~33%, Microsoft Azure ~22%, Google Cloud ~11% (2024 Synergy Research). Outages or price hikes from these suppliers can compress margins; enterprise cloud and network costs rose notably in 2023–24. Long-term contracts hedge volatility but reduce flexibility, while multi‑carrier/multi‑cloud redundancy mitigates disruption risk.
Specialized software licensing
Specialized PSIM, analytics and cybersecurity tools frequently use per-device fees, driving licensing costs higher as deployments scale; enterprise rollouts can see software line items grow by tens of percent as device counts rise. In 2024 global cybersecurity spend topped roughly $180 billion, increasing supplier leverage for per-unit pricing. Negotiated enterprise terms and volume discounts can cap year-to-year license inflation, often below mid-single digits, while Casesa’s integration expertise lets it replace or substitute modules over time to control total cost of ownership.
Guard labor market
Qualified guards and supervisors are a constrained supply in tight 2024 labor markets (US unemployment ~4.0%), shifting bargaining power to labor suppliers as wage inflation (average hourly earnings +4.1% YoY in 2024) and compliance costs rise; strong training pipelines can internalize capability while retention programs stabilize cost and quality.
- Supply constraint: high demand for trained guards
- Cost pressure: wages up ~4% in 2024
- Mitigation: training pipelines, retention programs
Hardware supply chain volatility
Sensor and chip shortages drive lead-time and price risks, with some components facing 8–20 week waits in 2024, causing project delays that harm cash flow and client satisfaction. Rigorous forecasting and 3–6 months of safety stock reduce exposure, while approved-alternative BOMs keep installations on schedule and limit rework.
Concentrated cameras (>60%) and cloud (AWS 33%) heighten security and supply risk
Critical proprietary camera/VMS vendors concentrate power (top 5 >60% of commercial deployments, 2024), raising switching costs; cloud providers concentrate infrastructure risk (AWS ~33%, Azure ~22%, GCP ~11%, 2024). Cybersecurity spend ~180B (2024) and per-device licensing increase software leverage; guard wages +4.1% YoY (2024) and component lead times 8–20 weeks shift bargaining toward suppliers.
| Metric | 2024 |
|---|---|
| Top-5 camera share | >60% |
| Cloud share (AWS/Azure/GCP) | 33%/22%/11% |
| Cybersecurity spend | ~180B |
| Guard wage growth | +4.1% YoY |
| Component lead times | 8–20 weeks |
What is included in the product
Detailed Word Document
Tailored Porter's Five Forces analysis for Casesa that uncovers key competitive drivers, supplier and buyer power, entry barriers, substitutes and disruptive threats, and offers strategic commentary and editable Word format for investor reports, strategy decks, or academic use.
Customizable Excel Spreadsheet
A clean one-sheet Casesa Porter's Five Forces analysis that visualizes strategic pressure with a spider chart and lets you customize force levels and labels—ready to paste into pitch decks or integrate with Excel, no macros needed.
Customers Bargaining Power
Large enterprise RFPs
Corporate buyers aggregate volume to extract discounts often up to 30%, while competitive tenders intensify price pressure and raise SLA penalties (reports show SLA fines growing ~25% in tech RFPs). Multi-year contracts give revenue visibility but typically compress EBITDA margins 3–7 percentage points; deep integration can sustain a 5–15% premium.
Switching costs from installed base
Embedded controls and monitoring create high switching costs—rip-and-replace plus downtime (large-enterprise outages can exceed $300k/hour) deter churn, while by 2024 92% of enterprises run multi/hybrid cloud architectures, showing demand for openness; open architectures reduce lock-in and boost buyer power, and structured migration plans turn existing installed-base dependency into consultative upsell opportunities.
Service performance transparency
Service performance transparency—measured via response times, incident logs and uptime—lets buyers benchmark providers against common targets such as 99.99% uptime and critical incident response under 1 hour. Contracts frequently include service credits or penalties (commonly up to 10% of monthly fees) that buyers enforce. Clear SLAs shift negotiation to outcomes rather than hours, and continuous improvement programs shrink grounds for concessions.
Price sensitivity in guarding
Manned guarding is perceived as commoditized; US Bureau of Labor Statistics reports a median security guard wage near $15.00/hr in 2024, driving buyers to compare hourly rates across multiple local providers. Bundling with tech and remote monitoring—which saw enterprise trials rise double-digits in 2024—reframes value beyond hours. Outcome-based pricing, tying fees to incident reduction or response SLAs, aligns cost to measured risk reduction.
- Commoditization: hourly-rate comparisons
- Wage benchmark: ~15.00/hr (BLS 2024)
- Bundle impact: tech + remote monitoring adoption up in 2024
- Pricing shift: outcome-based fees tie cost to risk reduction
Compliance and liability transfer
Clients increasingly shift compliance burdens and liability to vendors, with buyer-driven contractual indemnities and insurance requirements raising provider costs and capital allocation; in 2024 over 50% of enterprise procurement templates included explicit indemnity clauses. Strong governance, SOC 2/ISO 27001 certification and demonstrable risk mitigation reduce buyer leverage and support firmer pricing and higher margin retention.
- Indemnities raise compliance costs
- Insurance increases operating expense
- Certifications cut buyer leverage
- Risk proof enables stronger pricing
Buyers win: up to 30% discounts, 92% multi/hybrid cloud
Corporate buyers extract discounts up to 30% and SLA fines rose ~25% in tech RFPs; multi-year deals compress EBITDA 3–7 ppt but deepen integration. 92% of enterprises ran multi/hybrid cloud in 2024, reducing lock‑in and upping buyer leverage. Median US guard wage ~$15.00/hr (BLS 2024); outcome pricing and tech bundles shift value. Over 50% of procurement templates in 2024 included indemnities.
| Metric | 2024 | Impact |
|---|---|---|
| Max discount | ~30% | Margin pressure |
| SLA fines growth | ~25% | Negotiation leverage |
| Multi/hybrid cloud | 92% | Reduces lock‑in |
| Median guard wage | $15.00/hr | Commoditization |
| Procurement indemnities | >50% | Raises compliance cost |
Preview the Actual Deliverable
Casesa Porter's Five Forces Analysis
This preview shows the exact Casesa Porter's Five Forces Analysis you'll receive immediately after purchase—no surprises, no placeholders. The document displayed is fully formatted, professionally written and ready for download and use the moment you buy. You're viewing the final deliverable and will get this same file instantly upon payment.











