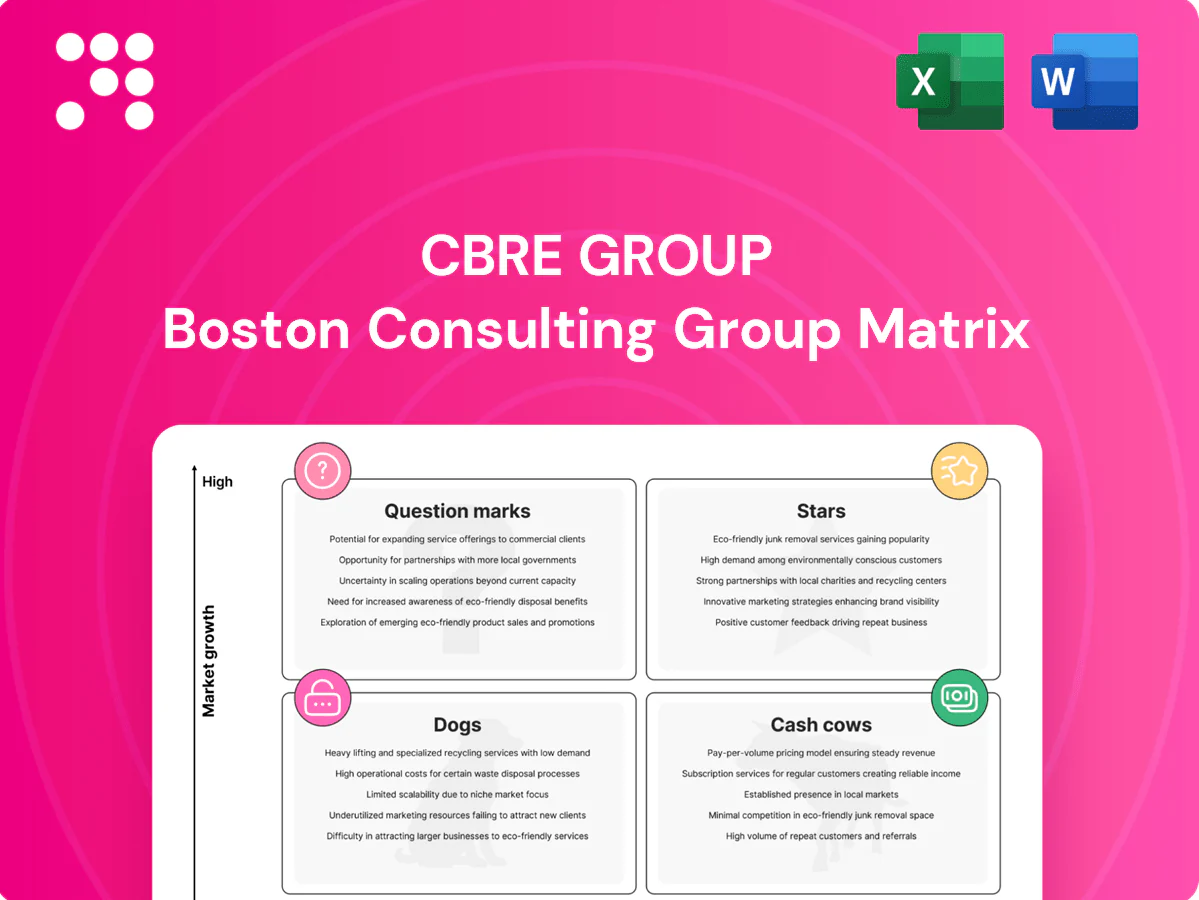
CBRE Group Boston Consulting Group Matrix

Visual. Strategic. Downloadable.
Curious where CBRE’s businesses sit — Stars, Cash Cows, Dogs, or Question Marks? This snapshot sketches the map; the full BCG Matrix gives quadrant-by-quadrant placement, data-backed moves, and a ready-to-use Word report plus a high-level Excel summary. Buy the complete matrix to stop guessing and start allocating capital with confidence.
Stars

Global Workplace Solutions (IFM outsourcing)
Global Workplace Solutions, CBRE’s integrated outsourcing arm and part of the company’s largest global CRE platform, sits in the Stars quadrant as enterprise clients shift to integrated outsourcing and CBRE is often the go‑to provider; growth tailwinds include cost pressure, energy efficiency and reliability. It is capital intensive to win and ramp, but once embedded scale compounds; feed it investment and GWS can mature into a major cash engine for CBRE, which reported roughly $30B revenue in 2024.
Project & Program Management for enterprise rollouts
Large, multi‑site buildouts and refresh programs are expanding as supply‑chain, logistics and workplace rethinks drive demand; CBRE, the world’s largest commercial real estate services firm, manages over 6 billion sq ft globally (2024). CBRE’s execution depth wins global mandates and repeat scope, enabling scale advantages despite upfront delivery cash burn. Market growth and share leadership justify investment; keep staffing and technology stacked to stay ahead.

Industrial & logistics leasing and advisory
Industrial & logistics leasing and advisory remains a Stars market as e‑commerce penetration (≈22% global online retail share in 2024) plus nearshoring and inventory realignment sustain high demand across regions. CBRE leverages leading data, global coverage and deep tenant/investor ties—operating in 100+ countries and advising on roughly 7 billion sq ft of assets in 2024. Intense activity drives elevated resource needs but preserves market share; keep investing while the cycle is favorable.

Data centers and mission‑critical advisory
AI and cloud demand drove global data center capacity needs sharply higher in 2024, with the data center market estimated near $260 billion and hyperscale operators taking the lion’s share of new builds; CBRE’s specialized teams and developer/operator access position it as a front‑runner in mission‑critical advisory.
Delivering at pace requires talent and tooling, so the segment consumes cash as CBRE scales advisory and project services, yet strong demand and early‑innings market dynamics make the investment strategically justified.
- market: ~260B (2024)
- hyperscale share: majority of new capacity (2023–24)
- CBRE positioning: specialized teams + operator access
- cash profile: high upfront investment to scale delivery
- outlook: early innings, high growth potential
Sustainability solutions embedded in contracts
Clients demand real decarbonization, not disclosure-only programs; embedding ESG into IFM and PM mandates locks CBRE into recurring revenue and pricing premium. Building the toolkit and measurement layers requires significant investment but cements leadership as the market matures; buildings account for about 40% of global energy-related CO2 emissions (IEA).
- Embed ESG: locks recurring growth
- Investment: high upfront toolkit/measurement costs
- Market impact: leadership as buildings ~40% of emissions
Industrial, data center and ESG services driving high-growth real estate platforms
CBRE Stars (GWS, industrial, data centers, ESG services) combine high growth and market leadership; 2024 revenue ≈ $30B with GWS/industrial scaling recurring fees but heavy upfront investment; data center market ≈ $260B (2024) and e‑commerce ≈22% online retail share (2024); buildings ≈40% energy CO2.
| Metric | 2024 |
|---|---|
| CBRE revenue | $30B |
| Data center market | $260B |
| Managed sqft | 6–7B sqft |
| E‑commerce share | ≈22% |
| Buildings CO2 | ≈40% |
What is included in the product
 Detailed Word Document
CBRE BCG Matrix maps units into Stars, Cash Cows, Question Marks, and Dogs with clear investment, hold, or divest guidance.

 Customizable Excel Spreadsheet
One-page CBRE BCG Matrix placing units in quadrants—clean, C-level ready and exportable to PowerPoint for quick decks.
Cash Cows

Property management (recurring fee base)
CBREs property management arm sits on a large installed base, managing over 7 billion sq ft globally, with sticky, contractually recurring fees that drive predictable margins. Growth is low, but once platforms scale the business exhibits heavy operating leverage and strong free cash conversion. That reliable cash funds new bets; focus on process optimization and avoid overspending on client acquisition.
Valuation & appraisal services
Valuation & appraisal services are a core, regulated offering for CBRE and remain needed across cycles; as of 2024 CBRE is the largest global commercial real estate services firm, which underpins strong repeat demand and market share for these services.
Not high-growth, but highly cash generative relative to investment: standardized workflows and technology-led processes keep unit costs down and margins resilient versus more capital-intensive lines.

Loan servicing and asset administration
Loan servicing and asset administration deliver stable fee income tied to long‑lived portfolios, generating low‑single‑digit organic growth while client retention exceeds 90%. CBRE's scale and compliance infrastructure create high barriers to entry, allowing normalized margins and operational leverage. Growth is modest but predictable; prioritize efficiency and technology to milk cash flows and avoid unnecessary expansion capex.

Advisory for occupiers with embedded accounts
Advisory for occupiers with embedded accounts is a cash cow: leverages existing relationships to bundle strategy, portfolio optimization and transactions into renewals, driving mature, high-margin revenue with low incremental cost to serve; CBRE reported 2024 net revenue of $36.6 billion, with occupier services contributing a sizable, repeatable fee stream.
- Strategy-led cross-sell
- Portfolio optimization + transactions
- Low incremental cost to serve
- Senior coverage & renewals
CBRE Investment Management base fees
CBRE Investment Management base fees on committed capital deliver steady recurring revenue even when transactions slow; CBRE IM reported about 176.1 billion USD AUM as of June 30, 2024, which underpins fee income. Growth is moderate with strong margins; keep performance tight to resist fee erosion.
- Steady fees on committed capital
- 176.1 billion USD AUM (Jun 30, 2024)
- Moderate growth, strong margins
- Priority: prevent fee erosion via performance
Installed base + recurring fees drive steady margins and strong free cash flow
CBRE cash cows: large installed bases and recurring fees drive predictable margins and strong free cash flow (property mgmt 7B sq ft). Occupier services and valuation are stable, high-margin repeat revenue; CBRE IM AUM 176.1B (Jun 30, 2024). Prioritize efficiency, tech and cross-sell to sustain margins and avoid excess capex.
| Segment | Key metric | 2024 figure |
|---|---|---|
| Property Mgmt | Managed area | 7B sq ft |
| Occupier Services | Net revenue | $36.6B |
| CBRE IM | AUM (Jun 30) | $176.1B |
| Loan Servicing | Client retention | >90% |
Delivered as Shown
CBRE Group BCG Matrix
The file you're previewing is the exact CBRE Group BCG Matrix report you'll receive after purchase. No watermarks, no demo text—just the fully formatted, analysis-ready document meant for immediate use. It’s crafted for strategic clarity and market context, so there are no surprises. After payment you’ll get the same file to download, edit, print, or present right away.

Visual. Strategic. Downloadable.
Curious where CBRE’s businesses sit — Stars, Cash Cows, Dogs, or Question Marks? This snapshot sketches the map; the full BCG Matrix gives quadrant-by-quadrant placement, data-backed moves, and a ready-to-use Word report plus a high-level Excel summary. Buy the complete matrix to stop guessing and start allocating capital with confidence.
Stars
Global Workplace Solutions (IFM outsourcing)
Global Workplace Solutions, CBRE’s integrated outsourcing arm and part of the company’s largest global CRE platform, sits in the Stars quadrant as enterprise clients shift to integrated outsourcing and CBRE is often the go‑to provider; growth tailwinds include cost pressure, energy efficiency and reliability. It is capital intensive to win and ramp, but once embedded scale compounds; feed it investment and GWS can mature into a major cash engine for CBRE, which reported roughly $30B revenue in 2024.
Project & Program Management for enterprise rollouts
Large, multi‑site buildouts and refresh programs are expanding as supply‑chain, logistics and workplace rethinks drive demand; CBRE, the world’s largest commercial real estate services firm, manages over 6 billion sq ft globally (2024). CBRE’s execution depth wins global mandates and repeat scope, enabling scale advantages despite upfront delivery cash burn. Market growth and share leadership justify investment; keep staffing and technology stacked to stay ahead.
Industrial & logistics leasing and advisory
Industrial & logistics leasing and advisory remains a Stars market as e‑commerce penetration (≈22% global online retail share in 2024) plus nearshoring and inventory realignment sustain high demand across regions. CBRE leverages leading data, global coverage and deep tenant/investor ties—operating in 100+ countries and advising on roughly 7 billion sq ft of assets in 2024. Intense activity drives elevated resource needs but preserves market share; keep investing while the cycle is favorable.
Data centers and mission‑critical advisory
AI and cloud demand drove global data center capacity needs sharply higher in 2024, with the data center market estimated near $260 billion and hyperscale operators taking the lion’s share of new builds; CBRE’s specialized teams and developer/operator access position it as a front‑runner in mission‑critical advisory.
Delivering at pace requires talent and tooling, so the segment consumes cash as CBRE scales advisory and project services, yet strong demand and early‑innings market dynamics make the investment strategically justified.
- market: ~260B (2024)
- hyperscale share: majority of new capacity (2023–24)
- CBRE positioning: specialized teams + operator access
- cash profile: high upfront investment to scale delivery
- outlook: early innings, high growth potential
Sustainability solutions embedded in contracts
Clients demand real decarbonization, not disclosure-only programs; embedding ESG into IFM and PM mandates locks CBRE into recurring revenue and pricing premium. Building the toolkit and measurement layers requires significant investment but cements leadership as the market matures; buildings account for about 40% of global energy-related CO2 emissions (IEA).
- Embed ESG: locks recurring growth
- Investment: high upfront toolkit/measurement costs
- Market impact: leadership as buildings ~40% of emissions
Industrial, data center and ESG services driving high-growth real estate platforms
CBRE Stars (GWS, industrial, data centers, ESG services) combine high growth and market leadership; 2024 revenue ≈ $30B with GWS/industrial scaling recurring fees but heavy upfront investment; data center market ≈ $260B (2024) and e‑commerce ≈22% online retail share (2024); buildings ≈40% energy CO2.
| Metric | 2024 |
|---|---|
| CBRE revenue | $30B |
| Data center market | $260B |
| Managed sqft | 6–7B sqft |
| E‑commerce share | ≈22% |
| Buildings CO2 | ≈40% |
What is included in the product
Detailed Word Document
CBRE BCG Matrix maps units into Stars, Cash Cows, Question Marks, and Dogs with clear investment, hold, or divest guidance.
Customizable Excel Spreadsheet
One-page CBRE BCG Matrix placing units in quadrants—clean, C-level ready and exportable to PowerPoint for quick decks.
Cash Cows
Property management (recurring fee base)
CBREs property management arm sits on a large installed base, managing over 7 billion sq ft globally, with sticky, contractually recurring fees that drive predictable margins. Growth is low, but once platforms scale the business exhibits heavy operating leverage and strong free cash conversion. That reliable cash funds new bets; focus on process optimization and avoid overspending on client acquisition.
Valuation & appraisal services
Valuation & appraisal services are a core, regulated offering for CBRE and remain needed across cycles; as of 2024 CBRE is the largest global commercial real estate services firm, which underpins strong repeat demand and market share for these services.
Not high-growth, but highly cash generative relative to investment: standardized workflows and technology-led processes keep unit costs down and margins resilient versus more capital-intensive lines.
Loan servicing and asset administration
Loan servicing and asset administration deliver stable fee income tied to long‑lived portfolios, generating low‑single‑digit organic growth while client retention exceeds 90%. CBRE's scale and compliance infrastructure create high barriers to entry, allowing normalized margins and operational leverage. Growth is modest but predictable; prioritize efficiency and technology to milk cash flows and avoid unnecessary expansion capex.
Advisory for occupiers with embedded accounts
Advisory for occupiers with embedded accounts is a cash cow: leverages existing relationships to bundle strategy, portfolio optimization and transactions into renewals, driving mature, high-margin revenue with low incremental cost to serve; CBRE reported 2024 net revenue of $36.6 billion, with occupier services contributing a sizable, repeatable fee stream.
- Strategy-led cross-sell
- Portfolio optimization + transactions
- Low incremental cost to serve
- Senior coverage & renewals
CBRE Investment Management base fees
CBRE Investment Management base fees on committed capital deliver steady recurring revenue even when transactions slow; CBRE IM reported about 176.1 billion USD AUM as of June 30, 2024, which underpins fee income. Growth is moderate with strong margins; keep performance tight to resist fee erosion.
- Steady fees on committed capital
- 176.1 billion USD AUM (Jun 30, 2024)
- Moderate growth, strong margins
- Priority: prevent fee erosion via performance
Installed base + recurring fees drive steady margins and strong free cash flow
CBRE cash cows: large installed bases and recurring fees drive predictable margins and strong free cash flow (property mgmt 7B sq ft). Occupier services and valuation are stable, high-margin repeat revenue; CBRE IM AUM 176.1B (Jun 30, 2024). Prioritize efficiency, tech and cross-sell to sustain margins and avoid excess capex.
| Segment | Key metric | 2024 figure |
|---|---|---|
| Property Mgmt | Managed area | 7B sq ft |
| Occupier Services | Net revenue | $36.6B |
| CBRE IM | AUM (Jun 30) | $176.1B |
| Loan Servicing | Client retention | >90% |
Delivered as Shown
CBRE Group BCG Matrix
The file you're previewing is the exact CBRE Group BCG Matrix report you'll receive after purchase. No watermarks, no demo text—just the fully formatted, analysis-ready document meant for immediate use. It’s crafted for strategic clarity and market context, so there are no surprises. After payment you’ll get the same file to download, edit, print, or present right away.
Original: $10.00
-65%$10.00
$3.50Description
Visual. Strategic. Downloadable.
Curious where CBRE’s businesses sit — Stars, Cash Cows, Dogs, or Question Marks? This snapshot sketches the map; the full BCG Matrix gives quadrant-by-quadrant placement, data-backed moves, and a ready-to-use Word report plus a high-level Excel summary. Buy the complete matrix to stop guessing and start allocating capital with confidence.
Stars
Global Workplace Solutions (IFM outsourcing)
Global Workplace Solutions, CBRE’s integrated outsourcing arm and part of the company’s largest global CRE platform, sits in the Stars quadrant as enterprise clients shift to integrated outsourcing and CBRE is often the go‑to provider; growth tailwinds include cost pressure, energy efficiency and reliability. It is capital intensive to win and ramp, but once embedded scale compounds; feed it investment and GWS can mature into a major cash engine for CBRE, which reported roughly $30B revenue in 2024.
Project & Program Management for enterprise rollouts
Large, multi‑site buildouts and refresh programs are expanding as supply‑chain, logistics and workplace rethinks drive demand; CBRE, the world’s largest commercial real estate services firm, manages over 6 billion sq ft globally (2024). CBRE’s execution depth wins global mandates and repeat scope, enabling scale advantages despite upfront delivery cash burn. Market growth and share leadership justify investment; keep staffing and technology stacked to stay ahead.
Industrial & logistics leasing and advisory
Industrial & logistics leasing and advisory remains a Stars market as e‑commerce penetration (≈22% global online retail share in 2024) plus nearshoring and inventory realignment sustain high demand across regions. CBRE leverages leading data, global coverage and deep tenant/investor ties—operating in 100+ countries and advising on roughly 7 billion sq ft of assets in 2024. Intense activity drives elevated resource needs but preserves market share; keep investing while the cycle is favorable.
Data centers and mission‑critical advisory
AI and cloud demand drove global data center capacity needs sharply higher in 2024, with the data center market estimated near $260 billion and hyperscale operators taking the lion’s share of new builds; CBRE’s specialized teams and developer/operator access position it as a front‑runner in mission‑critical advisory.
Delivering at pace requires talent and tooling, so the segment consumes cash as CBRE scales advisory and project services, yet strong demand and early‑innings market dynamics make the investment strategically justified.
- market: ~260B (2024)
- hyperscale share: majority of new capacity (2023–24)
- CBRE positioning: specialized teams + operator access
- cash profile: high upfront investment to scale delivery
- outlook: early innings, high growth potential
Sustainability solutions embedded in contracts
Clients demand real decarbonization, not disclosure-only programs; embedding ESG into IFM and PM mandates locks CBRE into recurring revenue and pricing premium. Building the toolkit and measurement layers requires significant investment but cements leadership as the market matures; buildings account for about 40% of global energy-related CO2 emissions (IEA).
- Embed ESG: locks recurring growth
- Investment: high upfront toolkit/measurement costs
- Market impact: leadership as buildings ~40% of emissions
Industrial, data center and ESG services driving high-growth real estate platforms
CBRE Stars (GWS, industrial, data centers, ESG services) combine high growth and market leadership; 2024 revenue ≈ $30B with GWS/industrial scaling recurring fees but heavy upfront investment; data center market ≈ $260B (2024) and e‑commerce ≈22% online retail share (2024); buildings ≈40% energy CO2.
| Metric | 2024 |
|---|---|
| CBRE revenue | $30B |
| Data center market | $260B |
| Managed sqft | 6–7B sqft |
| E‑commerce share | ≈22% |
| Buildings CO2 | ≈40% |
What is included in the product
Detailed Word Document
CBRE BCG Matrix maps units into Stars, Cash Cows, Question Marks, and Dogs with clear investment, hold, or divest guidance.
Customizable Excel Spreadsheet
One-page CBRE BCG Matrix placing units in quadrants—clean, C-level ready and exportable to PowerPoint for quick decks.
Cash Cows
Property management (recurring fee base)
CBREs property management arm sits on a large installed base, managing over 7 billion sq ft globally, with sticky, contractually recurring fees that drive predictable margins. Growth is low, but once platforms scale the business exhibits heavy operating leverage and strong free cash conversion. That reliable cash funds new bets; focus on process optimization and avoid overspending on client acquisition.
Valuation & appraisal services
Valuation & appraisal services are a core, regulated offering for CBRE and remain needed across cycles; as of 2024 CBRE is the largest global commercial real estate services firm, which underpins strong repeat demand and market share for these services.
Not high-growth, but highly cash generative relative to investment: standardized workflows and technology-led processes keep unit costs down and margins resilient versus more capital-intensive lines.
Loan servicing and asset administration
Loan servicing and asset administration deliver stable fee income tied to long‑lived portfolios, generating low‑single‑digit organic growth while client retention exceeds 90%. CBRE's scale and compliance infrastructure create high barriers to entry, allowing normalized margins and operational leverage. Growth is modest but predictable; prioritize efficiency and technology to milk cash flows and avoid unnecessary expansion capex.
Advisory for occupiers with embedded accounts
Advisory for occupiers with embedded accounts is a cash cow: leverages existing relationships to bundle strategy, portfolio optimization and transactions into renewals, driving mature, high-margin revenue with low incremental cost to serve; CBRE reported 2024 net revenue of $36.6 billion, with occupier services contributing a sizable, repeatable fee stream.
- Strategy-led cross-sell
- Portfolio optimization + transactions
- Low incremental cost to serve
- Senior coverage & renewals
CBRE Investment Management base fees
CBRE Investment Management base fees on committed capital deliver steady recurring revenue even when transactions slow; CBRE IM reported about 176.1 billion USD AUM as of June 30, 2024, which underpins fee income. Growth is moderate with strong margins; keep performance tight to resist fee erosion.
- Steady fees on committed capital
- 176.1 billion USD AUM (Jun 30, 2024)
- Moderate growth, strong margins
- Priority: prevent fee erosion via performance
Installed base + recurring fees drive steady margins and strong free cash flow
CBRE cash cows: large installed bases and recurring fees drive predictable margins and strong free cash flow (property mgmt 7B sq ft). Occupier services and valuation are stable, high-margin repeat revenue; CBRE IM AUM 176.1B (Jun 30, 2024). Prioritize efficiency, tech and cross-sell to sustain margins and avoid excess capex.
| Segment | Key metric | 2024 figure |
|---|---|---|
| Property Mgmt | Managed area | 7B sq ft |
| Occupier Services | Net revenue | $36.6B |
| CBRE IM | AUM (Jun 30) | $176.1B |
| Loan Servicing | Client retention | >90% |
Delivered as Shown
CBRE Group BCG Matrix
The file you're previewing is the exact CBRE Group BCG Matrix report you'll receive after purchase. No watermarks, no demo text—just the fully formatted, analysis-ready document meant for immediate use. It’s crafted for strategic clarity and market context, so there are no surprises. After payment you’ll get the same file to download, edit, print, or present right away.











