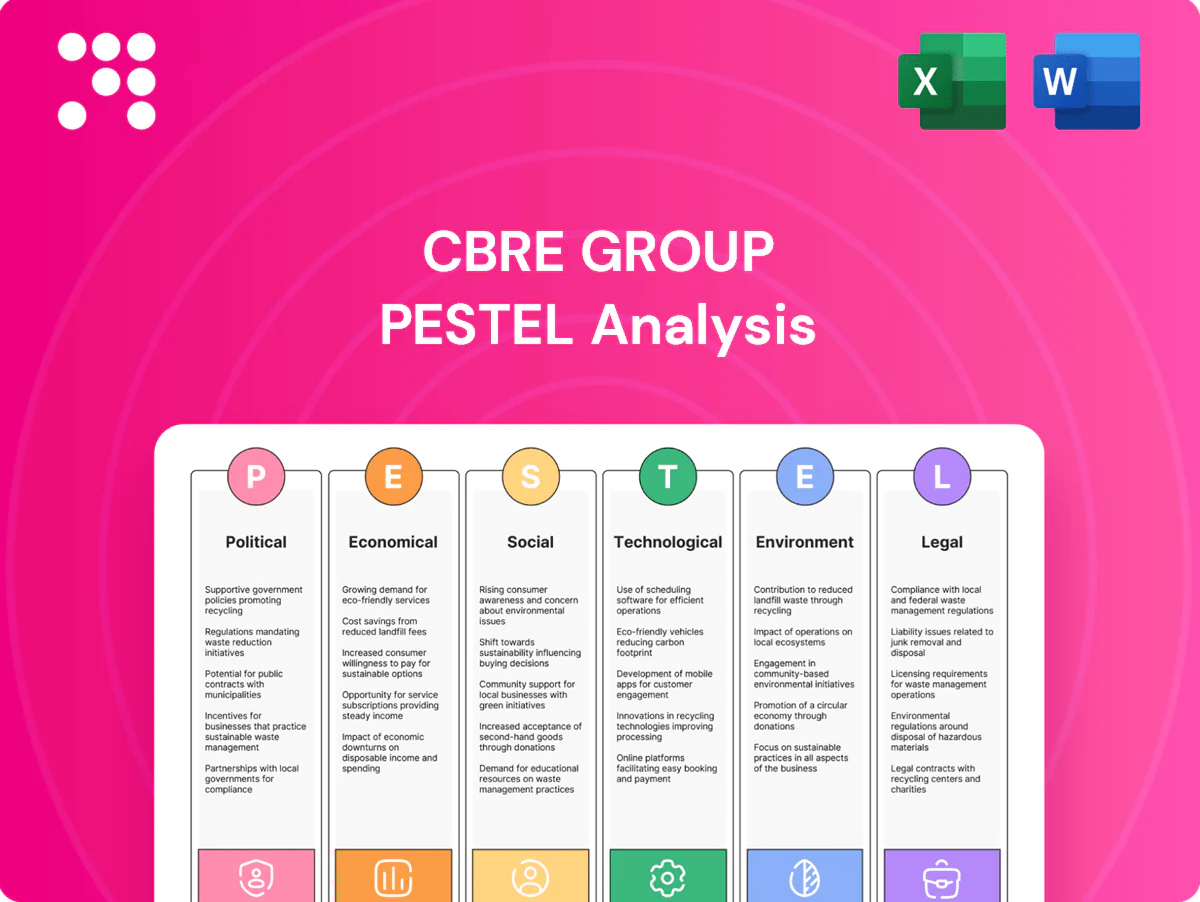
CBRE Group PESTLE Analysis

Skip the Research. Get the Strategy.
Our PESTLE Analysis of CBRE Group reveals how political shifts, economic cycles, social trends, technological disruption, legal changes, and environmental pressures converge to shape strategy and risk. Gain actionable foresight to refine investments and competitive plans. Purchase the full report to access the complete, ready-to-use breakdown instantly.
Political factors

Geopolitical stability and sanctions exposure
Heightened geopolitical tensions and expanding sanctions regimes have constrained cross-border capital, with UNCTAD reporting global FDI fell 12% to about $1.3 trillion in 2023, reducing liquidity that feeds CBRE’s investment-sales and IM mandates. Stricter compliance and screening prolong due diligence and can narrow buyer pools, increasing transaction fall-through risk. CBRE must maintain robust sanctions screening and provide country-risk advice to preserve deal certainty.
Urban policy, zoning, and permitting
City-level planning, rent controls and permitting timelines directly shape development pipelines and leasing velocity, with faster approvals boosting project-management demand and restrictive policies stalling transactions. Permitting delays often translate into higher holding costs and deferred leasing revenue. CBRE’s advisory teams help navigate entitlement risk and optimize site selection. CBRE operates in more than 100 countries to support clients globally.

Government real estate and infrastructure spending
Public-sector capex and PPPs, such as the US Bipartisan Infrastructure Law which commits roughly 550 billion dollars of new federal investment, generate steady facilities management, project management and valuation demand for CBRE. Shifts in fiscal priorities can expand or shrink these revenue streams as governments reallocate budgets. CBRE can align services with government modernization and resilience programs to capture long-term contracted work. Targeted public projects often require integrated advisory and delivery capabilities.

Tax policy and incentives
Trade policy and supply chain localization
Tariffs and reshoring reshape industrial demand, site selection, and logistics footprints; global average applied MFN tariffs ≈5% and US CHIPS Act funding ~$280 billion plus the Inflation Reduction Act ~$369 billion drive manufacturing nearshoring. This boosts demand for warehouse leasing, land brokerage, and project management. CBRE can use transaction and location analytics to reposition portfolios near growth corridors and major ports.
- Tariffs ≈5%
- CHIPS $280B
- IRA $369B
- Opportunities: warehouses, land, PM
Geopolitics squeeze cross-border liquidity; 1.3T USD FDI (2023) boosts leasing demand
Geopolitical tensions and sanctions reduced cross-border liquidity (UNCTAD: ~1.3 trillion USD FDI in 2023), raising due-diligence and deal-fall risk. City planning, rent controls and permitting timelines alter pipelines and holding costs, affecting leasing velocity. Public capex (US Infrastructure ~550B USD) and incentives (CHIPS 280B, IRA 369B) drive FM, PM and leasing demand.
| Factor | 2023–25 Data |
|---|---|
| Global FDI | ~1.3T USD (2023) |
| US Infrastructure | ~550B USD |
| CHIPS | ~280B USD |
| IRA | ~369B USD |
What is included in the product
 Detailed Word Document
Explores how Political, Economic, Social, Technological, Environmental and Legal forces uniquely affect CBRE Group, with each section backed by current data and trends to reflect real market and regulatory dynamics; designed for executives and advisors, the analysis is forward‑looking, ready to insert into business plans or decks to identify risks, opportunities and strategic responses.

 Customizable Excel Spreadsheet
A concise, PESTLE-segmented summary of CBRE Group that can be dropped into presentations, annotated for local context, and easily shared across teams to streamline external risk discussions and strategic planning.
Economic factors

Interest rates, inflation, and cap rates
Rising rate paths and sticky inflation (US Fed funds 5.25–5.50% in 2024, US CPI ~3.4% 2024) have pushed debt costs up and lifted valuation yields, with commercial cap rates climbing roughly 100–150 bps to the mid-6% range, reducing transaction volumes. Higher yields compress pricing and widen bid-ask spreads, dampening brokerage revenues. CBRE can pivot toward annuity-like services and distressed-advisory work during tightening cycles.
Global real estate cycle and liquidity
Cycles in office, industrial, retail, living and alternatives materially shift leasing and sales fee pools, with sector fee pools swinging double digits between peaks and troughs; liquidity troughs cut transaction volumes but raise repositioning, workouts and valuation demand. CBRE, operating in 100+ countries with ~120,000 employees (2024), benefits from a diversified service mix that helps smooth cyclicality and capture countercyclical advisory and valuation fees.

Corporate occupier cost optimization
Enterprise clients are consolidating footprints and optimizing costs amid margin pressure, with U.S. office vacancy near 18% in 2024 driving renegotiations and sublease activity. This elevates demand for portfolio strategy, workplace consulting and outsourcing as firms seek flexible, cost-saving models. CBRE, the largest commercial real estate services firm by revenue in 2024, can leverage GWS to capture multi-year integrated facilities and project management contracts.

Foreign exchange volatility
Currency moves directly affect CBRE’s reported revenues and cross-border investment choices, as the firm operates in more than 100 countries and translates local results into USD for reporting.
Active hedging programs and local pricing strategies help mitigate earnings volatility from FX swings and protect fee margins in volatile markets.
CBRE’s global platform enables rapid reallocation of personnel and capital toward stronger-currency demand centers to preserve profitability.
- Global footprint: 100+ countries
- Mitigants: hedging, local pricing
- Flexibility: resource reallocation
Structural growth in logistics and data economy
E-commerce and cloud adoption are driving strong industrial and data center demand: global e-commerce sales reached about $6.3 trillion in 2024 and public cloud spending was roughly $600 billion in 2023, prompting relentless warehouse and hyperscale capacity expansion; institutional capital into logistics and data centers topped $200 billion in 2024, underwriting development, leasing, and recurring investment-management fees, enabling CBRE to scale specialized teams and analytics to capture these flows.
- e-commerce sales ~6.3T (2024)
- public cloud ~$600B (2023)
- capital into logistics/data centers >$200B (2024)
Geopolitics squeeze cross-border liquidity; 1.3T USD FDI (2023) boosts leasing demand
Higher rates (Fed funds 5.25–5.50% 2024) and sticky inflation (US CPI ~3.4% 2024) raised cap rates ~100–150bps, compressing transaction volumes and brokerage revenue. Sector cycles shift fee pools—office vacancy ~18% (US 2024) boosts advisory/workout demand. E-commerce $6.3T (2024) and cloud ~$600B (2023) drive logistics and data center flows; CBRE’s 100+ country platform and ~120,000 staff capture diversified fees.
| Metric | Value |
|---|---|
| Fed funds (2024) | 5.25–5.50% |
| US CPI (2024) | ~3.4% |
| US office vacancy (2024) | ~18% |
| E‑commerce (2024) | $6.3T |
| Public cloud (2023) | $600B |
| Logistics/data center capital (2024) | >$200B |
Full Version Awaits
CBRE Group PESTLE Analysis
The CBRE Group PESTLE Analysis preview shown here is the exact document you’ll receive after purchase—fully formatted, professionally structured, and ready to use. No placeholders or teasers; the layout, content, and structure are identical to the downloadable file. After payment you’ll instantly get this same final document.

Skip the Research. Get the Strategy.
Our PESTLE Analysis of CBRE Group reveals how political shifts, economic cycles, social trends, technological disruption, legal changes, and environmental pressures converge to shape strategy and risk. Gain actionable foresight to refine investments and competitive plans. Purchase the full report to access the complete, ready-to-use breakdown instantly.
Political factors
Geopolitical stability and sanctions exposure
Heightened geopolitical tensions and expanding sanctions regimes have constrained cross-border capital, with UNCTAD reporting global FDI fell 12% to about $1.3 trillion in 2023, reducing liquidity that feeds CBRE’s investment-sales and IM mandates. Stricter compliance and screening prolong due diligence and can narrow buyer pools, increasing transaction fall-through risk. CBRE must maintain robust sanctions screening and provide country-risk advice to preserve deal certainty.
Urban policy, zoning, and permitting
City-level planning, rent controls and permitting timelines directly shape development pipelines and leasing velocity, with faster approvals boosting project-management demand and restrictive policies stalling transactions. Permitting delays often translate into higher holding costs and deferred leasing revenue. CBRE’s advisory teams help navigate entitlement risk and optimize site selection. CBRE operates in more than 100 countries to support clients globally.
Government real estate and infrastructure spending
Public-sector capex and PPPs, such as the US Bipartisan Infrastructure Law which commits roughly 550 billion dollars of new federal investment, generate steady facilities management, project management and valuation demand for CBRE. Shifts in fiscal priorities can expand or shrink these revenue streams as governments reallocate budgets. CBRE can align services with government modernization and resilience programs to capture long-term contracted work. Targeted public projects often require integrated advisory and delivery capabilities.
Tax policy and incentives
Trade policy and supply chain localization
Tariffs and reshoring reshape industrial demand, site selection, and logistics footprints; global average applied MFN tariffs ≈5% and US CHIPS Act funding ~$280 billion plus the Inflation Reduction Act ~$369 billion drive manufacturing nearshoring. This boosts demand for warehouse leasing, land brokerage, and project management. CBRE can use transaction and location analytics to reposition portfolios near growth corridors and major ports.
- Tariffs ≈5%
- CHIPS $280B
- IRA $369B
- Opportunities: warehouses, land, PM
Geopolitics squeeze cross-border liquidity; 1.3T USD FDI (2023) boosts leasing demand
Geopolitical tensions and sanctions reduced cross-border liquidity (UNCTAD: ~1.3 trillion USD FDI in 2023), raising due-diligence and deal-fall risk. City planning, rent controls and permitting timelines alter pipelines and holding costs, affecting leasing velocity. Public capex (US Infrastructure ~550B USD) and incentives (CHIPS 280B, IRA 369B) drive FM, PM and leasing demand.
| Factor | 2023–25 Data |
|---|---|
| Global FDI | ~1.3T USD (2023) |
| US Infrastructure | ~550B USD |
| CHIPS | ~280B USD |
| IRA | ~369B USD |
What is included in the product
Detailed Word Document
Explores how Political, Economic, Social, Technological, Environmental and Legal forces uniquely affect CBRE Group, with each section backed by current data and trends to reflect real market and regulatory dynamics; designed for executives and advisors, the analysis is forward‑looking, ready to insert into business plans or decks to identify risks, opportunities and strategic responses.
Customizable Excel Spreadsheet
A concise, PESTLE-segmented summary of CBRE Group that can be dropped into presentations, annotated for local context, and easily shared across teams to streamline external risk discussions and strategic planning.
Economic factors
Interest rates, inflation, and cap rates
Rising rate paths and sticky inflation (US Fed funds 5.25–5.50% in 2024, US CPI ~3.4% 2024) have pushed debt costs up and lifted valuation yields, with commercial cap rates climbing roughly 100–150 bps to the mid-6% range, reducing transaction volumes. Higher yields compress pricing and widen bid-ask spreads, dampening brokerage revenues. CBRE can pivot toward annuity-like services and distressed-advisory work during tightening cycles.
Global real estate cycle and liquidity
Cycles in office, industrial, retail, living and alternatives materially shift leasing and sales fee pools, with sector fee pools swinging double digits between peaks and troughs; liquidity troughs cut transaction volumes but raise repositioning, workouts and valuation demand. CBRE, operating in 100+ countries with ~120,000 employees (2024), benefits from a diversified service mix that helps smooth cyclicality and capture countercyclical advisory and valuation fees.
Corporate occupier cost optimization
Enterprise clients are consolidating footprints and optimizing costs amid margin pressure, with U.S. office vacancy near 18% in 2024 driving renegotiations and sublease activity. This elevates demand for portfolio strategy, workplace consulting and outsourcing as firms seek flexible, cost-saving models. CBRE, the largest commercial real estate services firm by revenue in 2024, can leverage GWS to capture multi-year integrated facilities and project management contracts.
Foreign exchange volatility
Currency moves directly affect CBRE’s reported revenues and cross-border investment choices, as the firm operates in more than 100 countries and translates local results into USD for reporting.
Active hedging programs and local pricing strategies help mitigate earnings volatility from FX swings and protect fee margins in volatile markets.
CBRE’s global platform enables rapid reallocation of personnel and capital toward stronger-currency demand centers to preserve profitability.
- Global footprint: 100+ countries
- Mitigants: hedging, local pricing
- Flexibility: resource reallocation
Structural growth in logistics and data economy
E-commerce and cloud adoption are driving strong industrial and data center demand: global e-commerce sales reached about $6.3 trillion in 2024 and public cloud spending was roughly $600 billion in 2023, prompting relentless warehouse and hyperscale capacity expansion; institutional capital into logistics and data centers topped $200 billion in 2024, underwriting development, leasing, and recurring investment-management fees, enabling CBRE to scale specialized teams and analytics to capture these flows.
- e-commerce sales ~6.3T (2024)
- public cloud ~$600B (2023)
- capital into logistics/data centers >$200B (2024)
Geopolitics squeeze cross-border liquidity; 1.3T USD FDI (2023) boosts leasing demand
Higher rates (Fed funds 5.25–5.50% 2024) and sticky inflation (US CPI ~3.4% 2024) raised cap rates ~100–150bps, compressing transaction volumes and brokerage revenue. Sector cycles shift fee pools—office vacancy ~18% (US 2024) boosts advisory/workout demand. E-commerce $6.3T (2024) and cloud ~$600B (2023) drive logistics and data center flows; CBRE’s 100+ country platform and ~120,000 staff capture diversified fees.
| Metric | Value |
|---|---|
| Fed funds (2024) | 5.25–5.50% |
| US CPI (2024) | ~3.4% |
| US office vacancy (2024) | ~18% |
| E‑commerce (2024) | $6.3T |
| Public cloud (2023) | $600B |
| Logistics/data center capital (2024) | >$200B |
Full Version Awaits
CBRE Group PESTLE Analysis
The CBRE Group PESTLE Analysis preview shown here is the exact document you’ll receive after purchase—fully formatted, professionally structured, and ready to use. No placeholders or teasers; the layout, content, and structure are identical to the downloadable file. After payment you’ll instantly get this same final document.
Original: $10.00
-65%$10.00
$3.50Description
Skip the Research. Get the Strategy.
Our PESTLE Analysis of CBRE Group reveals how political shifts, economic cycles, social trends, technological disruption, legal changes, and environmental pressures converge to shape strategy and risk. Gain actionable foresight to refine investments and competitive plans. Purchase the full report to access the complete, ready-to-use breakdown instantly.
Political factors
Geopolitical stability and sanctions exposure
Heightened geopolitical tensions and expanding sanctions regimes have constrained cross-border capital, with UNCTAD reporting global FDI fell 12% to about $1.3 trillion in 2023, reducing liquidity that feeds CBRE’s investment-sales and IM mandates. Stricter compliance and screening prolong due diligence and can narrow buyer pools, increasing transaction fall-through risk. CBRE must maintain robust sanctions screening and provide country-risk advice to preserve deal certainty.
Urban policy, zoning, and permitting
City-level planning, rent controls and permitting timelines directly shape development pipelines and leasing velocity, with faster approvals boosting project-management demand and restrictive policies stalling transactions. Permitting delays often translate into higher holding costs and deferred leasing revenue. CBRE’s advisory teams help navigate entitlement risk and optimize site selection. CBRE operates in more than 100 countries to support clients globally.
Government real estate and infrastructure spending
Public-sector capex and PPPs, such as the US Bipartisan Infrastructure Law which commits roughly 550 billion dollars of new federal investment, generate steady facilities management, project management and valuation demand for CBRE. Shifts in fiscal priorities can expand or shrink these revenue streams as governments reallocate budgets. CBRE can align services with government modernization and resilience programs to capture long-term contracted work. Targeted public projects often require integrated advisory and delivery capabilities.
Tax policy and incentives
Trade policy and supply chain localization
Tariffs and reshoring reshape industrial demand, site selection, and logistics footprints; global average applied MFN tariffs ≈5% and US CHIPS Act funding ~$280 billion plus the Inflation Reduction Act ~$369 billion drive manufacturing nearshoring. This boosts demand for warehouse leasing, land brokerage, and project management. CBRE can use transaction and location analytics to reposition portfolios near growth corridors and major ports.
- Tariffs ≈5%
- CHIPS $280B
- IRA $369B
- Opportunities: warehouses, land, PM
Geopolitics squeeze cross-border liquidity; 1.3T USD FDI (2023) boosts leasing demand
Geopolitical tensions and sanctions reduced cross-border liquidity (UNCTAD: ~1.3 trillion USD FDI in 2023), raising due-diligence and deal-fall risk. City planning, rent controls and permitting timelines alter pipelines and holding costs, affecting leasing velocity. Public capex (US Infrastructure ~550B USD) and incentives (CHIPS 280B, IRA 369B) drive FM, PM and leasing demand.
| Factor | 2023–25 Data |
|---|---|
| Global FDI | ~1.3T USD (2023) |
| US Infrastructure | ~550B USD |
| CHIPS | ~280B USD |
| IRA | ~369B USD |
What is included in the product
Detailed Word Document
Explores how Political, Economic, Social, Technological, Environmental and Legal forces uniquely affect CBRE Group, with each section backed by current data and trends to reflect real market and regulatory dynamics; designed for executives and advisors, the analysis is forward‑looking, ready to insert into business plans or decks to identify risks, opportunities and strategic responses.
Customizable Excel Spreadsheet
A concise, PESTLE-segmented summary of CBRE Group that can be dropped into presentations, annotated for local context, and easily shared across teams to streamline external risk discussions and strategic planning.
Economic factors
Interest rates, inflation, and cap rates
Rising rate paths and sticky inflation (US Fed funds 5.25–5.50% in 2024, US CPI ~3.4% 2024) have pushed debt costs up and lifted valuation yields, with commercial cap rates climbing roughly 100–150 bps to the mid-6% range, reducing transaction volumes. Higher yields compress pricing and widen bid-ask spreads, dampening brokerage revenues. CBRE can pivot toward annuity-like services and distressed-advisory work during tightening cycles.
Global real estate cycle and liquidity
Cycles in office, industrial, retail, living and alternatives materially shift leasing and sales fee pools, with sector fee pools swinging double digits between peaks and troughs; liquidity troughs cut transaction volumes but raise repositioning, workouts and valuation demand. CBRE, operating in 100+ countries with ~120,000 employees (2024), benefits from a diversified service mix that helps smooth cyclicality and capture countercyclical advisory and valuation fees.
Corporate occupier cost optimization
Enterprise clients are consolidating footprints and optimizing costs amid margin pressure, with U.S. office vacancy near 18% in 2024 driving renegotiations and sublease activity. This elevates demand for portfolio strategy, workplace consulting and outsourcing as firms seek flexible, cost-saving models. CBRE, the largest commercial real estate services firm by revenue in 2024, can leverage GWS to capture multi-year integrated facilities and project management contracts.
Foreign exchange volatility
Currency moves directly affect CBRE’s reported revenues and cross-border investment choices, as the firm operates in more than 100 countries and translates local results into USD for reporting.
Active hedging programs and local pricing strategies help mitigate earnings volatility from FX swings and protect fee margins in volatile markets.
CBRE’s global platform enables rapid reallocation of personnel and capital toward stronger-currency demand centers to preserve profitability.
- Global footprint: 100+ countries
- Mitigants: hedging, local pricing
- Flexibility: resource reallocation
Structural growth in logistics and data economy
E-commerce and cloud adoption are driving strong industrial and data center demand: global e-commerce sales reached about $6.3 trillion in 2024 and public cloud spending was roughly $600 billion in 2023, prompting relentless warehouse and hyperscale capacity expansion; institutional capital into logistics and data centers topped $200 billion in 2024, underwriting development, leasing, and recurring investment-management fees, enabling CBRE to scale specialized teams and analytics to capture these flows.
- e-commerce sales ~6.3T (2024)
- public cloud ~$600B (2023)
- capital into logistics/data centers >$200B (2024)
Geopolitics squeeze cross-border liquidity; 1.3T USD FDI (2023) boosts leasing demand
Higher rates (Fed funds 5.25–5.50% 2024) and sticky inflation (US CPI ~3.4% 2024) raised cap rates ~100–150bps, compressing transaction volumes and brokerage revenue. Sector cycles shift fee pools—office vacancy ~18% (US 2024) boosts advisory/workout demand. E-commerce $6.3T (2024) and cloud ~$600B (2023) drive logistics and data center flows; CBRE’s 100+ country platform and ~120,000 staff capture diversified fees.
| Metric | Value |
|---|---|
| Fed funds (2024) | 5.25–5.50% |
| US CPI (2024) | ~3.4% |
| US office vacancy (2024) | ~18% |
| E‑commerce (2024) | $6.3T |
| Public cloud (2023) | $600B |
| Logistics/data center capital (2024) | >$200B |
Full Version Awaits
CBRE Group PESTLE Analysis
The CBRE Group PESTLE Analysis preview shown here is the exact document you’ll receive after purchase—fully formatted, professionally structured, and ready to use. No placeholders or teasers; the layout, content, and structure are identical to the downloadable file. After payment you’ll instantly get this same final document.











