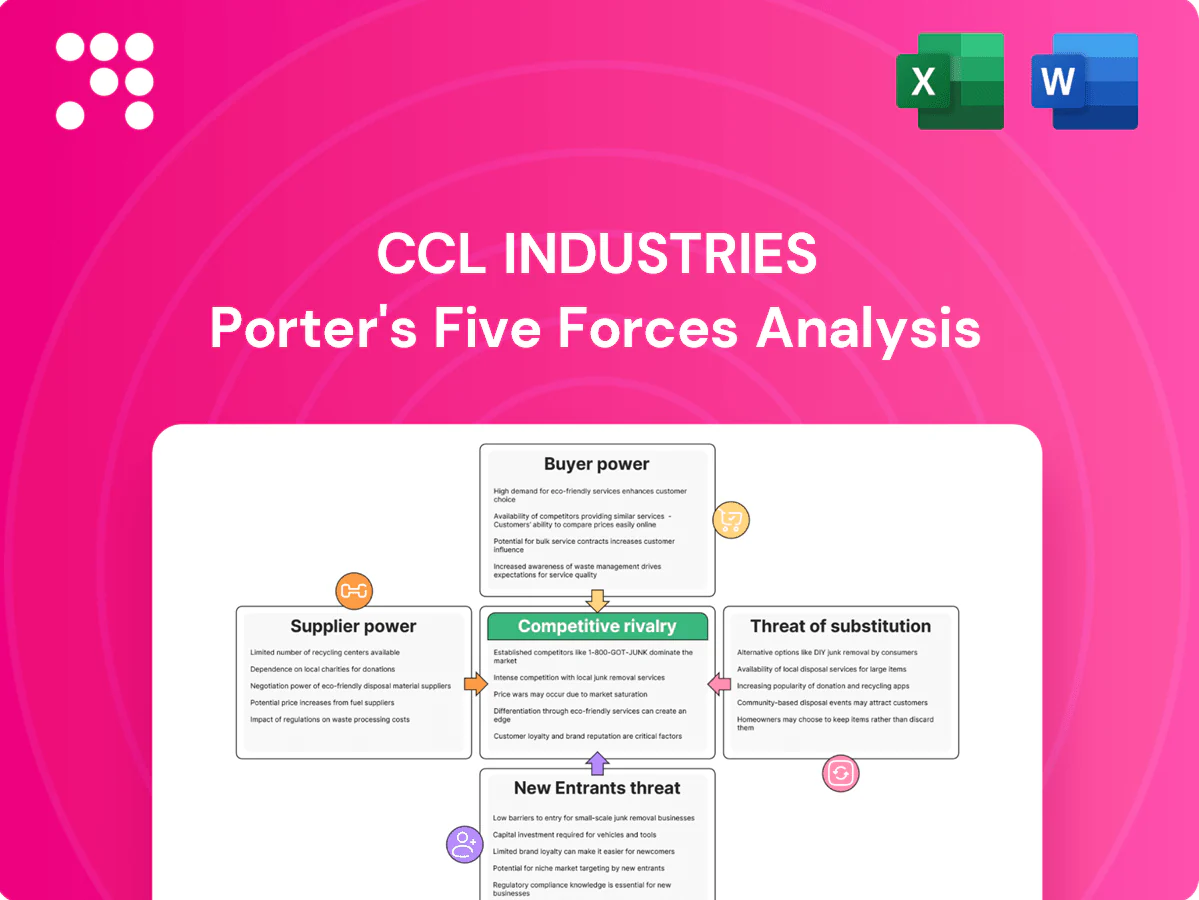
CCL Industries Porter's Five Forces Analysis

A Must-Have Tool for Decision-Makers
CCL Industries faces moderate supplier power, intense buyer expectations, and evolving substitute threats as packaging innovations reshape demand. Its scale and diversified end-markets cushion competitive rivalry but leave margin pressure from raw material volatility. Regulatory shifts and technological change raise entry and exit considerations for niche players. This brief snapshot only scratches the surface—unlock the full Porter's Five Forces Analysis to explore CCL Industries’s competitive dynamics in detail.
Suppliers Bargaining Power

Concentrated petrochemical inputs
CCL relies on resins, films, adhesives, inks and aluminum sourced from a relatively concentrated group of global chemical and materials suppliers, which raises switching costs and input pricing power. Tight petrochemical feedstock markets in 2024 (Brent ~83 USD/bbl) amplified input cost volatility. CCL's use of long-term contracts and multi-sourcing per 2024 disclosures partially mitigates supplier concentration risk.
Volatile raw material pricing
Oil- and energy-linked inputs (Brent averaged about 86 USD/bbl in 2024) make CCL Industries’ costs vulnerable to cyclical and geopolitical swings; resin and solvent exposure in the label/packaging sector typically represents roughly 30–40% of input costs. Pass-through pricing exists but often lags, compressing margins during price spikes; hedging and inventory management historically reduce volatility impact.

Specialty materials and specs
Healthcare, automotive and security labels demand highly specified substrates and adhesives, and qualification processes leave only a few qualified suppliers, increasing supplier leverage. CCL’s scale—approximately 170 manufacturing sites—and CAD 6.5 billion revenue in FY2024 enable technical co-development and long-term contracts that stabilize supply. These factors reduce dependence on single vendors and mitigate supplier bargaining power despite specialty-spec constraints.

Sustainability and compliance pressure
Sustainability-driven demand for recyclable, bio-based and low-VOC inputs narrows supplier pools, raising costs and lead-time risk; CCL Industries reported approximately CAD 5.0 billion revenue in fiscal 2024, intensifying procurement scrutiny for compliant inputs. Regulatory burdens (REACH, FDA, pharma GMP) increase documentation and audit costs, while preferred partnerships with certified vendors mitigate scarcity and quality risk.
- Supplier pool contraction: fewer certified low-VOC/bio suppliers
- Regulatory load: REACH/FDA/GMP escalate compliance costs
- Mitigation: preferred/vendor partnerships reduce scarcity risk
Global footprint, local redundancy
CCL’s global footprint—operations in over 40 countries—enables regional supplier diversification, lowering concentration risk; FY2024 revenue was about CAD 6.3 billion and the company employs ~23,000 people, supporting scale in procurement. Localized sourcing cuts logistics exposure and lead-time dependence, while formal dual‑sourcing strategies reduce leverage of any single supplier.
- Geographic reach: >40 countries
- Scale: CAD 6.3B revenue (FY2024)
- Risk control: dual-sourcing limits supplier power
Moderate supplier power: resin/solvent volatility cuts margins despite scale and contracts
CCL faces moderate supplier power: concentrated resin/film/adhesive suppliers and 2024 Brent ~86 USD/bbl raise input volatility; resin/solvent exposure ~30–40% compresses margins during spikes. Long‑term contracts, multi‑sourcing across ~170 sites and CAD 6.3B FY2024 revenue mitigate risk. Specialty/spec requirements and bio‑based supplier scarcity maintain pockets of higher leverage.
| Metric | 2024 |
|---|---|
| Brent (USD/bbl) | ~86 |
| FY Revenue (CAD) | 6.3B |
| Manufacturing sites | ~170 |
| Resin/solvent share | 30–40% |
What is included in the product
 Detailed Word Document
Tailored Porter's Five Forces analysis for CCL Industries, uncovering competitive intensity, buyer and supplier leverage, substitution risks, and entry barriers, with strategic commentary on disruptive threats and protective advantages to inform investor and management decisions.

 Customizable Excel Spreadsheet
A clear, one-sheet Porter's Five Forces for CCL Industries—condensed supplier, buyer, rivalry, substitutes and entry pressures for quick strategic decisions and M&A screening.
Customers Bargaining Power

Large, concentrated brand owners
Global CPGs, pharma, electronics and auto OEMs buy labels at scale and run competitive tenders; large buyers such as P&G (net sales $82.4B in fiscal 2024) exert strong pricing leverage and demand strict service levels. CCL mitigates this through multi-year contracts, diversified customer base and 30+ country global service coverage, retaining negotiated margins and continuity of supply.
Moderate switching costs
Labels often appear interchangeable, but requalification, regulatory validation and line-change costs create moderate switching costs for CCL; FY2024 sales were CAD 6.4 billion, with significant exposure to pharma and auto where mission-critical specs raise risk aversion. Value-added features such as security and functional coatings increase customer stickiness over time.

Customization and co-development
Collaborative design of functional, security and RFID solutions embeds CCL into customer workflows, making switching costly and reducing buyer alternatives. The global RFID market reached about US$14.8 billion in 2024, accelerating demand for embedded label solutions. This integration supports premium pricing and higher retention, reinforcing CCL’s revenue resilience (CCL reported CAD 6.5 billion in 2024 sales).

Price transparency, spec competition
- price-transparency
- multi-sourcing ≈65%
- scale CAD 6.3B FY2024
- diff: performance/speed/service
Service, reliability, and global SLAs
Service, reliability and global SLAs drive buyer decisions: on-time delivery, quality KPIs and technical support are critical because failures create high line-down and compliance costs that temper aggressive switching. CCL’s global SLAs and multi-region footprint—reported revenue CAD 5.9 billion in fiscal 2024—plus a track record of consistent delivery moderate customer bargaining power.
Buyer-led pricing vs scale CAD 6.4B, ≈65% multi-sourcing
Global CPGs/pharma/electronics and auto OEMs (e.g., P&G net sales $82.4B in FY2024) drive strong pricing pressure via tenders; CCL’s FY2024 revenue CAD 6.4B shows scale but buyer leverage. Requalification, regulatory validation and value-added features (RFID) raise switching costs and support premiums, yet ≈65% multi-sourcing sustains price pressure.
| Metric | Value |
|---|---|
| CCL FY2024 revenue | CAD 6.4B |
| Major buyer example | P&G sales $82.4B (FY2024) |
| Global RFID market (2024) | US$14.8B |
| Industry multi-sourcing | ≈65% |
Preview the Actual Deliverable
CCL Industries Porter's Five Forces Analysis
This preview shows the exact CCL Industries Porter’s Five Forces analysis you'll receive—no samples or placeholders. The full document is professionally formatted, ready for download and immediate use upon purchase. It contains the complete competitive-force assessment and actionable insights for strategic decisions.

A Must-Have Tool for Decision-Makers
CCL Industries faces moderate supplier power, intense buyer expectations, and evolving substitute threats as packaging innovations reshape demand. Its scale and diversified end-markets cushion competitive rivalry but leave margin pressure from raw material volatility. Regulatory shifts and technological change raise entry and exit considerations for niche players. This brief snapshot only scratches the surface—unlock the full Porter's Five Forces Analysis to explore CCL Industries’s competitive dynamics in detail.
Suppliers Bargaining Power
Concentrated petrochemical inputs
CCL relies on resins, films, adhesives, inks and aluminum sourced from a relatively concentrated group of global chemical and materials suppliers, which raises switching costs and input pricing power. Tight petrochemical feedstock markets in 2024 (Brent ~83 USD/bbl) amplified input cost volatility. CCL's use of long-term contracts and multi-sourcing per 2024 disclosures partially mitigates supplier concentration risk.
Volatile raw material pricing
Oil- and energy-linked inputs (Brent averaged about 86 USD/bbl in 2024) make CCL Industries’ costs vulnerable to cyclical and geopolitical swings; resin and solvent exposure in the label/packaging sector typically represents roughly 30–40% of input costs. Pass-through pricing exists but often lags, compressing margins during price spikes; hedging and inventory management historically reduce volatility impact.
Specialty materials and specs
Healthcare, automotive and security labels demand highly specified substrates and adhesives, and qualification processes leave only a few qualified suppliers, increasing supplier leverage. CCL’s scale—approximately 170 manufacturing sites—and CAD 6.5 billion revenue in FY2024 enable technical co-development and long-term contracts that stabilize supply. These factors reduce dependence on single vendors and mitigate supplier bargaining power despite specialty-spec constraints.
Sustainability and compliance pressure
Sustainability-driven demand for recyclable, bio-based and low-VOC inputs narrows supplier pools, raising costs and lead-time risk; CCL Industries reported approximately CAD 5.0 billion revenue in fiscal 2024, intensifying procurement scrutiny for compliant inputs. Regulatory burdens (REACH, FDA, pharma GMP) increase documentation and audit costs, while preferred partnerships with certified vendors mitigate scarcity and quality risk.
- Supplier pool contraction: fewer certified low-VOC/bio suppliers
- Regulatory load: REACH/FDA/GMP escalate compliance costs
- Mitigation: preferred/vendor partnerships reduce scarcity risk
Global footprint, local redundancy
CCL’s global footprint—operations in over 40 countries—enables regional supplier diversification, lowering concentration risk; FY2024 revenue was about CAD 6.3 billion and the company employs ~23,000 people, supporting scale in procurement. Localized sourcing cuts logistics exposure and lead-time dependence, while formal dual‑sourcing strategies reduce leverage of any single supplier.
- Geographic reach: >40 countries
- Scale: CAD 6.3B revenue (FY2024)
- Risk control: dual-sourcing limits supplier power
Moderate supplier power: resin/solvent volatility cuts margins despite scale and contracts
CCL faces moderate supplier power: concentrated resin/film/adhesive suppliers and 2024 Brent ~86 USD/bbl raise input volatility; resin/solvent exposure ~30–40% compresses margins during spikes. Long‑term contracts, multi‑sourcing across ~170 sites and CAD 6.3B FY2024 revenue mitigate risk. Specialty/spec requirements and bio‑based supplier scarcity maintain pockets of higher leverage.
| Metric | 2024 |
|---|---|
| Brent (USD/bbl) | ~86 |
| FY Revenue (CAD) | 6.3B |
| Manufacturing sites | ~170 |
| Resin/solvent share | 30–40% |
What is included in the product
Detailed Word Document
Tailored Porter's Five Forces analysis for CCL Industries, uncovering competitive intensity, buyer and supplier leverage, substitution risks, and entry barriers, with strategic commentary on disruptive threats and protective advantages to inform investor and management decisions.
Customizable Excel Spreadsheet
A clear, one-sheet Porter's Five Forces for CCL Industries—condensed supplier, buyer, rivalry, substitutes and entry pressures for quick strategic decisions and M&A screening.
Customers Bargaining Power
Large, concentrated brand owners
Global CPGs, pharma, electronics and auto OEMs buy labels at scale and run competitive tenders; large buyers such as P&G (net sales $82.4B in fiscal 2024) exert strong pricing leverage and demand strict service levels. CCL mitigates this through multi-year contracts, diversified customer base and 30+ country global service coverage, retaining negotiated margins and continuity of supply.
Moderate switching costs
Labels often appear interchangeable, but requalification, regulatory validation and line-change costs create moderate switching costs for CCL; FY2024 sales were CAD 6.4 billion, with significant exposure to pharma and auto where mission-critical specs raise risk aversion. Value-added features such as security and functional coatings increase customer stickiness over time.
Customization and co-development
Collaborative design of functional, security and RFID solutions embeds CCL into customer workflows, making switching costly and reducing buyer alternatives. The global RFID market reached about US$14.8 billion in 2024, accelerating demand for embedded label solutions. This integration supports premium pricing and higher retention, reinforcing CCL’s revenue resilience (CCL reported CAD 6.5 billion in 2024 sales).
Price transparency, spec competition
- price-transparency
- multi-sourcing ≈65%
- scale CAD 6.3B FY2024
- diff: performance/speed/service
Service, reliability, and global SLAs
Service, reliability and global SLAs drive buyer decisions: on-time delivery, quality KPIs and technical support are critical because failures create high line-down and compliance costs that temper aggressive switching. CCL’s global SLAs and multi-region footprint—reported revenue CAD 5.9 billion in fiscal 2024—plus a track record of consistent delivery moderate customer bargaining power.
Buyer-led pricing vs scale CAD 6.4B, ≈65% multi-sourcing
Global CPGs/pharma/electronics and auto OEMs (e.g., P&G net sales $82.4B in FY2024) drive strong pricing pressure via tenders; CCL’s FY2024 revenue CAD 6.4B shows scale but buyer leverage. Requalification, regulatory validation and value-added features (RFID) raise switching costs and support premiums, yet ≈65% multi-sourcing sustains price pressure.
| Metric | Value |
|---|---|
| CCL FY2024 revenue | CAD 6.4B |
| Major buyer example | P&G sales $82.4B (FY2024) |
| Global RFID market (2024) | US$14.8B |
| Industry multi-sourcing | ≈65% |
Preview the Actual Deliverable
CCL Industries Porter's Five Forces Analysis
This preview shows the exact CCL Industries Porter’s Five Forces analysis you'll receive—no samples or placeholders. The full document is professionally formatted, ready for download and immediate use upon purchase. It contains the complete competitive-force assessment and actionable insights for strategic decisions.
Original: $10.00
-65%$10.00
$3.50Description
A Must-Have Tool for Decision-Makers
CCL Industries faces moderate supplier power, intense buyer expectations, and evolving substitute threats as packaging innovations reshape demand. Its scale and diversified end-markets cushion competitive rivalry but leave margin pressure from raw material volatility. Regulatory shifts and technological change raise entry and exit considerations for niche players. This brief snapshot only scratches the surface—unlock the full Porter's Five Forces Analysis to explore CCL Industries’s competitive dynamics in detail.
Suppliers Bargaining Power
Concentrated petrochemical inputs
CCL relies on resins, films, adhesives, inks and aluminum sourced from a relatively concentrated group of global chemical and materials suppliers, which raises switching costs and input pricing power. Tight petrochemical feedstock markets in 2024 (Brent ~83 USD/bbl) amplified input cost volatility. CCL's use of long-term contracts and multi-sourcing per 2024 disclosures partially mitigates supplier concentration risk.
Volatile raw material pricing
Oil- and energy-linked inputs (Brent averaged about 86 USD/bbl in 2024) make CCL Industries’ costs vulnerable to cyclical and geopolitical swings; resin and solvent exposure in the label/packaging sector typically represents roughly 30–40% of input costs. Pass-through pricing exists but often lags, compressing margins during price spikes; hedging and inventory management historically reduce volatility impact.
Specialty materials and specs
Healthcare, automotive and security labels demand highly specified substrates and adhesives, and qualification processes leave only a few qualified suppliers, increasing supplier leverage. CCL’s scale—approximately 170 manufacturing sites—and CAD 6.5 billion revenue in FY2024 enable technical co-development and long-term contracts that stabilize supply. These factors reduce dependence on single vendors and mitigate supplier bargaining power despite specialty-spec constraints.
Sustainability and compliance pressure
Sustainability-driven demand for recyclable, bio-based and low-VOC inputs narrows supplier pools, raising costs and lead-time risk; CCL Industries reported approximately CAD 5.0 billion revenue in fiscal 2024, intensifying procurement scrutiny for compliant inputs. Regulatory burdens (REACH, FDA, pharma GMP) increase documentation and audit costs, while preferred partnerships with certified vendors mitigate scarcity and quality risk.
- Supplier pool contraction: fewer certified low-VOC/bio suppliers
- Regulatory load: REACH/FDA/GMP escalate compliance costs
- Mitigation: preferred/vendor partnerships reduce scarcity risk
Global footprint, local redundancy
CCL’s global footprint—operations in over 40 countries—enables regional supplier diversification, lowering concentration risk; FY2024 revenue was about CAD 6.3 billion and the company employs ~23,000 people, supporting scale in procurement. Localized sourcing cuts logistics exposure and lead-time dependence, while formal dual‑sourcing strategies reduce leverage of any single supplier.
- Geographic reach: >40 countries
- Scale: CAD 6.3B revenue (FY2024)
- Risk control: dual-sourcing limits supplier power
Moderate supplier power: resin/solvent volatility cuts margins despite scale and contracts
CCL faces moderate supplier power: concentrated resin/film/adhesive suppliers and 2024 Brent ~86 USD/bbl raise input volatility; resin/solvent exposure ~30–40% compresses margins during spikes. Long‑term contracts, multi‑sourcing across ~170 sites and CAD 6.3B FY2024 revenue mitigate risk. Specialty/spec requirements and bio‑based supplier scarcity maintain pockets of higher leverage.
| Metric | 2024 |
|---|---|
| Brent (USD/bbl) | ~86 |
| FY Revenue (CAD) | 6.3B |
| Manufacturing sites | ~170 |
| Resin/solvent share | 30–40% |
What is included in the product
Detailed Word Document
Tailored Porter's Five Forces analysis for CCL Industries, uncovering competitive intensity, buyer and supplier leverage, substitution risks, and entry barriers, with strategic commentary on disruptive threats and protective advantages to inform investor and management decisions.
Customizable Excel Spreadsheet
A clear, one-sheet Porter's Five Forces for CCL Industries—condensed supplier, buyer, rivalry, substitutes and entry pressures for quick strategic decisions and M&A screening.
Customers Bargaining Power
Large, concentrated brand owners
Global CPGs, pharma, electronics and auto OEMs buy labels at scale and run competitive tenders; large buyers such as P&G (net sales $82.4B in fiscal 2024) exert strong pricing leverage and demand strict service levels. CCL mitigates this through multi-year contracts, diversified customer base and 30+ country global service coverage, retaining negotiated margins and continuity of supply.
Moderate switching costs
Labels often appear interchangeable, but requalification, regulatory validation and line-change costs create moderate switching costs for CCL; FY2024 sales were CAD 6.4 billion, with significant exposure to pharma and auto where mission-critical specs raise risk aversion. Value-added features such as security and functional coatings increase customer stickiness over time.
Customization and co-development
Collaborative design of functional, security and RFID solutions embeds CCL into customer workflows, making switching costly and reducing buyer alternatives. The global RFID market reached about US$14.8 billion in 2024, accelerating demand for embedded label solutions. This integration supports premium pricing and higher retention, reinforcing CCL’s revenue resilience (CCL reported CAD 6.5 billion in 2024 sales).
Price transparency, spec competition
- price-transparency
- multi-sourcing ≈65%
- scale CAD 6.3B FY2024
- diff: performance/speed/service
Service, reliability, and global SLAs
Service, reliability and global SLAs drive buyer decisions: on-time delivery, quality KPIs and technical support are critical because failures create high line-down and compliance costs that temper aggressive switching. CCL’s global SLAs and multi-region footprint—reported revenue CAD 5.9 billion in fiscal 2024—plus a track record of consistent delivery moderate customer bargaining power.
Buyer-led pricing vs scale CAD 6.4B, ≈65% multi-sourcing
Global CPGs/pharma/electronics and auto OEMs (e.g., P&G net sales $82.4B in FY2024) drive strong pricing pressure via tenders; CCL’s FY2024 revenue CAD 6.4B shows scale but buyer leverage. Requalification, regulatory validation and value-added features (RFID) raise switching costs and support premiums, yet ≈65% multi-sourcing sustains price pressure.
| Metric | Value |
|---|---|
| CCL FY2024 revenue | CAD 6.4B |
| Major buyer example | P&G sales $82.4B (FY2024) |
| Global RFID market (2024) | US$14.8B |
| Industry multi-sourcing | ≈65% |
Preview the Actual Deliverable
CCL Industries Porter's Five Forces Analysis
This preview shows the exact CCL Industries Porter’s Five Forces analysis you'll receive—no samples or placeholders. The full document is professionally formatted, ready for download and immediate use upon purchase. It contains the complete competitive-force assessment and actionable insights for strategic decisions.











