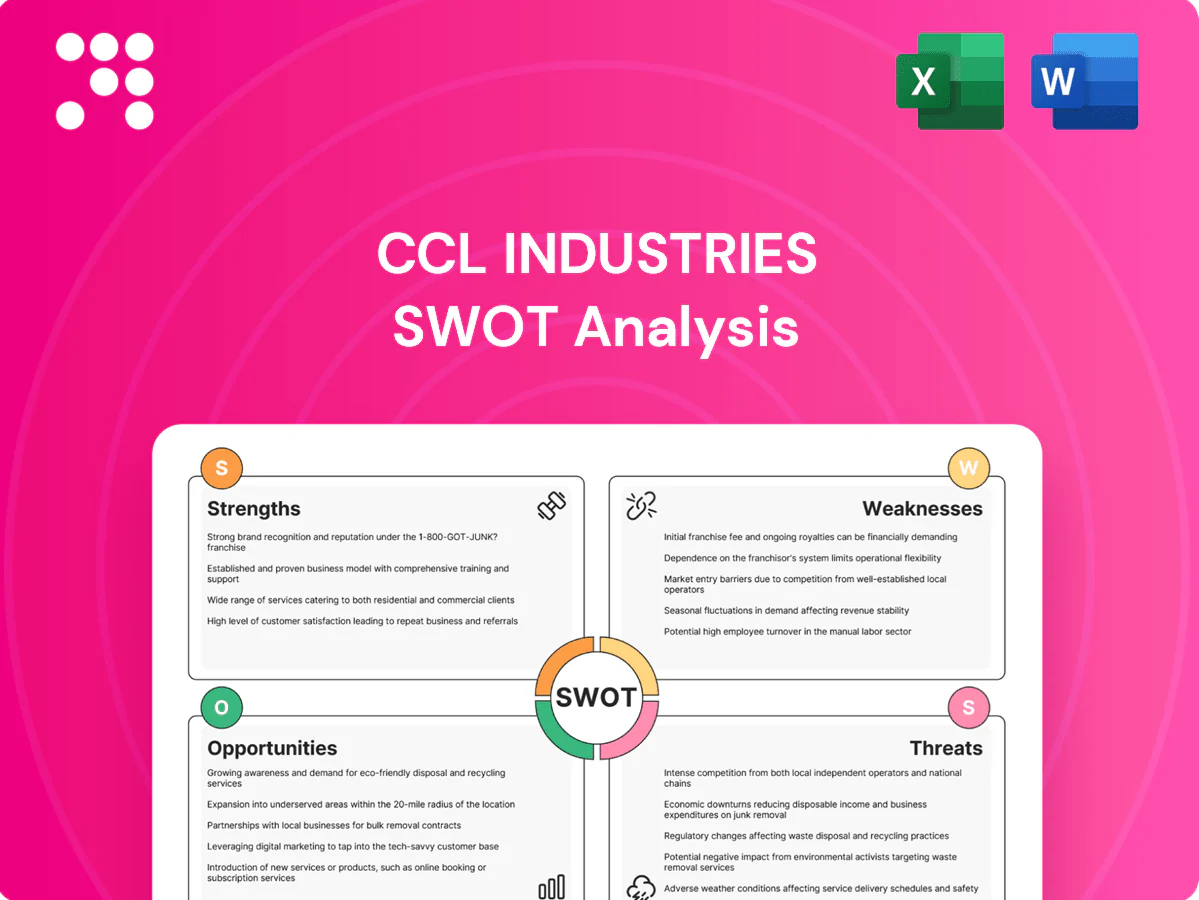
CCL Industries SWOT Analysis

Dive Deeper Into the Company’s Strategic Blueprint
CCL Industries shows strong global packaging and labeling capabilities, durable customer relationships, and innovative specialty films, but faces input-cost volatility and intense competitive pressure. Our SWOT pinpoints strategic opportunities in sustainability and digital labeling while flagging operational and commodity risks. Want the full picture? Purchase the complete SWOT for a professionally formatted, editable report and Excel matrix.
Strengths

Global scale leader
CCL Industries’ global-scale leadership — operations in 40+ countries — drives purchasing power, broad product breadth and credibility with blue-chip customers, supporting premium pricing and long-term contracts. Scale provides resilience across cycles and multi-plant supply continuity, reducing disruption risk. It funds ongoing investment in advanced converting, decoration and security technologies. Leadership attracts talent and reinforces preferred-supplier status.
Diverse segments & end-markets
CCL’s four operating segments—CCL Label, CCL Container, Avery, and Checkpoint—serve CPG, healthcare, electronics and automotive end-markets, smoothing revenue volatility by balancing discretionary and non-discretionary demand. This breadth enables cross-selling of materials, formats and services across divisions and reduces reliance on any single product category.

Innovation in specialty & security
Expertise in pressure-sensitive, extruded films, functional labels and smart/RFID solutions differentiates CCL’s offerings, enabling value-added applications that command premium pricing and foster high customer retention. Security, tamper-evident and track-and-trace features address regulatory and brand-protection needs across industries. Continuous R&D investment sustains technical barriers to entry and supports long-term margin resilience.

Global footprint & customer intimacy
CCL’s manufacturing and service footprint in over 40 countries shortens lead times and reduces logistics risk, while longstanding relationships with multinational CPG and pharma clients enable joint program visibility and co-development. Localized capabilities address regulatory and language requirements, and global accounts benefit from consistent quality standards across ~20,000 employees and CA$6.1B revenue (FY2024).
- Lead-time reduction: local plants
- Co-development: long-term CPG/pharma ties
- Regulatory fit: localized compliance
- Quality: global standards for multinational accounts
Proven M&A and integration
CCL Industries shows proven M&A and integration capability, using disciplined acquisitions to consolidate a fragmented label and packaging sector; FY2024 momentum funded continued deal-making and organic investment. Playbooks for integration consistently unlock cost synergies and product adjacencies, expanding RFID, security and specialty coatings across regions. Strong cash generation in FY2024 underpins further inorganic growth.
- Consolidation track record
- Integration playbooks → synergies
- Scale expands tech (RFID, security)
- FY2024 cash supports M&A
Global scale and M&A drive CA$6.1B revenue, ~20,000 staff
CCL Industries leverages global scale (operations in 40+ countries) to secure premium contracts, shorten lead times and invest in advanced converting, RFID and security tech, supporting CA$6.1B revenue (FY2024) and ~20,000 employees. Diversified segments (Label, Container, Avery, Checkpoint) and proven M&A playbooks sustain margin resilience and inorganic growth.
| Metric | Value |
|---|---|
| FY2024 Revenue | CA$6.1B |
| Employees | ~20,000 |
| Countries | 40+ |
| Operating Segments | 4 |
What is included in the product
 Detailed Word Document
Delivers a strategic overview of CCL Industries’s internal and external business factors, outlining strengths, weaknesses, opportunities, and threats to assess competitive position, growth drivers, operational gaps, and market risks shaping its future.

 Customizable Excel Spreadsheet
Provides a concise SWOT matrix tailored to CCL Industries for rapid strategy alignment and clear communication of strengths, weaknesses, opportunities, and threats.
Weaknesses

Raw material exposure
Resin, paper and aluminum price swings compress CCL Industries margins as passthrough mechanisms frequently lag, producing near-term earnings volatility; supply tightness has previously strained service levels and order fulfilment. Hedging programs reduce but do not eliminate exposure, leaving residual cost spikes that can erode quarterly results and operational flexibility.
Operational complexity
Multiple technologies, substrates and roughly 160 manufacturing sites across ~40 countries complicate planning and quality control, increasing variability in yield and rejects. Integration of recent acquisitions raises execution risk and can delay synergies; harmonization and IT/ERP rollouts require continuous capital and R&D spend. Complexity inflates overhead and working capital, pressuring margins on C$6.3B revenue (FY2024).

Customer concentration risk
Large global CPG and pharmaceutical accounts can account for concentrated revenue streams, giving those buyers outsized leverage to pressure pricing and contract terms. Loss or downscaling of a major program can leave coating and converting lines underutilized, raising fixed-cost per-unit. Long qualification and regulatory approval cycles in pharma and CPG slow replacement wins and extend recovery time after contract losses.

Capital intensity
Specialized converting lines, inspection systems and RFID capacity require steady capital investment, making operations capital‑intensive; returns hinge on high utilization rates and favorable product mix, while ramping new technologies often dilutes margins during longer break‑in periods, and ongoing maintenance and regulatory compliance spend add predictable fixed costs.
- High capex for specialized lines
- Returns dependent on utilization and mix
- Ramp‑up dilutes margins
- Ongoing maintenance & compliance costs
FX and geographic exposure
Global operations in more than 40 countries with over 170 manufacturing sites expose CCL to currency translation and transaction risks; mismatches between input costs and sales currencies can compress margins during FX swings. Regional demand shocks in major markets can cascade through its manufacturing network, and hedging programs mitigate but do not eliminate volatility.
- FX translation risk: global footprint
- Transaction risk: input vs sales currency mismatch
- Network exposure: regional demand shocks
- Hedging: reduces, not eliminates, volatility
Raw-material swings, sprawling global footprint and concentrated clients compress margins
Resin, paper and aluminum price swings compress margins as passthroughs lag, causing earnings volatility; hedges reduce but do not remove exposure. Complex footprint—over 170 sites in ~40 countries—raises yield variability, integration and IT rollout costs, and capital intensity. Concentrated large CPG/pharma accounts increase pricing pressure and underutilization risk.
| Metric | Value |
|---|---|
| FY2024 Revenue | C$6.3B |
| Manufacturing sites | >170 |
| Countries | ~40 |
Preview the Actual Deliverable
CCL Industries SWOT Analysis
This is the actual SWOT analysis document you’ll receive upon purchase—no surprises, just professional quality. The preview below is taken directly from the full SWOT report you'll get; purchase unlocks the entire in-depth version. You’re viewing a live preview of the complete, editable SWOT file for CCL Industries; the full document is available after checkout.

Dive Deeper Into the Company’s Strategic Blueprint
CCL Industries shows strong global packaging and labeling capabilities, durable customer relationships, and innovative specialty films, but faces input-cost volatility and intense competitive pressure. Our SWOT pinpoints strategic opportunities in sustainability and digital labeling while flagging operational and commodity risks. Want the full picture? Purchase the complete SWOT for a professionally formatted, editable report and Excel matrix.
Strengths
Global scale leader
CCL Industries’ global-scale leadership — operations in 40+ countries — drives purchasing power, broad product breadth and credibility with blue-chip customers, supporting premium pricing and long-term contracts. Scale provides resilience across cycles and multi-plant supply continuity, reducing disruption risk. It funds ongoing investment in advanced converting, decoration and security technologies. Leadership attracts talent and reinforces preferred-supplier status.
Diverse segments & end-markets
CCL’s four operating segments—CCL Label, CCL Container, Avery, and Checkpoint—serve CPG, healthcare, electronics and automotive end-markets, smoothing revenue volatility by balancing discretionary and non-discretionary demand. This breadth enables cross-selling of materials, formats and services across divisions and reduces reliance on any single product category.
Innovation in specialty & security
Expertise in pressure-sensitive, extruded films, functional labels and smart/RFID solutions differentiates CCL’s offerings, enabling value-added applications that command premium pricing and foster high customer retention. Security, tamper-evident and track-and-trace features address regulatory and brand-protection needs across industries. Continuous R&D investment sustains technical barriers to entry and supports long-term margin resilience.
Global footprint & customer intimacy
CCL’s manufacturing and service footprint in over 40 countries shortens lead times and reduces logistics risk, while longstanding relationships with multinational CPG and pharma clients enable joint program visibility and co-development. Localized capabilities address regulatory and language requirements, and global accounts benefit from consistent quality standards across ~20,000 employees and CA$6.1B revenue (FY2024).
- Lead-time reduction: local plants
- Co-development: long-term CPG/pharma ties
- Regulatory fit: localized compliance
- Quality: global standards for multinational accounts
Proven M&A and integration
CCL Industries shows proven M&A and integration capability, using disciplined acquisitions to consolidate a fragmented label and packaging sector; FY2024 momentum funded continued deal-making and organic investment. Playbooks for integration consistently unlock cost synergies and product adjacencies, expanding RFID, security and specialty coatings across regions. Strong cash generation in FY2024 underpins further inorganic growth.
- Consolidation track record
- Integration playbooks → synergies
- Scale expands tech (RFID, security)
- FY2024 cash supports M&A
Global scale and M&A drive CA$6.1B revenue, ~20,000 staff
CCL Industries leverages global scale (operations in 40+ countries) to secure premium contracts, shorten lead times and invest in advanced converting, RFID and security tech, supporting CA$6.1B revenue (FY2024) and ~20,000 employees. Diversified segments (Label, Container, Avery, Checkpoint) and proven M&A playbooks sustain margin resilience and inorganic growth.
| Metric | Value |
|---|---|
| FY2024 Revenue | CA$6.1B |
| Employees | ~20,000 |
| Countries | 40+ |
| Operating Segments | 4 |
What is included in the product
Detailed Word Document
Delivers a strategic overview of CCL Industries’s internal and external business factors, outlining strengths, weaknesses, opportunities, and threats to assess competitive position, growth drivers, operational gaps, and market risks shaping its future.
Customizable Excel Spreadsheet
Provides a concise SWOT matrix tailored to CCL Industries for rapid strategy alignment and clear communication of strengths, weaknesses, opportunities, and threats.
Weaknesses
Raw material exposure
Resin, paper and aluminum price swings compress CCL Industries margins as passthrough mechanisms frequently lag, producing near-term earnings volatility; supply tightness has previously strained service levels and order fulfilment. Hedging programs reduce but do not eliminate exposure, leaving residual cost spikes that can erode quarterly results and operational flexibility.
Operational complexity
Multiple technologies, substrates and roughly 160 manufacturing sites across ~40 countries complicate planning and quality control, increasing variability in yield and rejects. Integration of recent acquisitions raises execution risk and can delay synergies; harmonization and IT/ERP rollouts require continuous capital and R&D spend. Complexity inflates overhead and working capital, pressuring margins on C$6.3B revenue (FY2024).
Customer concentration risk
Large global CPG and pharmaceutical accounts can account for concentrated revenue streams, giving those buyers outsized leverage to pressure pricing and contract terms. Loss or downscaling of a major program can leave coating and converting lines underutilized, raising fixed-cost per-unit. Long qualification and regulatory approval cycles in pharma and CPG slow replacement wins and extend recovery time after contract losses.
Capital intensity
Specialized converting lines, inspection systems and RFID capacity require steady capital investment, making operations capital‑intensive; returns hinge on high utilization rates and favorable product mix, while ramping new technologies often dilutes margins during longer break‑in periods, and ongoing maintenance and regulatory compliance spend add predictable fixed costs.
- High capex for specialized lines
- Returns dependent on utilization and mix
- Ramp‑up dilutes margins
- Ongoing maintenance & compliance costs
FX and geographic exposure
Global operations in more than 40 countries with over 170 manufacturing sites expose CCL to currency translation and transaction risks; mismatches between input costs and sales currencies can compress margins during FX swings. Regional demand shocks in major markets can cascade through its manufacturing network, and hedging programs mitigate but do not eliminate volatility.
- FX translation risk: global footprint
- Transaction risk: input vs sales currency mismatch
- Network exposure: regional demand shocks
- Hedging: reduces, not eliminates, volatility
Raw-material swings, sprawling global footprint and concentrated clients compress margins
Resin, paper and aluminum price swings compress margins as passthroughs lag, causing earnings volatility; hedges reduce but do not remove exposure. Complex footprint—over 170 sites in ~40 countries—raises yield variability, integration and IT rollout costs, and capital intensity. Concentrated large CPG/pharma accounts increase pricing pressure and underutilization risk.
| Metric | Value |
|---|---|
| FY2024 Revenue | C$6.3B |
| Manufacturing sites | >170 |
| Countries | ~40 |
Preview the Actual Deliverable
CCL Industries SWOT Analysis
This is the actual SWOT analysis document you’ll receive upon purchase—no surprises, just professional quality. The preview below is taken directly from the full SWOT report you'll get; purchase unlocks the entire in-depth version. You’re viewing a live preview of the complete, editable SWOT file for CCL Industries; the full document is available after checkout.
Description
Dive Deeper Into the Company’s Strategic Blueprint
CCL Industries shows strong global packaging and labeling capabilities, durable customer relationships, and innovative specialty films, but faces input-cost volatility and intense competitive pressure. Our SWOT pinpoints strategic opportunities in sustainability and digital labeling while flagging operational and commodity risks. Want the full picture? Purchase the complete SWOT for a professionally formatted, editable report and Excel matrix.
Strengths
Global scale leader
CCL Industries’ global-scale leadership — operations in 40+ countries — drives purchasing power, broad product breadth and credibility with blue-chip customers, supporting premium pricing and long-term contracts. Scale provides resilience across cycles and multi-plant supply continuity, reducing disruption risk. It funds ongoing investment in advanced converting, decoration and security technologies. Leadership attracts talent and reinforces preferred-supplier status.
Diverse segments & end-markets
CCL’s four operating segments—CCL Label, CCL Container, Avery, and Checkpoint—serve CPG, healthcare, electronics and automotive end-markets, smoothing revenue volatility by balancing discretionary and non-discretionary demand. This breadth enables cross-selling of materials, formats and services across divisions and reduces reliance on any single product category.
Innovation in specialty & security
Expertise in pressure-sensitive, extruded films, functional labels and smart/RFID solutions differentiates CCL’s offerings, enabling value-added applications that command premium pricing and foster high customer retention. Security, tamper-evident and track-and-trace features address regulatory and brand-protection needs across industries. Continuous R&D investment sustains technical barriers to entry and supports long-term margin resilience.
Global footprint & customer intimacy
CCL’s manufacturing and service footprint in over 40 countries shortens lead times and reduces logistics risk, while longstanding relationships with multinational CPG and pharma clients enable joint program visibility and co-development. Localized capabilities address regulatory and language requirements, and global accounts benefit from consistent quality standards across ~20,000 employees and CA$6.1B revenue (FY2024).
- Lead-time reduction: local plants
- Co-development: long-term CPG/pharma ties
- Regulatory fit: localized compliance
- Quality: global standards for multinational accounts
Proven M&A and integration
CCL Industries shows proven M&A and integration capability, using disciplined acquisitions to consolidate a fragmented label and packaging sector; FY2024 momentum funded continued deal-making and organic investment. Playbooks for integration consistently unlock cost synergies and product adjacencies, expanding RFID, security and specialty coatings across regions. Strong cash generation in FY2024 underpins further inorganic growth.
- Consolidation track record
- Integration playbooks → synergies
- Scale expands tech (RFID, security)
- FY2024 cash supports M&A
Global scale and M&A drive CA$6.1B revenue, ~20,000 staff
CCL Industries leverages global scale (operations in 40+ countries) to secure premium contracts, shorten lead times and invest in advanced converting, RFID and security tech, supporting CA$6.1B revenue (FY2024) and ~20,000 employees. Diversified segments (Label, Container, Avery, Checkpoint) and proven M&A playbooks sustain margin resilience and inorganic growth.
| Metric | Value |
|---|---|
| FY2024 Revenue | CA$6.1B |
| Employees | ~20,000 |
| Countries | 40+ |
| Operating Segments | 4 |
What is included in the product
Detailed Word Document
Delivers a strategic overview of CCL Industries’s internal and external business factors, outlining strengths, weaknesses, opportunities, and threats to assess competitive position, growth drivers, operational gaps, and market risks shaping its future.
Customizable Excel Spreadsheet
Provides a concise SWOT matrix tailored to CCL Industries for rapid strategy alignment and clear communication of strengths, weaknesses, opportunities, and threats.
Weaknesses
Raw material exposure
Resin, paper and aluminum price swings compress CCL Industries margins as passthrough mechanisms frequently lag, producing near-term earnings volatility; supply tightness has previously strained service levels and order fulfilment. Hedging programs reduce but do not eliminate exposure, leaving residual cost spikes that can erode quarterly results and operational flexibility.
Operational complexity
Multiple technologies, substrates and roughly 160 manufacturing sites across ~40 countries complicate planning and quality control, increasing variability in yield and rejects. Integration of recent acquisitions raises execution risk and can delay synergies; harmonization and IT/ERP rollouts require continuous capital and R&D spend. Complexity inflates overhead and working capital, pressuring margins on C$6.3B revenue (FY2024).
Customer concentration risk
Large global CPG and pharmaceutical accounts can account for concentrated revenue streams, giving those buyers outsized leverage to pressure pricing and contract terms. Loss or downscaling of a major program can leave coating and converting lines underutilized, raising fixed-cost per-unit. Long qualification and regulatory approval cycles in pharma and CPG slow replacement wins and extend recovery time after contract losses.
Capital intensity
Specialized converting lines, inspection systems and RFID capacity require steady capital investment, making operations capital‑intensive; returns hinge on high utilization rates and favorable product mix, while ramping new technologies often dilutes margins during longer break‑in periods, and ongoing maintenance and regulatory compliance spend add predictable fixed costs.
- High capex for specialized lines
- Returns dependent on utilization and mix
- Ramp‑up dilutes margins
- Ongoing maintenance & compliance costs
FX and geographic exposure
Global operations in more than 40 countries with over 170 manufacturing sites expose CCL to currency translation and transaction risks; mismatches between input costs and sales currencies can compress margins during FX swings. Regional demand shocks in major markets can cascade through its manufacturing network, and hedging programs mitigate but do not eliminate volatility.
- FX translation risk: global footprint
- Transaction risk: input vs sales currency mismatch
- Network exposure: regional demand shocks
- Hedging: reduces, not eliminates, volatility
Raw-material swings, sprawling global footprint and concentrated clients compress margins
Resin, paper and aluminum price swings compress margins as passthroughs lag, causing earnings volatility; hedges reduce but do not remove exposure. Complex footprint—over 170 sites in ~40 countries—raises yield variability, integration and IT rollout costs, and capital intensity. Concentrated large CPG/pharma accounts increase pricing pressure and underutilization risk.
| Metric | Value |
|---|---|
| FY2024 Revenue | C$6.3B |
| Manufacturing sites | >170 |
| Countries | ~40 |
Preview the Actual Deliverable
CCL Industries SWOT Analysis
This is the actual SWOT analysis document you’ll receive upon purchase—no surprises, just professional quality. The preview below is taken directly from the full SWOT report you'll get; purchase unlocks the entire in-depth version. You’re viewing a live preview of the complete, editable SWOT file for CCL Industries; the full document is available after checkout.











