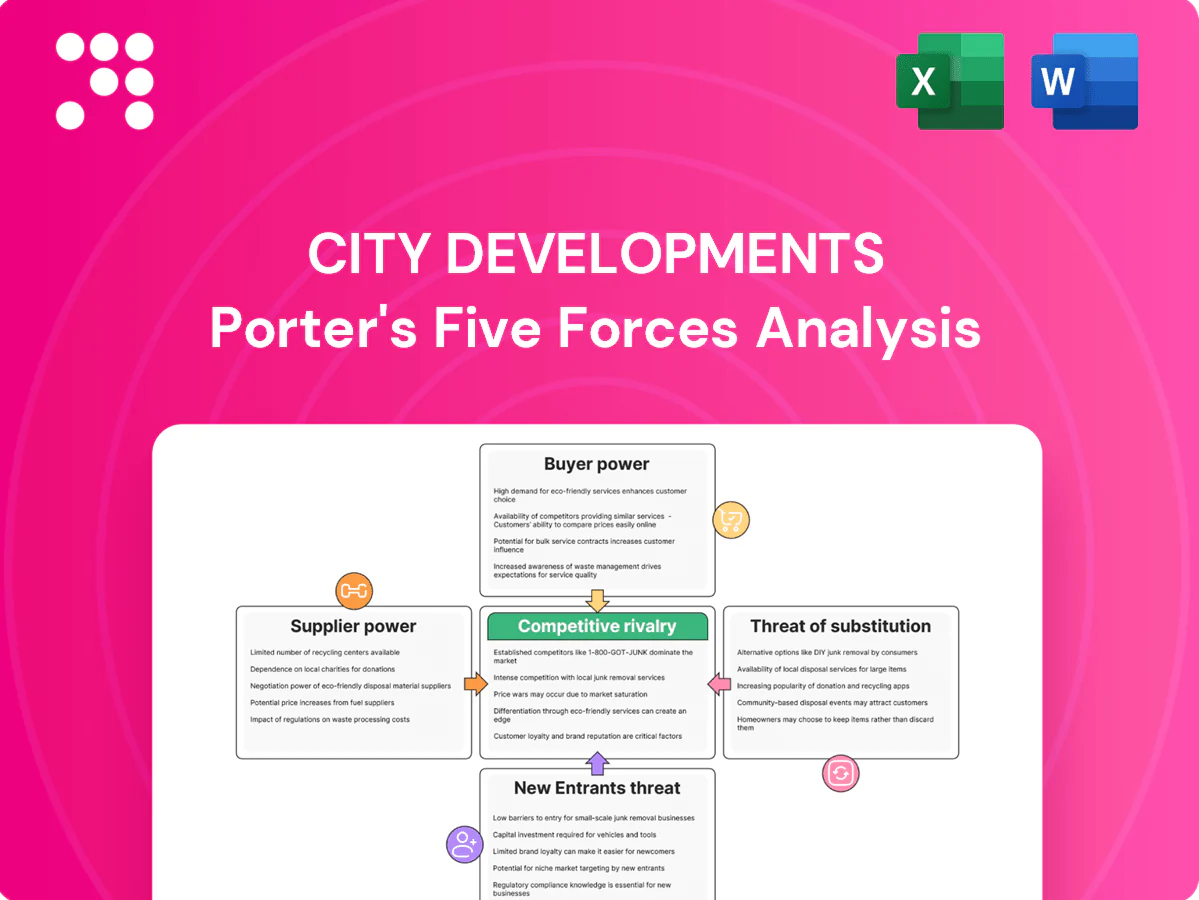
City Developments Porter's Five Forces Analysis

Go Beyond the Preview—Access the Full Strategic Report
City Developments faces shifting buyer expectations, moderate supplier leverage, and growing rivalry from integrated property developers; regulatory and capital barriers temper new entrants while substitutes like co-living add pressure. This brief snapshot only scratches the surface. Unlock the full Porter's Five Forces Analysis to explore City Developments’s competitive dynamics and strategic advantages in detail.
Suppliers Bargaining Power

Constrained land supply (GLS, en bloc)
In Singapore the state controls roughly 90% of land (2024), so GLS timing/pricing gives suppliers outsized leverage; scarce prime sites globally compound this. En bloc vendors have secured premiums during up-cycles, increasing competition for parcels. CDL offsets via cross-market landbanking and JV partnerships but remains exposed to auction dynamics. This raises input-cost volatility and project IRR sensitivity.
Construction contractors and materials
Large main contractors and suppliers of steel, cement and MEP systems can tighten pricing power in capacity-constrained periods, with materials and subcontract costs typically representing around 60% of total build costs. Singaporean labor rules and foreign worker quotas further constrain supply, raising short-term bid premiums often in the mid-single digits. CDL mitigates via competitive tenders, multi-year framework agreements and value-engineering; nevertheless schedule risk and margin squeeze rise sharply when build costs spike.

Capital providers and interest rates
Banks, bondholders and project financiers set cost of capital and covenants; with US Fed funds at 5.25–5.50% and the 10‑yr near 4.5% in 2024, rising rates and tighter credit boost lenders’ leverage over developers. CDL’s diversified funding, REIT platforms and a net gearing around 0.35 in 2024 help negotiate terms, yet a 100bp WACC rise can cut land bid capacity by roughly 10–15%, materially affecting feasibility.

Hospitality brand, FF&E, and tech vendors
For hotels, key systems (PMS/CRS like Oracle OPERA) and OTAs (Booking Holdings and Expedia remain dominant in 2024) plus FF&E suppliers are highly concentrated and sticky, making switches costly and disruptive across CDL’s global portfolio. CDL leverages Millennium & Copthorne scale to negotiate pricing and brand standards, but vendor power persists where interoperability and standards are limited.
- Concentration: dominant PMS/OTAs
- Switching cost: high across global estate
- Scale leverage: CDL/M&C bargaining
- Residual vendor power: limited interoperability
Sustainability consultants and green tech
Sustainability consultants and green‑tech suppliers tighten CDL’s supplier pool as 2024 net‑zero pathways, green certifications and high‑performance materials require niche expertise. Compliance and ESG differentiation increase reliance on specialized consultants and frontier technologies, where CDL’s early green leadership eases access but often incurs premiums. Supplier power is highest for novel decarbonization scopes.
- narrow qualified suppliers
- higher reliance on specialists
- premium costs for frontier solutions
State land control, soaring materials costs and tight rates squeeze developers
Supplier power is elevated: Singapore state land ~90% (2024) boosts GLS/vendor leverage. Materials/subs ≈60% of build costs; labour quotas add bid premiums. Finance tightness (Fed 5.25–5.50%, 10yr ~4.5%) and dominant OTAs raise switching costs.
| Metric | 2024 |
|---|---|
| State land | ~90% |
| Materials % | ~60% |
| Fed funds | 5.25–5.50% |
What is included in the product
 Detailed Word Document
Tailored Porter's Five Forces analysis for City Developments, uncovering competitive drivers, buyer/supplier power, entry barriers, substitutes, and emerging threats to inform strategic and investment decisions.

 Customizable Excel Spreadsheet
A concise City Developments Porter's Five Forces one-sheet that instantly visualizes competitive pressures via an editable radar chart—easy to customize, copy into decks, swap in your data, and integrate with reports without any macros.
Customers Bargaining Power

Residential buyers’ price sensitivity
Residential buyers compare location, unit mix and launch pipelines intensely, pushing prices down in slower markets; private home prices in Singapore eased about 3% year-on-year in 2024, increasing sensitivity as cooling measures and stricter loan-to-value rules bite. CDL counters with strong branding, upgraded amenities and phased launches to smooth take-up and defend pricing, but buyer power rises when supply is ample and incentives multiply.
Office and retail tenants’ negotiating leverage
Anchor tenants and multinational corporates extract rent-free periods, fit-out support and flexible terms, with industry reports in 2024 noting vacancy pressures near 10% in some submarkets that amplify tenant leverage. In weak-demand/high-vacancy pockets, negotiation power shifts further to tenants, increasing incentive levels. CDL counters through prime-location assets and a curated tenant mix, while long leases and staggered expiries reduce concentration risk.

Hotel guests and OTA channels
Price transparency via metasearch and OTAs empowers travelers to bargain indirectly, with metasearch used by over 60% of hotel bookers in 2024. OTAs extract 15–25% commissions and control visibility, consolidating channel power. CDL counters with direct-booking perks, loyalty benefits and revenue-management to boost direct share. Group and corporate contracts, roughly 20–30% of hotel revenues, partly reduce OTA dependence.

Institutional buyers of assets
Institutional buyers—core funds, REITs and family offices—exercise strong discipline on cap rates and deal terms, and in 2024 buyer dry powder and allocation shifts kept downward pressure on pricing. During risk-off bouts in 2024 bid-ask gaps widened, increasing buyer power; CDL can recycle assets into its affiliated REITs for price timing flexibility, while trophy or green-certified assets face less price pushback.
- Core funds/REITs: disciplined on cap rates
- Risk-off 2024: wider bid-ask, more buyer power
- CDL: recycling into affiliated REITs adds optionality
- Trophy/green assets: reduced price resistance
Pre-sale and pre-lease concentration
Projects often rely on early commitments for financing and de-risking, with bulk buyers or anchor pre-lease tenants able to capture more than 20–30% of a launch’s allocations and thus exert outsized influence on pricing and specification; CDL mitigates this by diversifying buyer pools and staging releases across tranches to protect margins in volatile markets.
- Pre-sale dependency: bulk/anchor >20–30%
- Mitigation: staged releases, diversified channels
- Key focus: dependency management to preserve margins
Rising leverage hits real estate: home prices down ~3%, office vacancy ~10%, metasearch >60%
Customers have rising leverage: private home prices fell ~3% y/y in 2024 and office vacancy hit ~10% in some submarkets, increasing concessions. Metasearch/OTAs dominate bookings (metasearch >60%; OTA fees 15–25%) and institutional buyers widened bid-ask in 2024. CDL levers branding, staged launches and REIT recycling to defend pricing.
| Metric | 2024 |
|---|---|
| Private home price change | -3% y/y |
| Office vacancy (some submarkets) | ~10% |
| Metasearch hotel share | >60% |
Preview Before You Purchase
City Developments Porter's Five Forces Analysis
This preview shows the exact City Developments Porter's Five Forces Analysis you'll receive immediately after purchase—no placeholders or abbreviated samples. The file is the full, professionally formatted analysis ready for download and use. You’re viewing the final deliverable; once you buy, you get this identical document instantly. No surprises, no edits required.

Go Beyond the Preview—Access the Full Strategic Report
City Developments faces shifting buyer expectations, moderate supplier leverage, and growing rivalry from integrated property developers; regulatory and capital barriers temper new entrants while substitutes like co-living add pressure. This brief snapshot only scratches the surface. Unlock the full Porter's Five Forces Analysis to explore City Developments’s competitive dynamics and strategic advantages in detail.
Suppliers Bargaining Power
Constrained land supply (GLS, en bloc)
In Singapore the state controls roughly 90% of land (2024), so GLS timing/pricing gives suppliers outsized leverage; scarce prime sites globally compound this. En bloc vendors have secured premiums during up-cycles, increasing competition for parcels. CDL offsets via cross-market landbanking and JV partnerships but remains exposed to auction dynamics. This raises input-cost volatility and project IRR sensitivity.
Construction contractors and materials
Large main contractors and suppliers of steel, cement and MEP systems can tighten pricing power in capacity-constrained periods, with materials and subcontract costs typically representing around 60% of total build costs. Singaporean labor rules and foreign worker quotas further constrain supply, raising short-term bid premiums often in the mid-single digits. CDL mitigates via competitive tenders, multi-year framework agreements and value-engineering; nevertheless schedule risk and margin squeeze rise sharply when build costs spike.
Capital providers and interest rates
Banks, bondholders and project financiers set cost of capital and covenants; with US Fed funds at 5.25–5.50% and the 10‑yr near 4.5% in 2024, rising rates and tighter credit boost lenders’ leverage over developers. CDL’s diversified funding, REIT platforms and a net gearing around 0.35 in 2024 help negotiate terms, yet a 100bp WACC rise can cut land bid capacity by roughly 10–15%, materially affecting feasibility.
Hospitality brand, FF&E, and tech vendors
For hotels, key systems (PMS/CRS like Oracle OPERA) and OTAs (Booking Holdings and Expedia remain dominant in 2024) plus FF&E suppliers are highly concentrated and sticky, making switches costly and disruptive across CDL’s global portfolio. CDL leverages Millennium & Copthorne scale to negotiate pricing and brand standards, but vendor power persists where interoperability and standards are limited.
- Concentration: dominant PMS/OTAs
- Switching cost: high across global estate
- Scale leverage: CDL/M&C bargaining
- Residual vendor power: limited interoperability
Sustainability consultants and green tech
Sustainability consultants and green‑tech suppliers tighten CDL’s supplier pool as 2024 net‑zero pathways, green certifications and high‑performance materials require niche expertise. Compliance and ESG differentiation increase reliance on specialized consultants and frontier technologies, where CDL’s early green leadership eases access but often incurs premiums. Supplier power is highest for novel decarbonization scopes.
- narrow qualified suppliers
- higher reliance on specialists
- premium costs for frontier solutions
State land control, soaring materials costs and tight rates squeeze developers
Supplier power is elevated: Singapore state land ~90% (2024) boosts GLS/vendor leverage. Materials/subs ≈60% of build costs; labour quotas add bid premiums. Finance tightness (Fed 5.25–5.50%, 10yr ~4.5%) and dominant OTAs raise switching costs.
| Metric | 2024 |
|---|---|
| State land | ~90% |
| Materials % | ~60% |
| Fed funds | 5.25–5.50% |
What is included in the product
Detailed Word Document
Tailored Porter's Five Forces analysis for City Developments, uncovering competitive drivers, buyer/supplier power, entry barriers, substitutes, and emerging threats to inform strategic and investment decisions.
Customizable Excel Spreadsheet
A concise City Developments Porter's Five Forces one-sheet that instantly visualizes competitive pressures via an editable radar chart—easy to customize, copy into decks, swap in your data, and integrate with reports without any macros.
Customers Bargaining Power
Residential buyers’ price sensitivity
Residential buyers compare location, unit mix and launch pipelines intensely, pushing prices down in slower markets; private home prices in Singapore eased about 3% year-on-year in 2024, increasing sensitivity as cooling measures and stricter loan-to-value rules bite. CDL counters with strong branding, upgraded amenities and phased launches to smooth take-up and defend pricing, but buyer power rises when supply is ample and incentives multiply.
Office and retail tenants’ negotiating leverage
Anchor tenants and multinational corporates extract rent-free periods, fit-out support and flexible terms, with industry reports in 2024 noting vacancy pressures near 10% in some submarkets that amplify tenant leverage. In weak-demand/high-vacancy pockets, negotiation power shifts further to tenants, increasing incentive levels. CDL counters through prime-location assets and a curated tenant mix, while long leases and staggered expiries reduce concentration risk.
Hotel guests and OTA channels
Price transparency via metasearch and OTAs empowers travelers to bargain indirectly, with metasearch used by over 60% of hotel bookers in 2024. OTAs extract 15–25% commissions and control visibility, consolidating channel power. CDL counters with direct-booking perks, loyalty benefits and revenue-management to boost direct share. Group and corporate contracts, roughly 20–30% of hotel revenues, partly reduce OTA dependence.
Institutional buyers of assets
Institutional buyers—core funds, REITs and family offices—exercise strong discipline on cap rates and deal terms, and in 2024 buyer dry powder and allocation shifts kept downward pressure on pricing. During risk-off bouts in 2024 bid-ask gaps widened, increasing buyer power; CDL can recycle assets into its affiliated REITs for price timing flexibility, while trophy or green-certified assets face less price pushback.
- Core funds/REITs: disciplined on cap rates
- Risk-off 2024: wider bid-ask, more buyer power
- CDL: recycling into affiliated REITs adds optionality
- Trophy/green assets: reduced price resistance
Pre-sale and pre-lease concentration
Projects often rely on early commitments for financing and de-risking, with bulk buyers or anchor pre-lease tenants able to capture more than 20–30% of a launch’s allocations and thus exert outsized influence on pricing and specification; CDL mitigates this by diversifying buyer pools and staging releases across tranches to protect margins in volatile markets.
- Pre-sale dependency: bulk/anchor >20–30%
- Mitigation: staged releases, diversified channels
- Key focus: dependency management to preserve margins
Rising leverage hits real estate: home prices down ~3%, office vacancy ~10%, metasearch >60%
Customers have rising leverage: private home prices fell ~3% y/y in 2024 and office vacancy hit ~10% in some submarkets, increasing concessions. Metasearch/OTAs dominate bookings (metasearch >60%; OTA fees 15–25%) and institutional buyers widened bid-ask in 2024. CDL levers branding, staged launches and REIT recycling to defend pricing.
| Metric | 2024 |
|---|---|
| Private home price change | -3% y/y |
| Office vacancy (some submarkets) | ~10% |
| Metasearch hotel share | >60% |
Preview Before You Purchase
City Developments Porter's Five Forces Analysis
This preview shows the exact City Developments Porter's Five Forces Analysis you'll receive immediately after purchase—no placeholders or abbreviated samples. The file is the full, professionally formatted analysis ready for download and use. You’re viewing the final deliverable; once you buy, you get this identical document instantly. No surprises, no edits required.
Original: $10.00
-65%$10.00
$3.50Description
Go Beyond the Preview—Access the Full Strategic Report
City Developments faces shifting buyer expectations, moderate supplier leverage, and growing rivalry from integrated property developers; regulatory and capital barriers temper new entrants while substitutes like co-living add pressure. This brief snapshot only scratches the surface. Unlock the full Porter's Five Forces Analysis to explore City Developments’s competitive dynamics and strategic advantages in detail.
Suppliers Bargaining Power
Constrained land supply (GLS, en bloc)
In Singapore the state controls roughly 90% of land (2024), so GLS timing/pricing gives suppliers outsized leverage; scarce prime sites globally compound this. En bloc vendors have secured premiums during up-cycles, increasing competition for parcels. CDL offsets via cross-market landbanking and JV partnerships but remains exposed to auction dynamics. This raises input-cost volatility and project IRR sensitivity.
Construction contractors and materials
Large main contractors and suppliers of steel, cement and MEP systems can tighten pricing power in capacity-constrained periods, with materials and subcontract costs typically representing around 60% of total build costs. Singaporean labor rules and foreign worker quotas further constrain supply, raising short-term bid premiums often in the mid-single digits. CDL mitigates via competitive tenders, multi-year framework agreements and value-engineering; nevertheless schedule risk and margin squeeze rise sharply when build costs spike.
Capital providers and interest rates
Banks, bondholders and project financiers set cost of capital and covenants; with US Fed funds at 5.25–5.50% and the 10‑yr near 4.5% in 2024, rising rates and tighter credit boost lenders’ leverage over developers. CDL’s diversified funding, REIT platforms and a net gearing around 0.35 in 2024 help negotiate terms, yet a 100bp WACC rise can cut land bid capacity by roughly 10–15%, materially affecting feasibility.
Hospitality brand, FF&E, and tech vendors
For hotels, key systems (PMS/CRS like Oracle OPERA) and OTAs (Booking Holdings and Expedia remain dominant in 2024) plus FF&E suppliers are highly concentrated and sticky, making switches costly and disruptive across CDL’s global portfolio. CDL leverages Millennium & Copthorne scale to negotiate pricing and brand standards, but vendor power persists where interoperability and standards are limited.
- Concentration: dominant PMS/OTAs
- Switching cost: high across global estate
- Scale leverage: CDL/M&C bargaining
- Residual vendor power: limited interoperability
Sustainability consultants and green tech
Sustainability consultants and green‑tech suppliers tighten CDL’s supplier pool as 2024 net‑zero pathways, green certifications and high‑performance materials require niche expertise. Compliance and ESG differentiation increase reliance on specialized consultants and frontier technologies, where CDL’s early green leadership eases access but often incurs premiums. Supplier power is highest for novel decarbonization scopes.
- narrow qualified suppliers
- higher reliance on specialists
- premium costs for frontier solutions
State land control, soaring materials costs and tight rates squeeze developers
Supplier power is elevated: Singapore state land ~90% (2024) boosts GLS/vendor leverage. Materials/subs ≈60% of build costs; labour quotas add bid premiums. Finance tightness (Fed 5.25–5.50%, 10yr ~4.5%) and dominant OTAs raise switching costs.
| Metric | 2024 |
|---|---|
| State land | ~90% |
| Materials % | ~60% |
| Fed funds | 5.25–5.50% |
What is included in the product
Detailed Word Document
Tailored Porter's Five Forces analysis for City Developments, uncovering competitive drivers, buyer/supplier power, entry barriers, substitutes, and emerging threats to inform strategic and investment decisions.
Customizable Excel Spreadsheet
A concise City Developments Porter's Five Forces one-sheet that instantly visualizes competitive pressures via an editable radar chart—easy to customize, copy into decks, swap in your data, and integrate with reports without any macros.
Customers Bargaining Power
Residential buyers’ price sensitivity
Residential buyers compare location, unit mix and launch pipelines intensely, pushing prices down in slower markets; private home prices in Singapore eased about 3% year-on-year in 2024, increasing sensitivity as cooling measures and stricter loan-to-value rules bite. CDL counters with strong branding, upgraded amenities and phased launches to smooth take-up and defend pricing, but buyer power rises when supply is ample and incentives multiply.
Office and retail tenants’ negotiating leverage
Anchor tenants and multinational corporates extract rent-free periods, fit-out support and flexible terms, with industry reports in 2024 noting vacancy pressures near 10% in some submarkets that amplify tenant leverage. In weak-demand/high-vacancy pockets, negotiation power shifts further to tenants, increasing incentive levels. CDL counters through prime-location assets and a curated tenant mix, while long leases and staggered expiries reduce concentration risk.
Hotel guests and OTA channels
Price transparency via metasearch and OTAs empowers travelers to bargain indirectly, with metasearch used by over 60% of hotel bookers in 2024. OTAs extract 15–25% commissions and control visibility, consolidating channel power. CDL counters with direct-booking perks, loyalty benefits and revenue-management to boost direct share. Group and corporate contracts, roughly 20–30% of hotel revenues, partly reduce OTA dependence.
Institutional buyers of assets
Institutional buyers—core funds, REITs and family offices—exercise strong discipline on cap rates and deal terms, and in 2024 buyer dry powder and allocation shifts kept downward pressure on pricing. During risk-off bouts in 2024 bid-ask gaps widened, increasing buyer power; CDL can recycle assets into its affiliated REITs for price timing flexibility, while trophy or green-certified assets face less price pushback.
- Core funds/REITs: disciplined on cap rates
- Risk-off 2024: wider bid-ask, more buyer power
- CDL: recycling into affiliated REITs adds optionality
- Trophy/green assets: reduced price resistance
Pre-sale and pre-lease concentration
Projects often rely on early commitments for financing and de-risking, with bulk buyers or anchor pre-lease tenants able to capture more than 20–30% of a launch’s allocations and thus exert outsized influence on pricing and specification; CDL mitigates this by diversifying buyer pools and staging releases across tranches to protect margins in volatile markets.
- Pre-sale dependency: bulk/anchor >20–30%
- Mitigation: staged releases, diversified channels
- Key focus: dependency management to preserve margins
Rising leverage hits real estate: home prices down ~3%, office vacancy ~10%, metasearch >60%
Customers have rising leverage: private home prices fell ~3% y/y in 2024 and office vacancy hit ~10% in some submarkets, increasing concessions. Metasearch/OTAs dominate bookings (metasearch >60%; OTA fees 15–25%) and institutional buyers widened bid-ask in 2024. CDL levers branding, staged launches and REIT recycling to defend pricing.
| Metric | 2024 |
|---|---|
| Private home price change | -3% y/y |
| Office vacancy (some submarkets) | ~10% |
| Metasearch hotel share | >60% |
Preview Before You Purchase
City Developments Porter's Five Forces Analysis
This preview shows the exact City Developments Porter's Five Forces Analysis you'll receive immediately after purchase—no placeholders or abbreviated samples. The file is the full, professionally formatted analysis ready for download and use. You’re viewing the final deliverable; once you buy, you get this identical document instantly. No surprises, no edits required.











