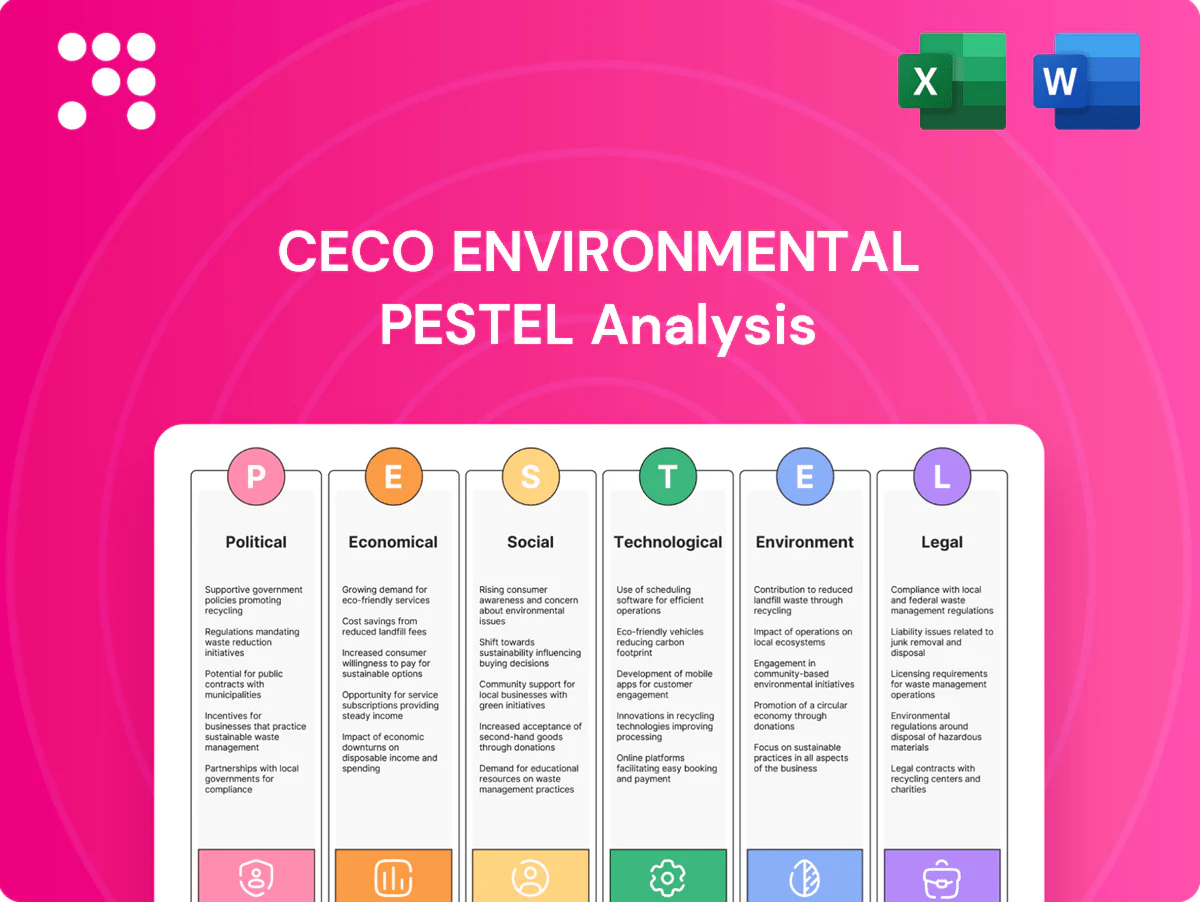
CECO Environmental PESTLE Analysis

Your Shortcut to Market Insight Starts Here
Gain a strategic edge with our PESTLE Analysis of CECO Environmental — revealing how political shifts, economic cycles, social trends, technological change, legal pressures, and environmental risks will shape growth and valuation. Ideal for investors, advisors, and executives, the full report offers data-driven insights and practical recommendations. Purchase the complete PESTLE now for immediate, editable access.
Political factors

Climate policy momentum
Governments are tightening decarbonization and air-quality agendas—over 140 countries have net-zero pledges covering roughly 90% of global emissions—driving expanded demand for control systems. Nationally Determined Contributions and recent EU/US emissions rulemaking are translating to stricter industrial limits, prompting compliance-driven capex that favors CECO. Policy reversals or election cycles can delay large orders and create timing risk for revenues.
Industrial subsidies
Industrial subsidies such as the US Inflation Reduction Act's ~$369B and rising global clean-energy investment ($1.7T in 2023, IEA) boost demand for clean manufacturing, CCS and energy-transition projects, catalyzing customer adoption. Grants and tax credits (eg 45Q at ~$60–85/ton CO2) lower hurdle rates for CECO air and fluid solutions. CECO can align product specs to program eligibility to capture incentives. Jurisdictional variability requires an agile, locally tailored sales strategy.

Trade and tariffs
Tariffs such as the US 25% steel tariffs (Section 232) and similar measures raise metal and equipment input costs, directly pressuring CECO pricing and margins. Tightened export controls since 2022 on dual‑use equipment and cross‑border frictions increase lead times and can delay project delivery. Local‑content rules including US IRA domestic sourcing incentives shape where CECO locates plants or partners, and increased supply‑chain localization tends to raise manufacturing costs, compressing gross margins by several percentage points.

Geopolitical stability
Geopolitical instability — notably lingering Russia–Ukraine tensions and sanctions — disrupts industrial spending and logistics, forcing supply-chain reroutes and higher lead times. Energy-market volatility shifts customer budgets (Brent averaged about $85/bbl in 2024), compressing capex in sensitive end-markets. Project risk premiums rise in unstable regions, often adding hundreds of basis points to required returns, so geographic diversification reduces concentration risk.
- Conflicts/sanctions: supply-chain delays, higher logistics costs
- Energy volatility: Brent ≈ $85/bbl (2024)
- Risk premiums: +hundreds bps in unstable markets
- Diversification: mitigates country-concentration risk
Public procurement
Government-owned utilities and infrastructure agencies are primary buyers for CECO Environmental, driven by major federal programs such as the Infrastructure Investment and Jobs Act (≈1.2 trillion total, ≈550 billion new) and the Inflation Reduction Act (≈369 billion clean‑energy incentives) that expand sustainable procurement; procurement standards increasingly weight sustainability metrics, winning framework agreements can secure multi-year backlog, and long tender cycles demand robust bid management.
- Public procurement ≈12% of global GDP (World Bank)
- IIJA ≈550B new infrastructure funds
- IRA ≈369B clean‑energy funding
- Framework wins = multi‑year backlog
Net-zero pledges and big subsidies drive clean-energy capex; tariffs and elections raise timing risk
Governments' net-zero pledges (~140 countries, ~90% global emissions) and tighter EU/US rules drive compliance capex for CECO, while election cycles create timing risk. Large subsidies (IRA ≈369B; global clean‑energy investment $1.7T in 2023) and 45Q ($60–85/t) spur projects; tariffs (US 25% steel) and localization raise input costs. Geopolitical tensions and energy volatility (Brent ≈$85/bbl 2024) increase lead times and risk premiums, favoring diversification.
| Factor | Metric | Impact |
|---|---|---|
| Policy | ~140 countries, ~90% emissions | Drives demand |
| Funding | IRA ≈$369B; $1.7T (2023) | Boosts projects |
| Trade | US steel tariff 25% | Raises costs |
| Risk | Brent ≈$85/bbl (2024) | Increases premiums |
What is included in the product
 Detailed Word Document
Explores how macro-environmental forces uniquely affect CECO Environmental across Political, Economic, Social, Technological, Environmental and Legal dimensions, with each section supported by current data and industry trends. Designed for executives and investors, it highlights threats, opportunities and forward-looking insights for strategic planning.

 Customizable Excel Spreadsheet
Clean, summarized CECO Environmental PESTLE analysis that’s visually segmented by category for fast interpretation and easily dropped into presentations or strategy sessions. Editable notes and a shareable format speed team alignment and make external risk discussion practical during planning.
Economic factors

Capex cycles
CECO’s order book closely tracks industrial capex cycles, with demand rising during energy, chemicals, and manufacturing expansions and slowing in downturns.
Recessions commonly delay greenfield projects and retrofits as firms defer spending, reducing new-system orders for pollution-control equipment.
A resilient aftermarket — spare parts, service, and retrofits — helps stabilize CECO’s revenues and margins during cyclical troughs.
Interest rates
Higher policy rates (US fed funds 5.25–5.50% in mid‑2025) raise customers’ WACC and often defer non‑mandatory air‑pollution and water‑treatment projects. Elevated rates increase CECO Environmental’s financing costs, tightening working capital and potentially slowing M&A activity. A future rate cut could unlock pent‑up demand from postponed projects. Hedging and flexible payment terms help sustain order conversion amid rate volatility.

Commodity prices
Oil near $80–90/bbl and Henry Hub gas around $3–4/MMBtu in 2024–25, plus metals strength (steel input costs up roughly 10–15% YoY in 2024) drive CECO end-market activity and squeeze margins on components. Surcharges and indexing (energy/steel passthroughs) mitigate some inflation. Persistent price volatility complicates pricing on long-duration service and equipment contracts.

FX exposure
CECO Environmental's global sales and sourcing create currency risk; US dollar strength (DXY averaged about 104 in 2024) can weaken international competitiveness and translate foreign revenues lower in USD. Natural hedges from matched costs and revenues reduce transaction exposure, and pricing in local currencies aids market penetration and preserves margins.
- Global sales/sourcing: FX risk
- DXY avg ~104 (2024): USD headwind
- Natural hedges cut transaction exposure
- Local-currency pricing supports market share
Labor and logistics
Tight skilled labor markets—US unemployment ~3.8% in 2024—elevate CECO’s manufacturing and field-service costs and extend hiring timelines, pressuring margins. Freight and lead-time variability from post‑pandemic supply chains disrupt project schedules and increase buffer inventory needs. Nearshoring can improve on‑time delivery but raises unit costs; consistent operational excellence is essential to protect gross margins.
- Labor pressure: higher wage inflation
- Logistics: lead‑time volatility delays projects
- Nearshoring: reliability vs cost tradeoff
- OpEx: margin protection through efficiency
Net-zero pledges and big subsidies drive clean-energy capex; tariffs and elections raise timing risk
CECO’s revenues track industrial capex cycles; recessions delay greenfield/retrofit orders while aftermarket services stabilize cash flow. Higher rates (US fed funds 5.25–5.50% mid‑2025) and tight labor (unemployment ~3.8% in 2024) pressure customer WACC and CECO’s costs. Commodity/DXY swings (oil $80–90/bbl, DXY ~104, steel +10–15% YoY 2024) squeeze margins despite passthroughs.
| Metric | Value |
|---|---|
| Fed funds | 5.25–5.50% (mid‑2025) |
| Oil | $80–90/bbl (2024–25) |
| DXY | ~104 (2024) |
| Steel | +10–15% YoY (2024) |
| Unemployment | ~3.8% (US, 2024) |
What You See Is What You Get
CECO Environmental PESTLE Analysis
The preview shown here is the exact CECO Environmental PESTLE Analysis you’ll receive after purchase—fully formatted and ready to use. It includes political, economic, social, technological, legal and environmental assessments specific to CECO Environmental and is presented in the final, professional layout. No placeholders or edits; download the same file immediately after checkout.

Your Shortcut to Market Insight Starts Here
Gain a strategic edge with our PESTLE Analysis of CECO Environmental — revealing how political shifts, economic cycles, social trends, technological change, legal pressures, and environmental risks will shape growth and valuation. Ideal for investors, advisors, and executives, the full report offers data-driven insights and practical recommendations. Purchase the complete PESTLE now for immediate, editable access.
Political factors
Climate policy momentum
Governments are tightening decarbonization and air-quality agendas—over 140 countries have net-zero pledges covering roughly 90% of global emissions—driving expanded demand for control systems. Nationally Determined Contributions and recent EU/US emissions rulemaking are translating to stricter industrial limits, prompting compliance-driven capex that favors CECO. Policy reversals or election cycles can delay large orders and create timing risk for revenues.
Industrial subsidies
Industrial subsidies such as the US Inflation Reduction Act's ~$369B and rising global clean-energy investment ($1.7T in 2023, IEA) boost demand for clean manufacturing, CCS and energy-transition projects, catalyzing customer adoption. Grants and tax credits (eg 45Q at ~$60–85/ton CO2) lower hurdle rates for CECO air and fluid solutions. CECO can align product specs to program eligibility to capture incentives. Jurisdictional variability requires an agile, locally tailored sales strategy.
Trade and tariffs
Tariffs such as the US 25% steel tariffs (Section 232) and similar measures raise metal and equipment input costs, directly pressuring CECO pricing and margins. Tightened export controls since 2022 on dual‑use equipment and cross‑border frictions increase lead times and can delay project delivery. Local‑content rules including US IRA domestic sourcing incentives shape where CECO locates plants or partners, and increased supply‑chain localization tends to raise manufacturing costs, compressing gross margins by several percentage points.
Geopolitical stability
Geopolitical instability — notably lingering Russia–Ukraine tensions and sanctions — disrupts industrial spending and logistics, forcing supply-chain reroutes and higher lead times. Energy-market volatility shifts customer budgets (Brent averaged about $85/bbl in 2024), compressing capex in sensitive end-markets. Project risk premiums rise in unstable regions, often adding hundreds of basis points to required returns, so geographic diversification reduces concentration risk.
- Conflicts/sanctions: supply-chain delays, higher logistics costs
- Energy volatility: Brent ≈ $85/bbl (2024)
- Risk premiums: +hundreds bps in unstable markets
- Diversification: mitigates country-concentration risk
Public procurement
Government-owned utilities and infrastructure agencies are primary buyers for CECO Environmental, driven by major federal programs such as the Infrastructure Investment and Jobs Act (≈1.2 trillion total, ≈550 billion new) and the Inflation Reduction Act (≈369 billion clean‑energy incentives) that expand sustainable procurement; procurement standards increasingly weight sustainability metrics, winning framework agreements can secure multi-year backlog, and long tender cycles demand robust bid management.
- Public procurement ≈12% of global GDP (World Bank)
- IIJA ≈550B new infrastructure funds
- IRA ≈369B clean‑energy funding
- Framework wins = multi‑year backlog
Net-zero pledges and big subsidies drive clean-energy capex; tariffs and elections raise timing risk
Governments' net-zero pledges (~140 countries, ~90% global emissions) and tighter EU/US rules drive compliance capex for CECO, while election cycles create timing risk. Large subsidies (IRA ≈369B; global clean‑energy investment $1.7T in 2023) and 45Q ($60–85/t) spur projects; tariffs (US 25% steel) and localization raise input costs. Geopolitical tensions and energy volatility (Brent ≈$85/bbl 2024) increase lead times and risk premiums, favoring diversification.
| Factor | Metric | Impact |
|---|---|---|
| Policy | ~140 countries, ~90% emissions | Drives demand |
| Funding | IRA ≈$369B; $1.7T (2023) | Boosts projects |
| Trade | US steel tariff 25% | Raises costs |
| Risk | Brent ≈$85/bbl (2024) | Increases premiums |
What is included in the product
Detailed Word Document
Explores how macro-environmental forces uniquely affect CECO Environmental across Political, Economic, Social, Technological, Environmental and Legal dimensions, with each section supported by current data and industry trends. Designed for executives and investors, it highlights threats, opportunities and forward-looking insights for strategic planning.
Customizable Excel Spreadsheet
Clean, summarized CECO Environmental PESTLE analysis that’s visually segmented by category for fast interpretation and easily dropped into presentations or strategy sessions. Editable notes and a shareable format speed team alignment and make external risk discussion practical during planning.
Economic factors
Capex cycles
CECO’s order book closely tracks industrial capex cycles, with demand rising during energy, chemicals, and manufacturing expansions and slowing in downturns.
Recessions commonly delay greenfield projects and retrofits as firms defer spending, reducing new-system orders for pollution-control equipment.
A resilient aftermarket — spare parts, service, and retrofits — helps stabilize CECO’s revenues and margins during cyclical troughs.
Interest rates
Higher policy rates (US fed funds 5.25–5.50% in mid‑2025) raise customers’ WACC and often defer non‑mandatory air‑pollution and water‑treatment projects. Elevated rates increase CECO Environmental’s financing costs, tightening working capital and potentially slowing M&A activity. A future rate cut could unlock pent‑up demand from postponed projects. Hedging and flexible payment terms help sustain order conversion amid rate volatility.
Commodity prices
Oil near $80–90/bbl and Henry Hub gas around $3–4/MMBtu in 2024–25, plus metals strength (steel input costs up roughly 10–15% YoY in 2024) drive CECO end-market activity and squeeze margins on components. Surcharges and indexing (energy/steel passthroughs) mitigate some inflation. Persistent price volatility complicates pricing on long-duration service and equipment contracts.
FX exposure
CECO Environmental's global sales and sourcing create currency risk; US dollar strength (DXY averaged about 104 in 2024) can weaken international competitiveness and translate foreign revenues lower in USD. Natural hedges from matched costs and revenues reduce transaction exposure, and pricing in local currencies aids market penetration and preserves margins.
- Global sales/sourcing: FX risk
- DXY avg ~104 (2024): USD headwind
- Natural hedges cut transaction exposure
- Local-currency pricing supports market share
Labor and logistics
Tight skilled labor markets—US unemployment ~3.8% in 2024—elevate CECO’s manufacturing and field-service costs and extend hiring timelines, pressuring margins. Freight and lead-time variability from post‑pandemic supply chains disrupt project schedules and increase buffer inventory needs. Nearshoring can improve on‑time delivery but raises unit costs; consistent operational excellence is essential to protect gross margins.
- Labor pressure: higher wage inflation
- Logistics: lead‑time volatility delays projects
- Nearshoring: reliability vs cost tradeoff
- OpEx: margin protection through efficiency
Net-zero pledges and big subsidies drive clean-energy capex; tariffs and elections raise timing risk
CECO’s revenues track industrial capex cycles; recessions delay greenfield/retrofit orders while aftermarket services stabilize cash flow. Higher rates (US fed funds 5.25–5.50% mid‑2025) and tight labor (unemployment ~3.8% in 2024) pressure customer WACC and CECO’s costs. Commodity/DXY swings (oil $80–90/bbl, DXY ~104, steel +10–15% YoY 2024) squeeze margins despite passthroughs.
| Metric | Value |
|---|---|
| Fed funds | 5.25–5.50% (mid‑2025) |
| Oil | $80–90/bbl (2024–25) |
| DXY | ~104 (2024) |
| Steel | +10–15% YoY (2024) |
| Unemployment | ~3.8% (US, 2024) |
What You See Is What You Get
CECO Environmental PESTLE Analysis
The preview shown here is the exact CECO Environmental PESTLE Analysis you’ll receive after purchase—fully formatted and ready to use. It includes political, economic, social, technological, legal and environmental assessments specific to CECO Environmental and is presented in the final, professional layout. No placeholders or edits; download the same file immediately after checkout.
Description
Your Shortcut to Market Insight Starts Here
Gain a strategic edge with our PESTLE Analysis of CECO Environmental — revealing how political shifts, economic cycles, social trends, technological change, legal pressures, and environmental risks will shape growth and valuation. Ideal for investors, advisors, and executives, the full report offers data-driven insights and practical recommendations. Purchase the complete PESTLE now for immediate, editable access.
Political factors
Climate policy momentum
Governments are tightening decarbonization and air-quality agendas—over 140 countries have net-zero pledges covering roughly 90% of global emissions—driving expanded demand for control systems. Nationally Determined Contributions and recent EU/US emissions rulemaking are translating to stricter industrial limits, prompting compliance-driven capex that favors CECO. Policy reversals or election cycles can delay large orders and create timing risk for revenues.
Industrial subsidies
Industrial subsidies such as the US Inflation Reduction Act's ~$369B and rising global clean-energy investment ($1.7T in 2023, IEA) boost demand for clean manufacturing, CCS and energy-transition projects, catalyzing customer adoption. Grants and tax credits (eg 45Q at ~$60–85/ton CO2) lower hurdle rates for CECO air and fluid solutions. CECO can align product specs to program eligibility to capture incentives. Jurisdictional variability requires an agile, locally tailored sales strategy.
Trade and tariffs
Tariffs such as the US 25% steel tariffs (Section 232) and similar measures raise metal and equipment input costs, directly pressuring CECO pricing and margins. Tightened export controls since 2022 on dual‑use equipment and cross‑border frictions increase lead times and can delay project delivery. Local‑content rules including US IRA domestic sourcing incentives shape where CECO locates plants or partners, and increased supply‑chain localization tends to raise manufacturing costs, compressing gross margins by several percentage points.
Geopolitical stability
Geopolitical instability — notably lingering Russia–Ukraine tensions and sanctions — disrupts industrial spending and logistics, forcing supply-chain reroutes and higher lead times. Energy-market volatility shifts customer budgets (Brent averaged about $85/bbl in 2024), compressing capex in sensitive end-markets. Project risk premiums rise in unstable regions, often adding hundreds of basis points to required returns, so geographic diversification reduces concentration risk.
- Conflicts/sanctions: supply-chain delays, higher logistics costs
- Energy volatility: Brent ≈ $85/bbl (2024)
- Risk premiums: +hundreds bps in unstable markets
- Diversification: mitigates country-concentration risk
Public procurement
Government-owned utilities and infrastructure agencies are primary buyers for CECO Environmental, driven by major federal programs such as the Infrastructure Investment and Jobs Act (≈1.2 trillion total, ≈550 billion new) and the Inflation Reduction Act (≈369 billion clean‑energy incentives) that expand sustainable procurement; procurement standards increasingly weight sustainability metrics, winning framework agreements can secure multi-year backlog, and long tender cycles demand robust bid management.
- Public procurement ≈12% of global GDP (World Bank)
- IIJA ≈550B new infrastructure funds
- IRA ≈369B clean‑energy funding
- Framework wins = multi‑year backlog
Net-zero pledges and big subsidies drive clean-energy capex; tariffs and elections raise timing risk
Governments' net-zero pledges (~140 countries, ~90% global emissions) and tighter EU/US rules drive compliance capex for CECO, while election cycles create timing risk. Large subsidies (IRA ≈369B; global clean‑energy investment $1.7T in 2023) and 45Q ($60–85/t) spur projects; tariffs (US 25% steel) and localization raise input costs. Geopolitical tensions and energy volatility (Brent ≈$85/bbl 2024) increase lead times and risk premiums, favoring diversification.
| Factor | Metric | Impact |
|---|---|---|
| Policy | ~140 countries, ~90% emissions | Drives demand |
| Funding | IRA ≈$369B; $1.7T (2023) | Boosts projects |
| Trade | US steel tariff 25% | Raises costs |
| Risk | Brent ≈$85/bbl (2024) | Increases premiums |
What is included in the product
Detailed Word Document
Explores how macro-environmental forces uniquely affect CECO Environmental across Political, Economic, Social, Technological, Environmental and Legal dimensions, with each section supported by current data and industry trends. Designed for executives and investors, it highlights threats, opportunities and forward-looking insights for strategic planning.
Customizable Excel Spreadsheet
Clean, summarized CECO Environmental PESTLE analysis that’s visually segmented by category for fast interpretation and easily dropped into presentations or strategy sessions. Editable notes and a shareable format speed team alignment and make external risk discussion practical during planning.
Economic factors
Capex cycles
CECO’s order book closely tracks industrial capex cycles, with demand rising during energy, chemicals, and manufacturing expansions and slowing in downturns.
Recessions commonly delay greenfield projects and retrofits as firms defer spending, reducing new-system orders for pollution-control equipment.
A resilient aftermarket — spare parts, service, and retrofits — helps stabilize CECO’s revenues and margins during cyclical troughs.
Interest rates
Higher policy rates (US fed funds 5.25–5.50% in mid‑2025) raise customers’ WACC and often defer non‑mandatory air‑pollution and water‑treatment projects. Elevated rates increase CECO Environmental’s financing costs, tightening working capital and potentially slowing M&A activity. A future rate cut could unlock pent‑up demand from postponed projects. Hedging and flexible payment terms help sustain order conversion amid rate volatility.
Commodity prices
Oil near $80–90/bbl and Henry Hub gas around $3–4/MMBtu in 2024–25, plus metals strength (steel input costs up roughly 10–15% YoY in 2024) drive CECO end-market activity and squeeze margins on components. Surcharges and indexing (energy/steel passthroughs) mitigate some inflation. Persistent price volatility complicates pricing on long-duration service and equipment contracts.
FX exposure
CECO Environmental's global sales and sourcing create currency risk; US dollar strength (DXY averaged about 104 in 2024) can weaken international competitiveness and translate foreign revenues lower in USD. Natural hedges from matched costs and revenues reduce transaction exposure, and pricing in local currencies aids market penetration and preserves margins.
- Global sales/sourcing: FX risk
- DXY avg ~104 (2024): USD headwind
- Natural hedges cut transaction exposure
- Local-currency pricing supports market share
Labor and logistics
Tight skilled labor markets—US unemployment ~3.8% in 2024—elevate CECO’s manufacturing and field-service costs and extend hiring timelines, pressuring margins. Freight and lead-time variability from post‑pandemic supply chains disrupt project schedules and increase buffer inventory needs. Nearshoring can improve on‑time delivery but raises unit costs; consistent operational excellence is essential to protect gross margins.
- Labor pressure: higher wage inflation
- Logistics: lead‑time volatility delays projects
- Nearshoring: reliability vs cost tradeoff
- OpEx: margin protection through efficiency
Net-zero pledges and big subsidies drive clean-energy capex; tariffs and elections raise timing risk
CECO’s revenues track industrial capex cycles; recessions delay greenfield/retrofit orders while aftermarket services stabilize cash flow. Higher rates (US fed funds 5.25–5.50% mid‑2025) and tight labor (unemployment ~3.8% in 2024) pressure customer WACC and CECO’s costs. Commodity/DXY swings (oil $80–90/bbl, DXY ~104, steel +10–15% YoY 2024) squeeze margins despite passthroughs.
| Metric | Value |
|---|---|
| Fed funds | 5.25–5.50% (mid‑2025) |
| Oil | $80–90/bbl (2024–25) |
| DXY | ~104 (2024) |
| Steel | +10–15% YoY (2024) |
| Unemployment | ~3.8% (US, 2024) |
What You See Is What You Get
CECO Environmental PESTLE Analysis
The preview shown here is the exact CECO Environmental PESTLE Analysis you’ll receive after purchase—fully formatted and ready to use. It includes political, economic, social, technological, legal and environmental assessments specific to CECO Environmental and is presented in the final, professional layout. No placeholders or edits; download the same file immediately after checkout.











