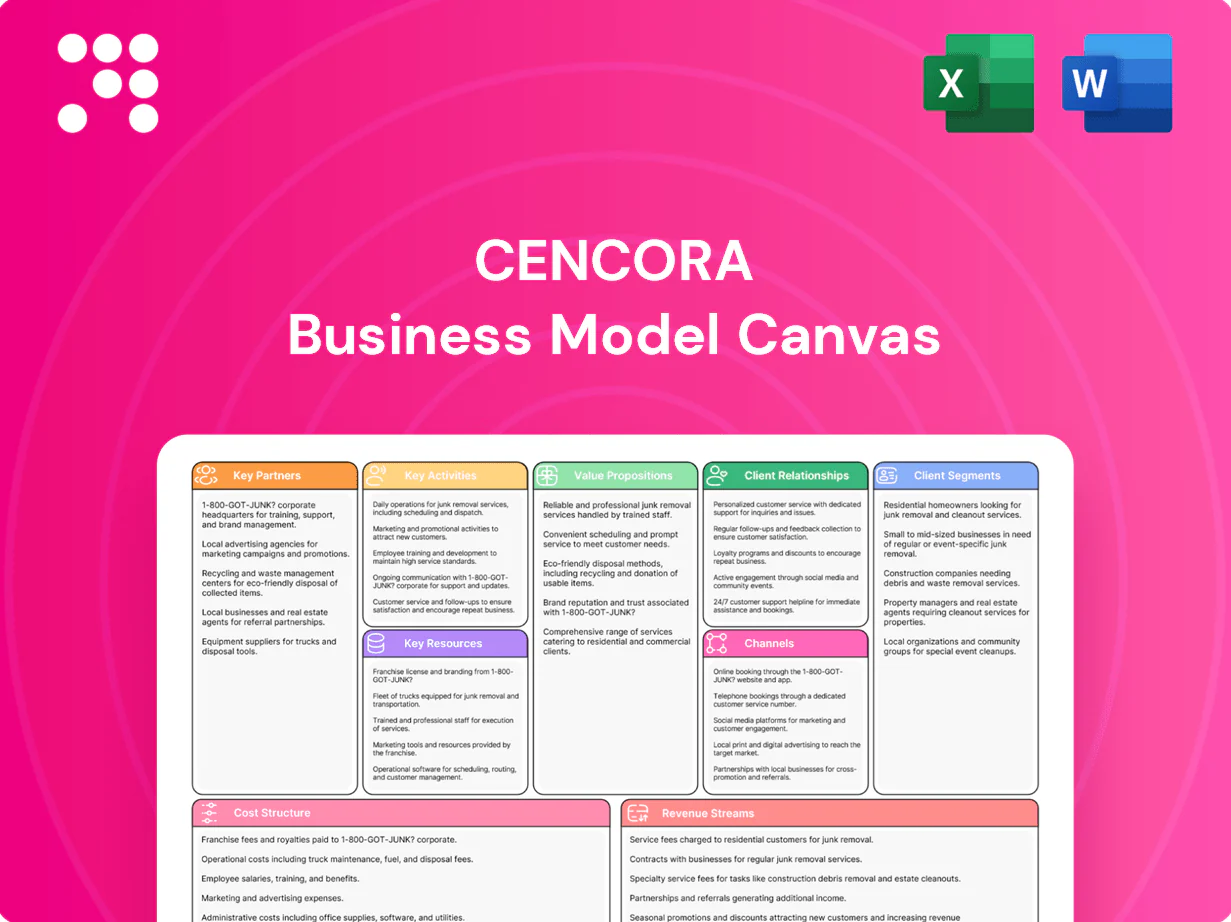
Cencora Business Model Canvas

Explore the Healthcare Business Model Canvas: concise map of value, scale, revenue
Discover Cencora’s strategic engine with our Business Model Canvas — a concise, actionable map of how the company creates value, scales solutions, and captures healthcare market share. This 4-sentence snapshot highlights key partners, revenue drivers, and competitive advantages. Want the full, editable Canvas with detailed insights and financial implications? Purchase the complete file for analysis-ready Word and Excel templates.
Partnerships

Pharmaceutical manufacturers alliances
Strategic sourcing and distribution agreements with pharmaceutical manufacturers secure reliable access to branded, generic and specialty therapies, aligning with a global pharma market estimated at about $1.6 trillion in 2024. Co-developing commercialization, channel and launch strategies accelerates market uptake and share capture. Collaborative patient support, REMS and serialization compliance mitigate regulatory risk. Joint demand and inventory planning stabilizes supply and reduces shortages.
Healthcare providers and health systems
Partnerships with over 6,000 US hospitals and roughly 230,000 outpatient clinics align procurement, inventory and clinical access pathways to reduce stockouts and shrink pharmacy costs—pilot programs report up to 5% savings. Co-create formulary strategies and 340B optimization where applicable to protect margins and safety-net funding. Integrate data flows for utilization, charge capture and value-based care alignment as ~40% of Medicare beneficiaries are in APMs, enabling continuity across inpatient, outpatient and specialty sites.

Pharmacies and specialty pharmacy networks
Independent, chain and mail-order pharmacies depend on Cencora's wholesaling and value-added services to supply more than 200 billion dollars in annual pharmaceutical flows, ensuring inventory reliability and margin support. Joint programs with pharmacies drive adherence, increase vaccination throughput and lift front-of-store revenues through coordinated promotions. Specialty pharmacy networks manage prior authorization, cold-chain logistics and limited-distribution access for high-cost biologics, while shared analytics inform plan design and manufacturer contracting to reduce total cost of care.

Payers, PBMs, and HUB service partners
Payers, PBMs, and HUB partners coordinate benefits verification, copay assistance, and prior authorization workflows to shorten time-to-therapy; specialty drugs now account for over 50% of pharmacy spend, driving integrated pathways and real-world evidence alignment. Financial assistance flows are managed for compliance and timeliness, with outcomes reporting and adherence programs shared across partners.
- Coordinate benefits verification
- Copay assistance & compliant cash flows
- Prior auth + faster time-to-therapy
- Align on outcomes, adherence, RWE
Logistics, cold-chain, and technology providers
Carriers, 3PLs, packaging and IoT partners extend Cencora’s reach and product integrity across temperature-sensitive lanes, supporting DSCSA-driven serialization and traceability efforts initiated after the Nov 27, 2023 milestone and ongoing through 2024.
Platform and analytics partners boost EDI/API connectivity, security, and real-time visibility; co-innovation with track-and-trace and serialization vendors strengthens chain-of-custody and compliance.
Redundant, SLA-backed carrier and 3PL networks reduce disruption risk and protect time- and temperature-sensitive inventories during global distribution.
- DSCSA milestone: Nov 27, 2023 — interoperability efforts continuing in 2024
- IoT + packaging: real-time temp visibility for cold-chain lanes
- SLA-backed redundancy: mitigates single-point failures
Networked supply deals unlock $1.6T pharma market, cut stockouts and save up to 5%
Strategic supplier and manufacturer deals secure access to branded, generic and specialty therapies within a $1.6T global pharma market (2024), supporting >$200B annual pharmaceutical flows. Network ties to 6,000 US hospitals and ~230,000 clinics cut stockouts and deliver pilot savings up to 5%. Partnerships with payers/PBMs manage copay, prior auth and RWE as specialty drugs exceed 50% of pharmacy spend.
| Partner | Scale/Count | Impact |
|---|---|---|
| Hospitals/Clinics | 6,000 / 230,000 | ≤5% cost savings |
| Manufacturers | — | Access to $1.6T market |
What is included in the product
 Detailed Word Document
A concise, investor-ready Business Model Canvas for Cencora detailing customer segments, channels, value propositions, revenue streams and key partners across the 9 BMC blocks; includes competitive advantage analysis and linked SWOT insights to support strategic decisions and funding discussions.

 Customizable Excel Spreadsheet
Streamlines Cencora's complex healthcare services and distribution strategy into an editable one-page canvas, eliminating hours of formatting and aligning stakeholders quickly. Ideal for boardrooms, team workshops, or side-by-side model comparisons.
Activities

Pharmaceutical distribution and fulfillment
Cencora procures, stores, and delivers medications across acute, retail, and specialty channels, supporting a network that generated about $246 billion in revenue in 2024. Operations execute pick-pack-ship with sub-24-hour cycle times and SLA-driven accuracy exceeding 99.9%. Cold-chain and chain-of-custody are enforced via GDP-certified facilities and real-time telemetry. Routing and inventory optimization improved inventory turns by roughly 10% year-over-year.
Specialty access and patient support services
Cencora operates centralized HUBs for benefits verification, prior authorization, and financial assistance, coordinating nurse education and adherence outreach to support specialty patients. Specialty medicines accounted for roughly 50% of US drug spend in 2024 per IQVIA, increasing demand for REMS and limited-distribution logistics that Cencora manages to reduce time-to-fill. These integrated services improve persistence and expedite therapy initiation across complex regimens.

Commercialization and 3PL solutions
Cencora provides launch planning, channel strategy and order-to-cash services for manufacturers, leveraging the global 3PL market estimated at about $1.3 trillion in 2024 to run warehousing, reverse logistics and trade operations as outsourced services. It delivers patient support program design and field solutions tailored to rare and cell/gene therapies, addressing rare diseases that affect roughly 400 million people worldwide. It also supports manufacturers’ global expansion and market access efforts.

Data, analytics, and insights delivery
Cencora aggregates demand, inventory, and dispensing data to inform procurement and clinical decisions, leveraging networks connected to the US ambulatory market that processes over 4.3 billion prescriptions annually (2022). It delivers forecasting, real‑world evidence signals, and payer‑pathway insights via dashboards, APIs, and configurable alerts while upholding HIPAA, SOC 2, and global privacy and security standards.
- Aggregate demand, inventory, dispensing
- Forecasting, RWE, payer pathways
- Dashboards, APIs, alerts
- HIPAA, SOC 2, global compliance
Regulatory, quality, and compliance management
Regulatory, quality, and compliance management enforces GDP, DSCSA (full unit-level interoperability effective 27 November 2023), licensure, and pharmacovigilance protocols; it conducts systematic audits, drives CAPAs and continuous improvement, and operates serialization, traceability and recall systems. The function also trains the workforce and monitors supplier quality to reduce supply‑chain risk and ensure patient safety.
- DSCSA: 27 Nov 2023 compliance
- Audits & CAPAs: ongoing programs
- Serialization/recalls: end-to-end traceability
- Training & supplier QA: continuous monitoring
Integrated supply chain: sub-24h fulfillment, 99.9% accuracy, specialty
Cencora manages procurement, warehousing and distribution across acute, retail and specialty, supporting a ~$246B revenue network in 2024 with sub-24h pick-pack-ship and >99.9% accuracy.
Centralized HUBs deliver prior authorization, benefits verification, nurse support and REMS logistics, cutting time-to-fill for specialty therapies (specialty ≈50% of US drug spend, 2024).
Manufacturer services include launch planning, 3PL warehousing, reverse logistics and RWE/forecasting, boosting inventory turns ~10% YoY; global 3PL market ≈$1.3T (2024).
| Activity | 2024 Metric |
|---|---|
| Distribution | ~$246B network, >99.9% accuracy |
| Specialty HUBs | Specialty ≈50% US drug spend |
| Manufacturer Services | Inventory turns +10% YoY; 3PL $1.3T |
| Compliance | DSCSA unit-level interoperability in force |
Preview Before You Purchase
Business Model Canvas
The Cencora Business Model Canvas you’re previewing is the actual deliverable—not a mockup—showing real content and layout from the final file. Upon purchase you’ll receive this same document in full, ready-to-edit in Word and Excel formats. No placeholders, no surprises—what you see is exactly what you’ll download.

Explore the Healthcare Business Model Canvas: concise map of value, scale, revenue
Discover Cencora’s strategic engine with our Business Model Canvas — a concise, actionable map of how the company creates value, scales solutions, and captures healthcare market share. This 4-sentence snapshot highlights key partners, revenue drivers, and competitive advantages. Want the full, editable Canvas with detailed insights and financial implications? Purchase the complete file for analysis-ready Word and Excel templates.
Partnerships
Pharmaceutical manufacturers alliances
Strategic sourcing and distribution agreements with pharmaceutical manufacturers secure reliable access to branded, generic and specialty therapies, aligning with a global pharma market estimated at about $1.6 trillion in 2024. Co-developing commercialization, channel and launch strategies accelerates market uptake and share capture. Collaborative patient support, REMS and serialization compliance mitigate regulatory risk. Joint demand and inventory planning stabilizes supply and reduces shortages.
Healthcare providers and health systems
Partnerships with over 6,000 US hospitals and roughly 230,000 outpatient clinics align procurement, inventory and clinical access pathways to reduce stockouts and shrink pharmacy costs—pilot programs report up to 5% savings. Co-create formulary strategies and 340B optimization where applicable to protect margins and safety-net funding. Integrate data flows for utilization, charge capture and value-based care alignment as ~40% of Medicare beneficiaries are in APMs, enabling continuity across inpatient, outpatient and specialty sites.
Pharmacies and specialty pharmacy networks
Independent, chain and mail-order pharmacies depend on Cencora's wholesaling and value-added services to supply more than 200 billion dollars in annual pharmaceutical flows, ensuring inventory reliability and margin support. Joint programs with pharmacies drive adherence, increase vaccination throughput and lift front-of-store revenues through coordinated promotions. Specialty pharmacy networks manage prior authorization, cold-chain logistics and limited-distribution access for high-cost biologics, while shared analytics inform plan design and manufacturer contracting to reduce total cost of care.
Payers, PBMs, and HUB service partners
Payers, PBMs, and HUB partners coordinate benefits verification, copay assistance, and prior authorization workflows to shorten time-to-therapy; specialty drugs now account for over 50% of pharmacy spend, driving integrated pathways and real-world evidence alignment. Financial assistance flows are managed for compliance and timeliness, with outcomes reporting and adherence programs shared across partners.
- Coordinate benefits verification
- Copay assistance & compliant cash flows
- Prior auth + faster time-to-therapy
- Align on outcomes, adherence, RWE
Logistics, cold-chain, and technology providers
Carriers, 3PLs, packaging and IoT partners extend Cencora’s reach and product integrity across temperature-sensitive lanes, supporting DSCSA-driven serialization and traceability efforts initiated after the Nov 27, 2023 milestone and ongoing through 2024.
Platform and analytics partners boost EDI/API connectivity, security, and real-time visibility; co-innovation with track-and-trace and serialization vendors strengthens chain-of-custody and compliance.
Redundant, SLA-backed carrier and 3PL networks reduce disruption risk and protect time- and temperature-sensitive inventories during global distribution.
- DSCSA milestone: Nov 27, 2023 — interoperability efforts continuing in 2024
- IoT + packaging: real-time temp visibility for cold-chain lanes
- SLA-backed redundancy: mitigates single-point failures
Networked supply deals unlock $1.6T pharma market, cut stockouts and save up to 5%
Strategic supplier and manufacturer deals secure access to branded, generic and specialty therapies within a $1.6T global pharma market (2024), supporting >$200B annual pharmaceutical flows. Network ties to 6,000 US hospitals and ~230,000 clinics cut stockouts and deliver pilot savings up to 5%. Partnerships with payers/PBMs manage copay, prior auth and RWE as specialty drugs exceed 50% of pharmacy spend.
| Partner | Scale/Count | Impact |
|---|---|---|
| Hospitals/Clinics | 6,000 / 230,000 | ≤5% cost savings |
| Manufacturers | — | Access to $1.6T market |
What is included in the product
Detailed Word Document
A concise, investor-ready Business Model Canvas for Cencora detailing customer segments, channels, value propositions, revenue streams and key partners across the 9 BMC blocks; includes competitive advantage analysis and linked SWOT insights to support strategic decisions and funding discussions.
Customizable Excel Spreadsheet
Streamlines Cencora's complex healthcare services and distribution strategy into an editable one-page canvas, eliminating hours of formatting and aligning stakeholders quickly. Ideal for boardrooms, team workshops, or side-by-side model comparisons.
Activities
Pharmaceutical distribution and fulfillment
Cencora procures, stores, and delivers medications across acute, retail, and specialty channels, supporting a network that generated about $246 billion in revenue in 2024. Operations execute pick-pack-ship with sub-24-hour cycle times and SLA-driven accuracy exceeding 99.9%. Cold-chain and chain-of-custody are enforced via GDP-certified facilities and real-time telemetry. Routing and inventory optimization improved inventory turns by roughly 10% year-over-year.
Specialty access and patient support services
Cencora operates centralized HUBs for benefits verification, prior authorization, and financial assistance, coordinating nurse education and adherence outreach to support specialty patients. Specialty medicines accounted for roughly 50% of US drug spend in 2024 per IQVIA, increasing demand for REMS and limited-distribution logistics that Cencora manages to reduce time-to-fill. These integrated services improve persistence and expedite therapy initiation across complex regimens.
Commercialization and 3PL solutions
Cencora provides launch planning, channel strategy and order-to-cash services for manufacturers, leveraging the global 3PL market estimated at about $1.3 trillion in 2024 to run warehousing, reverse logistics and trade operations as outsourced services. It delivers patient support program design and field solutions tailored to rare and cell/gene therapies, addressing rare diseases that affect roughly 400 million people worldwide. It also supports manufacturers’ global expansion and market access efforts.
Data, analytics, and insights delivery
Cencora aggregates demand, inventory, and dispensing data to inform procurement and clinical decisions, leveraging networks connected to the US ambulatory market that processes over 4.3 billion prescriptions annually (2022). It delivers forecasting, real‑world evidence signals, and payer‑pathway insights via dashboards, APIs, and configurable alerts while upholding HIPAA, SOC 2, and global privacy and security standards.
- Aggregate demand, inventory, dispensing
- Forecasting, RWE, payer pathways
- Dashboards, APIs, alerts
- HIPAA, SOC 2, global compliance
Regulatory, quality, and compliance management
Regulatory, quality, and compliance management enforces GDP, DSCSA (full unit-level interoperability effective 27 November 2023), licensure, and pharmacovigilance protocols; it conducts systematic audits, drives CAPAs and continuous improvement, and operates serialization, traceability and recall systems. The function also trains the workforce and monitors supplier quality to reduce supply‑chain risk and ensure patient safety.
- DSCSA: 27 Nov 2023 compliance
- Audits & CAPAs: ongoing programs
- Serialization/recalls: end-to-end traceability
- Training & supplier QA: continuous monitoring
Integrated supply chain: sub-24h fulfillment, 99.9% accuracy, specialty
Cencora manages procurement, warehousing and distribution across acute, retail and specialty, supporting a ~$246B revenue network in 2024 with sub-24h pick-pack-ship and >99.9% accuracy.
Centralized HUBs deliver prior authorization, benefits verification, nurse support and REMS logistics, cutting time-to-fill for specialty therapies (specialty ≈50% of US drug spend, 2024).
Manufacturer services include launch planning, 3PL warehousing, reverse logistics and RWE/forecasting, boosting inventory turns ~10% YoY; global 3PL market ≈$1.3T (2024).
| Activity | 2024 Metric |
|---|---|
| Distribution | ~$246B network, >99.9% accuracy |
| Specialty HUBs | Specialty ≈50% US drug spend |
| Manufacturer Services | Inventory turns +10% YoY; 3PL $1.3T |
| Compliance | DSCSA unit-level interoperability in force |
Preview Before You Purchase
Business Model Canvas
The Cencora Business Model Canvas you’re previewing is the actual deliverable—not a mockup—showing real content and layout from the final file. Upon purchase you’ll receive this same document in full, ready-to-edit in Word and Excel formats. No placeholders, no surprises—what you see is exactly what you’ll download.
Original: $10.00
-65%$10.00
$3.50Description
Explore the Healthcare Business Model Canvas: concise map of value, scale, revenue
Discover Cencora’s strategic engine with our Business Model Canvas — a concise, actionable map of how the company creates value, scales solutions, and captures healthcare market share. This 4-sentence snapshot highlights key partners, revenue drivers, and competitive advantages. Want the full, editable Canvas with detailed insights and financial implications? Purchase the complete file for analysis-ready Word and Excel templates.
Partnerships
Pharmaceutical manufacturers alliances
Strategic sourcing and distribution agreements with pharmaceutical manufacturers secure reliable access to branded, generic and specialty therapies, aligning with a global pharma market estimated at about $1.6 trillion in 2024. Co-developing commercialization, channel and launch strategies accelerates market uptake and share capture. Collaborative patient support, REMS and serialization compliance mitigate regulatory risk. Joint demand and inventory planning stabilizes supply and reduces shortages.
Healthcare providers and health systems
Partnerships with over 6,000 US hospitals and roughly 230,000 outpatient clinics align procurement, inventory and clinical access pathways to reduce stockouts and shrink pharmacy costs—pilot programs report up to 5% savings. Co-create formulary strategies and 340B optimization where applicable to protect margins and safety-net funding. Integrate data flows for utilization, charge capture and value-based care alignment as ~40% of Medicare beneficiaries are in APMs, enabling continuity across inpatient, outpatient and specialty sites.
Pharmacies and specialty pharmacy networks
Independent, chain and mail-order pharmacies depend on Cencora's wholesaling and value-added services to supply more than 200 billion dollars in annual pharmaceutical flows, ensuring inventory reliability and margin support. Joint programs with pharmacies drive adherence, increase vaccination throughput and lift front-of-store revenues through coordinated promotions. Specialty pharmacy networks manage prior authorization, cold-chain logistics and limited-distribution access for high-cost biologics, while shared analytics inform plan design and manufacturer contracting to reduce total cost of care.
Payers, PBMs, and HUB service partners
Payers, PBMs, and HUB partners coordinate benefits verification, copay assistance, and prior authorization workflows to shorten time-to-therapy; specialty drugs now account for over 50% of pharmacy spend, driving integrated pathways and real-world evidence alignment. Financial assistance flows are managed for compliance and timeliness, with outcomes reporting and adherence programs shared across partners.
- Coordinate benefits verification
- Copay assistance & compliant cash flows
- Prior auth + faster time-to-therapy
- Align on outcomes, adherence, RWE
Logistics, cold-chain, and technology providers
Carriers, 3PLs, packaging and IoT partners extend Cencora’s reach and product integrity across temperature-sensitive lanes, supporting DSCSA-driven serialization and traceability efforts initiated after the Nov 27, 2023 milestone and ongoing through 2024.
Platform and analytics partners boost EDI/API connectivity, security, and real-time visibility; co-innovation with track-and-trace and serialization vendors strengthens chain-of-custody and compliance.
Redundant, SLA-backed carrier and 3PL networks reduce disruption risk and protect time- and temperature-sensitive inventories during global distribution.
- DSCSA milestone: Nov 27, 2023 — interoperability efforts continuing in 2024
- IoT + packaging: real-time temp visibility for cold-chain lanes
- SLA-backed redundancy: mitigates single-point failures
Networked supply deals unlock $1.6T pharma market, cut stockouts and save up to 5%
Strategic supplier and manufacturer deals secure access to branded, generic and specialty therapies within a $1.6T global pharma market (2024), supporting >$200B annual pharmaceutical flows. Network ties to 6,000 US hospitals and ~230,000 clinics cut stockouts and deliver pilot savings up to 5%. Partnerships with payers/PBMs manage copay, prior auth and RWE as specialty drugs exceed 50% of pharmacy spend.
| Partner | Scale/Count | Impact |
|---|---|---|
| Hospitals/Clinics | 6,000 / 230,000 | ≤5% cost savings |
| Manufacturers | — | Access to $1.6T market |
What is included in the product
Detailed Word Document
A concise, investor-ready Business Model Canvas for Cencora detailing customer segments, channels, value propositions, revenue streams and key partners across the 9 BMC blocks; includes competitive advantage analysis and linked SWOT insights to support strategic decisions and funding discussions.
Customizable Excel Spreadsheet
Streamlines Cencora's complex healthcare services and distribution strategy into an editable one-page canvas, eliminating hours of formatting and aligning stakeholders quickly. Ideal for boardrooms, team workshops, or side-by-side model comparisons.
Activities
Pharmaceutical distribution and fulfillment
Cencora procures, stores, and delivers medications across acute, retail, and specialty channels, supporting a network that generated about $246 billion in revenue in 2024. Operations execute pick-pack-ship with sub-24-hour cycle times and SLA-driven accuracy exceeding 99.9%. Cold-chain and chain-of-custody are enforced via GDP-certified facilities and real-time telemetry. Routing and inventory optimization improved inventory turns by roughly 10% year-over-year.
Specialty access and patient support services
Cencora operates centralized HUBs for benefits verification, prior authorization, and financial assistance, coordinating nurse education and adherence outreach to support specialty patients. Specialty medicines accounted for roughly 50% of US drug spend in 2024 per IQVIA, increasing demand for REMS and limited-distribution logistics that Cencora manages to reduce time-to-fill. These integrated services improve persistence and expedite therapy initiation across complex regimens.
Commercialization and 3PL solutions
Cencora provides launch planning, channel strategy and order-to-cash services for manufacturers, leveraging the global 3PL market estimated at about $1.3 trillion in 2024 to run warehousing, reverse logistics and trade operations as outsourced services. It delivers patient support program design and field solutions tailored to rare and cell/gene therapies, addressing rare diseases that affect roughly 400 million people worldwide. It also supports manufacturers’ global expansion and market access efforts.
Data, analytics, and insights delivery
Cencora aggregates demand, inventory, and dispensing data to inform procurement and clinical decisions, leveraging networks connected to the US ambulatory market that processes over 4.3 billion prescriptions annually (2022). It delivers forecasting, real‑world evidence signals, and payer‑pathway insights via dashboards, APIs, and configurable alerts while upholding HIPAA, SOC 2, and global privacy and security standards.
- Aggregate demand, inventory, dispensing
- Forecasting, RWE, payer pathways
- Dashboards, APIs, alerts
- HIPAA, SOC 2, global compliance
Regulatory, quality, and compliance management
Regulatory, quality, and compliance management enforces GDP, DSCSA (full unit-level interoperability effective 27 November 2023), licensure, and pharmacovigilance protocols; it conducts systematic audits, drives CAPAs and continuous improvement, and operates serialization, traceability and recall systems. The function also trains the workforce and monitors supplier quality to reduce supply‑chain risk and ensure patient safety.
- DSCSA: 27 Nov 2023 compliance
- Audits & CAPAs: ongoing programs
- Serialization/recalls: end-to-end traceability
- Training & supplier QA: continuous monitoring
Integrated supply chain: sub-24h fulfillment, 99.9% accuracy, specialty
Cencora manages procurement, warehousing and distribution across acute, retail and specialty, supporting a ~$246B revenue network in 2024 with sub-24h pick-pack-ship and >99.9% accuracy.
Centralized HUBs deliver prior authorization, benefits verification, nurse support and REMS logistics, cutting time-to-fill for specialty therapies (specialty ≈50% of US drug spend, 2024).
Manufacturer services include launch planning, 3PL warehousing, reverse logistics and RWE/forecasting, boosting inventory turns ~10% YoY; global 3PL market ≈$1.3T (2024).
| Activity | 2024 Metric |
|---|---|
| Distribution | ~$246B network, >99.9% accuracy |
| Specialty HUBs | Specialty ≈50% US drug spend |
| Manufacturer Services | Inventory turns +10% YoY; 3PL $1.3T |
| Compliance | DSCSA unit-level interoperability in force |
Preview Before You Purchase
Business Model Canvas
The Cencora Business Model Canvas you’re previewing is the actual deliverable—not a mockup—showing real content and layout from the final file. Upon purchase you’ll receive this same document in full, ready-to-edit in Word and Excel formats. No placeholders, no surprises—what you see is exactly what you’ll download.











