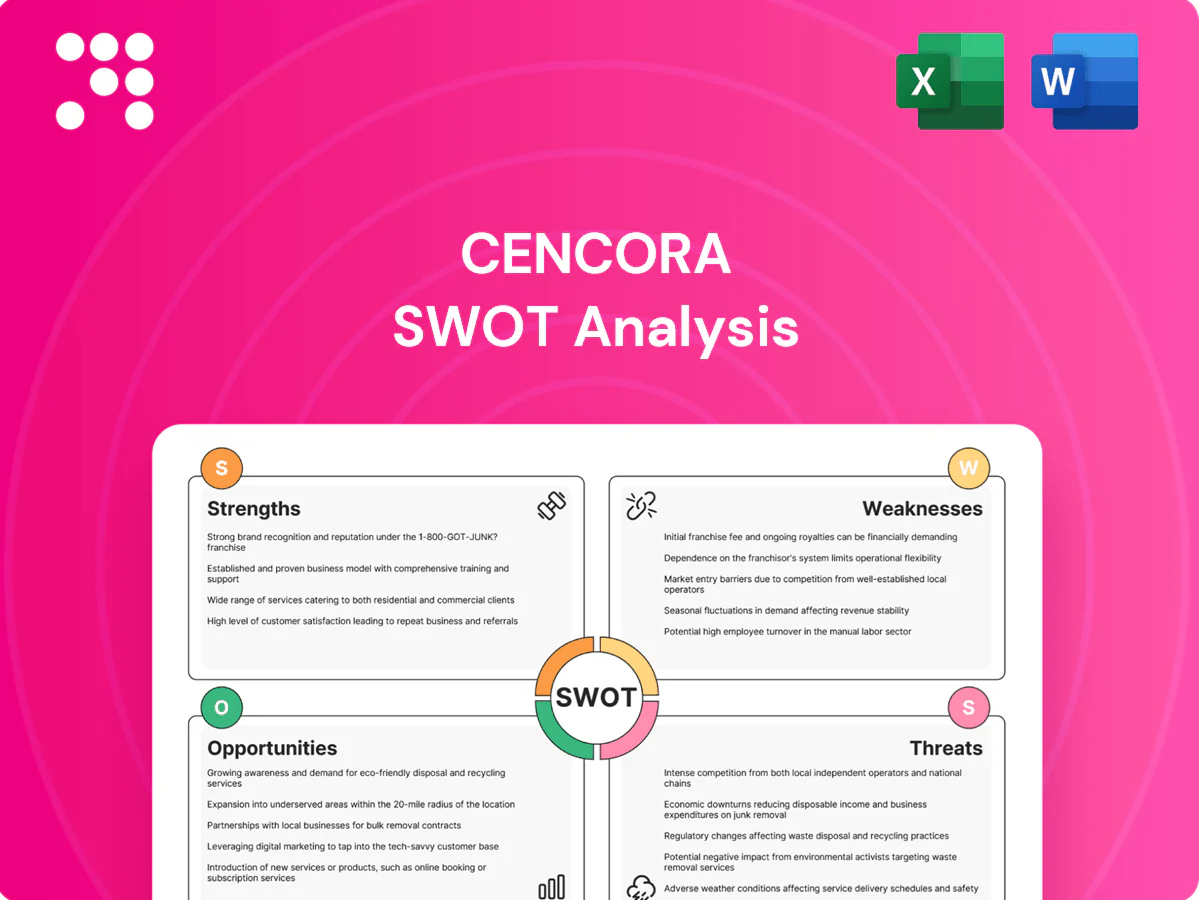
Cencora SWOT Analysis

Make Insightful Decisions Backed by Expert Research
Cencora's SWOT analysis uncovers competitive strengths like scale and integrated supply-chain capabilities, balanced against regulatory risks and margin pressures from reimbursement trends. Explore growth drivers, market threats, and strategic gaps to inform investment or partnership decisions. Purchase the full, editable SWOT report (Word + Excel) for actionable insights and presentations.
Strengths

Global scale and distribution reach
Cencora’s extensive global logistics network supports on-time deliveries to pharmacies, hospitals and clinics, underpinning its 2023 revenue scale of about $238.6 billion and enabling significant purchasing leverage and operational efficiencies that lower unit costs. Broad geographic coverage improves resilience during demand spikes or shortages and deepens strategic partnerships with multinational manufacturers, reinforcing supply reliability and contract terms.
Deep manufacturer and provider partnerships
Deep, longstanding ties with major pharmaceutical manufacturers secure allocation priority and favorable contracting, reinforcing Cencora's position as a top-three global pharmaceutical distributor and service provider. Embedded relationships with providers generate sticky, recurring volumes across thousands of health systems and community pharmacies. Cross-functional collaboration in commercialization, market access, and patient support drives margin-accretive services beyond distribution. Broad partnership breadth enhances resilience to single-channel disruptions.

Specialty and patient support capabilities
Specialty drug handling, extensive cold-chain logistics and hub services enable Cencora to support complex therapies and drove part of the company’s ~$238 billion 2024 revenue mix, boosting higher-margin services versus commodity distribution. Robust patient access, prior authorization and adherence programs reduce friction and improve uptake, enhancing retention and lifetime value. Deep expertise in oncology, rare disease and chronic therapies strengthens competitive positioning and margin resilience.

Data, analytics, and technology solutions
Data, analytics, and technology solutions at Cencora optimize inventory and demand forecasting to improve supply reliability, with pilot programs reporting roughly 25% reductions in stockouts and expiries. Real-time visibility cuts waste for providers and manufacturers, supporting tighter compliance and cold-chain management. Data-driven insights inform market access and trade strategies while technology entrenchment raises customer switching costs.
- Inventory optimization: ~25% fewer stockouts/expiries in pilots
- Real-time visibility: lower waste, improved cold-chain compliance
- Strategic insights: supports market access and trade
- High switching costs: deep tech integration with clients
Diversified service portfolio
Diversified service portfolio spans distribution, 3PL, specialty pharmacy, consulting and international operations, creating multiple revenue streams that dampen cyclical or policy-driven shocks in any single segment. Cross-sell capabilities raise wallet share per client and support more stable, predictable cash flows across business cycles.
- Complementary offerings
- Multiple revenue streams
- Cross-sell expansion
- Stabilized cash flow
Top-3 distributor scale and cold-chain logistics drive higher-margin specialty volumes
Cencora’s top-three global distribution scale (2024 revenue ~$238.6B) and extensive logistics/ cold-chain network deliver purchasing leverage, on-time fill and resilience across thousands of provider and pharmacy customers. Deep manufacturer partnerships and embedded patient-access services drive recurring, higher-margin specialty volumes and raise switching costs via analytics and integrated tech.
| Metric | Value |
|---|---|
| 2024 revenue | $238.6B |
| Global rank | Top‑3 distributor |
| Pilot stockout reduction | ~25% |
What is included in the product
 Detailed Word Document
Provides a concise SWOT analysis of Cencora, outlining strengths, weaknesses, opportunities, and threats to assess its competitive position, growth drivers, operational gaps, and market risks.

 Customizable Excel Spreadsheet
Provides a concise Cencora SWOT matrix for fast, visual strategy alignment, enabling executives to identify strengths, weaknesses, opportunities and threats at a glance.
Weaknesses

Thin operating margins
Core distribution is a high-volume, low-margin business for Cencora, with operating margins typically in the low single digits. Profitability relies on tight execution and scale, leaving little cushion for supply-chain or reimbursement shocks. Pricing pressure from payors and manufacturers can quickly compress earnings. Sustained margin expansion is structurally challenging given the business model.
Working capital intensity
Working capital intensity is high: Cencora's large inventories and manufacturer receivables/payables tie up cash—inventory and receivables exceed $30 billion combined, pressuring liquidity as FY2024 revenue neared $238 billion. Rising drug prices increase funding needs and credit risk, while payment-term volatility (DSO swings of several weeks) strains cash flow, making efficient cash conversion critical but hard to optimize across cycles.

Customer and manufacturer concentration
Cencora generates over $200 billion in annual revenue (2024), so losing or repricing a large account would materially dent top-line results. Heavy reliance on a few manufacturers raises risk of unfavorable contract renegotiations. Provider and payer consolidation (CVS, UnitedHealth, Walgreens scale) magnifies buyer power. Concentration also heightens exposure to therapeutic areas like oncology and specialty drugs, which now drive over half of US drug spend.

Regulatory and compliance complexity
Distribution of controlled and specialty substances requires rigorous chain-of-custody, security and DEA controls, increasing operational overhead and risk exposure. Evolving rules across U.S. states and international markets raise compliance costs and slow cross-border service rollouts. Audit findings or lapses can trigger fines and reputational damage that impede growth.
- High control requirements
- Rising multijurisdictional compliance costs
- Audit/fine reputational risk
- Slower service rollout
Exposure to litigation and reputational risk
- Known industry settlement scale: multi-billion dollars
- Legal reserves: volatile quarter-to-quarter
- Reputation risk: affects payers, providers, investors
- Compliance missteps: increase fines and financial volatility
Low-margin distribution; >$30B working capital vs $238B revenue; litigation risk
Core distribution is low-margin (operating margins in low single digits) and scale-dependent, exposing earnings to payor/manufacturer pricing pressure. Working capital is intensive—inventory plus receivables >$30B vs FY2024 revenue ~$238B—pressuring liquidity. Concentration on large accounts and specialty oncology drugs raises contract and pricing risk. Ongoing litigation/compliance exposure has produced multi-billion-dollar settlements and volatile legal reserves.
| Metric | Value |
|---|---|
| FY2024 Revenue | $238B |
| Inventory + Receivables | >$30B |
| Operating Margin | Low single digits |
| Legal Settlement Scale | Multi-billion $ |
What You See Is What You Get
Cencora SWOT Analysis
This is the actual Cencora SWOT analysis document you’ll receive upon purchase—no surprises, just professional quality. The preview below is taken directly from the full SWOT report you'll get, with the same structured findings: strengths, weaknesses, opportunities and threats. Purchase unlocks the complete, editable file for immediate download.

Make Insightful Decisions Backed by Expert Research
Cencora's SWOT analysis uncovers competitive strengths like scale and integrated supply-chain capabilities, balanced against regulatory risks and margin pressures from reimbursement trends. Explore growth drivers, market threats, and strategic gaps to inform investment or partnership decisions. Purchase the full, editable SWOT report (Word + Excel) for actionable insights and presentations.
Strengths
Global scale and distribution reach
Cencora’s extensive global logistics network supports on-time deliveries to pharmacies, hospitals and clinics, underpinning its 2023 revenue scale of about $238.6 billion and enabling significant purchasing leverage and operational efficiencies that lower unit costs. Broad geographic coverage improves resilience during demand spikes or shortages and deepens strategic partnerships with multinational manufacturers, reinforcing supply reliability and contract terms.
Deep manufacturer and provider partnerships
Deep, longstanding ties with major pharmaceutical manufacturers secure allocation priority and favorable contracting, reinforcing Cencora's position as a top-three global pharmaceutical distributor and service provider. Embedded relationships with providers generate sticky, recurring volumes across thousands of health systems and community pharmacies. Cross-functional collaboration in commercialization, market access, and patient support drives margin-accretive services beyond distribution. Broad partnership breadth enhances resilience to single-channel disruptions.
Specialty and patient support capabilities
Specialty drug handling, extensive cold-chain logistics and hub services enable Cencora to support complex therapies and drove part of the company’s ~$238 billion 2024 revenue mix, boosting higher-margin services versus commodity distribution. Robust patient access, prior authorization and adherence programs reduce friction and improve uptake, enhancing retention and lifetime value. Deep expertise in oncology, rare disease and chronic therapies strengthens competitive positioning and margin resilience.
Data, analytics, and technology solutions
Data, analytics, and technology solutions at Cencora optimize inventory and demand forecasting to improve supply reliability, with pilot programs reporting roughly 25% reductions in stockouts and expiries. Real-time visibility cuts waste for providers and manufacturers, supporting tighter compliance and cold-chain management. Data-driven insights inform market access and trade strategies while technology entrenchment raises customer switching costs.
- Inventory optimization: ~25% fewer stockouts/expiries in pilots
- Real-time visibility: lower waste, improved cold-chain compliance
- Strategic insights: supports market access and trade
- High switching costs: deep tech integration with clients
Diversified service portfolio
Diversified service portfolio spans distribution, 3PL, specialty pharmacy, consulting and international operations, creating multiple revenue streams that dampen cyclical or policy-driven shocks in any single segment. Cross-sell capabilities raise wallet share per client and support more stable, predictable cash flows across business cycles.
- Complementary offerings
- Multiple revenue streams
- Cross-sell expansion
- Stabilized cash flow
Top-3 distributor scale and cold-chain logistics drive higher-margin specialty volumes
Cencora’s top-three global distribution scale (2024 revenue ~$238.6B) and extensive logistics/ cold-chain network deliver purchasing leverage, on-time fill and resilience across thousands of provider and pharmacy customers. Deep manufacturer partnerships and embedded patient-access services drive recurring, higher-margin specialty volumes and raise switching costs via analytics and integrated tech.
| Metric | Value |
|---|---|
| 2024 revenue | $238.6B |
| Global rank | Top‑3 distributor |
| Pilot stockout reduction | ~25% |
What is included in the product
Detailed Word Document
Provides a concise SWOT analysis of Cencora, outlining strengths, weaknesses, opportunities, and threats to assess its competitive position, growth drivers, operational gaps, and market risks.
Customizable Excel Spreadsheet
Provides a concise Cencora SWOT matrix for fast, visual strategy alignment, enabling executives to identify strengths, weaknesses, opportunities and threats at a glance.
Weaknesses
Thin operating margins
Core distribution is a high-volume, low-margin business for Cencora, with operating margins typically in the low single digits. Profitability relies on tight execution and scale, leaving little cushion for supply-chain or reimbursement shocks. Pricing pressure from payors and manufacturers can quickly compress earnings. Sustained margin expansion is structurally challenging given the business model.
Working capital intensity
Working capital intensity is high: Cencora's large inventories and manufacturer receivables/payables tie up cash—inventory and receivables exceed $30 billion combined, pressuring liquidity as FY2024 revenue neared $238 billion. Rising drug prices increase funding needs and credit risk, while payment-term volatility (DSO swings of several weeks) strains cash flow, making efficient cash conversion critical but hard to optimize across cycles.
Customer and manufacturer concentration
Cencora generates over $200 billion in annual revenue (2024), so losing or repricing a large account would materially dent top-line results. Heavy reliance on a few manufacturers raises risk of unfavorable contract renegotiations. Provider and payer consolidation (CVS, UnitedHealth, Walgreens scale) magnifies buyer power. Concentration also heightens exposure to therapeutic areas like oncology and specialty drugs, which now drive over half of US drug spend.
Regulatory and compliance complexity
Distribution of controlled and specialty substances requires rigorous chain-of-custody, security and DEA controls, increasing operational overhead and risk exposure. Evolving rules across U.S. states and international markets raise compliance costs and slow cross-border service rollouts. Audit findings or lapses can trigger fines and reputational damage that impede growth.
- High control requirements
- Rising multijurisdictional compliance costs
- Audit/fine reputational risk
- Slower service rollout
Exposure to litigation and reputational risk
- Known industry settlement scale: multi-billion dollars
- Legal reserves: volatile quarter-to-quarter
- Reputation risk: affects payers, providers, investors
- Compliance missteps: increase fines and financial volatility
Low-margin distribution; >$30B working capital vs $238B revenue; litigation risk
Core distribution is low-margin (operating margins in low single digits) and scale-dependent, exposing earnings to payor/manufacturer pricing pressure. Working capital is intensive—inventory plus receivables >$30B vs FY2024 revenue ~$238B—pressuring liquidity. Concentration on large accounts and specialty oncology drugs raises contract and pricing risk. Ongoing litigation/compliance exposure has produced multi-billion-dollar settlements and volatile legal reserves.
| Metric | Value |
|---|---|
| FY2024 Revenue | $238B |
| Inventory + Receivables | >$30B |
| Operating Margin | Low single digits |
| Legal Settlement Scale | Multi-billion $ |
What You See Is What You Get
Cencora SWOT Analysis
This is the actual Cencora SWOT analysis document you’ll receive upon purchase—no surprises, just professional quality. The preview below is taken directly from the full SWOT report you'll get, with the same structured findings: strengths, weaknesses, opportunities and threats. Purchase unlocks the complete, editable file for immediate download.
Original: $10.00
-65%$10.00
$3.50Description
Make Insightful Decisions Backed by Expert Research
Cencora's SWOT analysis uncovers competitive strengths like scale and integrated supply-chain capabilities, balanced against regulatory risks and margin pressures from reimbursement trends. Explore growth drivers, market threats, and strategic gaps to inform investment or partnership decisions. Purchase the full, editable SWOT report (Word + Excel) for actionable insights and presentations.
Strengths
Global scale and distribution reach
Cencora’s extensive global logistics network supports on-time deliveries to pharmacies, hospitals and clinics, underpinning its 2023 revenue scale of about $238.6 billion and enabling significant purchasing leverage and operational efficiencies that lower unit costs. Broad geographic coverage improves resilience during demand spikes or shortages and deepens strategic partnerships with multinational manufacturers, reinforcing supply reliability and contract terms.
Deep manufacturer and provider partnerships
Deep, longstanding ties with major pharmaceutical manufacturers secure allocation priority and favorable contracting, reinforcing Cencora's position as a top-three global pharmaceutical distributor and service provider. Embedded relationships with providers generate sticky, recurring volumes across thousands of health systems and community pharmacies. Cross-functional collaboration in commercialization, market access, and patient support drives margin-accretive services beyond distribution. Broad partnership breadth enhances resilience to single-channel disruptions.
Specialty and patient support capabilities
Specialty drug handling, extensive cold-chain logistics and hub services enable Cencora to support complex therapies and drove part of the company’s ~$238 billion 2024 revenue mix, boosting higher-margin services versus commodity distribution. Robust patient access, prior authorization and adherence programs reduce friction and improve uptake, enhancing retention and lifetime value. Deep expertise in oncology, rare disease and chronic therapies strengthens competitive positioning and margin resilience.
Data, analytics, and technology solutions
Data, analytics, and technology solutions at Cencora optimize inventory and demand forecasting to improve supply reliability, with pilot programs reporting roughly 25% reductions in stockouts and expiries. Real-time visibility cuts waste for providers and manufacturers, supporting tighter compliance and cold-chain management. Data-driven insights inform market access and trade strategies while technology entrenchment raises customer switching costs.
- Inventory optimization: ~25% fewer stockouts/expiries in pilots
- Real-time visibility: lower waste, improved cold-chain compliance
- Strategic insights: supports market access and trade
- High switching costs: deep tech integration with clients
Diversified service portfolio
Diversified service portfolio spans distribution, 3PL, specialty pharmacy, consulting and international operations, creating multiple revenue streams that dampen cyclical or policy-driven shocks in any single segment. Cross-sell capabilities raise wallet share per client and support more stable, predictable cash flows across business cycles.
- Complementary offerings
- Multiple revenue streams
- Cross-sell expansion
- Stabilized cash flow
Top-3 distributor scale and cold-chain logistics drive higher-margin specialty volumes
Cencora’s top-three global distribution scale (2024 revenue ~$238.6B) and extensive logistics/ cold-chain network deliver purchasing leverage, on-time fill and resilience across thousands of provider and pharmacy customers. Deep manufacturer partnerships and embedded patient-access services drive recurring, higher-margin specialty volumes and raise switching costs via analytics and integrated tech.
| Metric | Value |
|---|---|
| 2024 revenue | $238.6B |
| Global rank | Top‑3 distributor |
| Pilot stockout reduction | ~25% |
What is included in the product
Detailed Word Document
Provides a concise SWOT analysis of Cencora, outlining strengths, weaknesses, opportunities, and threats to assess its competitive position, growth drivers, operational gaps, and market risks.
Customizable Excel Spreadsheet
Provides a concise Cencora SWOT matrix for fast, visual strategy alignment, enabling executives to identify strengths, weaknesses, opportunities and threats at a glance.
Weaknesses
Thin operating margins
Core distribution is a high-volume, low-margin business for Cencora, with operating margins typically in the low single digits. Profitability relies on tight execution and scale, leaving little cushion for supply-chain or reimbursement shocks. Pricing pressure from payors and manufacturers can quickly compress earnings. Sustained margin expansion is structurally challenging given the business model.
Working capital intensity
Working capital intensity is high: Cencora's large inventories and manufacturer receivables/payables tie up cash—inventory and receivables exceed $30 billion combined, pressuring liquidity as FY2024 revenue neared $238 billion. Rising drug prices increase funding needs and credit risk, while payment-term volatility (DSO swings of several weeks) strains cash flow, making efficient cash conversion critical but hard to optimize across cycles.
Customer and manufacturer concentration
Cencora generates over $200 billion in annual revenue (2024), so losing or repricing a large account would materially dent top-line results. Heavy reliance on a few manufacturers raises risk of unfavorable contract renegotiations. Provider and payer consolidation (CVS, UnitedHealth, Walgreens scale) magnifies buyer power. Concentration also heightens exposure to therapeutic areas like oncology and specialty drugs, which now drive over half of US drug spend.
Regulatory and compliance complexity
Distribution of controlled and specialty substances requires rigorous chain-of-custody, security and DEA controls, increasing operational overhead and risk exposure. Evolving rules across U.S. states and international markets raise compliance costs and slow cross-border service rollouts. Audit findings or lapses can trigger fines and reputational damage that impede growth.
- High control requirements
- Rising multijurisdictional compliance costs
- Audit/fine reputational risk
- Slower service rollout
Exposure to litigation and reputational risk
- Known industry settlement scale: multi-billion dollars
- Legal reserves: volatile quarter-to-quarter
- Reputation risk: affects payers, providers, investors
- Compliance missteps: increase fines and financial volatility
Low-margin distribution; >$30B working capital vs $238B revenue; litigation risk
Core distribution is low-margin (operating margins in low single digits) and scale-dependent, exposing earnings to payor/manufacturer pricing pressure. Working capital is intensive—inventory plus receivables >$30B vs FY2024 revenue ~$238B—pressuring liquidity. Concentration on large accounts and specialty oncology drugs raises contract and pricing risk. Ongoing litigation/compliance exposure has produced multi-billion-dollar settlements and volatile legal reserves.
| Metric | Value |
|---|---|
| FY2024 Revenue | $238B |
| Inventory + Receivables | >$30B |
| Operating Margin | Low single digits |
| Legal Settlement Scale | Multi-billion $ |
What You See Is What You Get
Cencora SWOT Analysis
This is the actual Cencora SWOT analysis document you’ll receive upon purchase—no surprises, just professional quality. The preview below is taken directly from the full SWOT report you'll get, with the same structured findings: strengths, weaknesses, opportunities and threats. Purchase unlocks the complete, editable file for immediate download.











