CenterPoint Energy Porter's Five Forces Analysis

Elevate Your Analysis with the Complete Porter's Five Forces Analysis
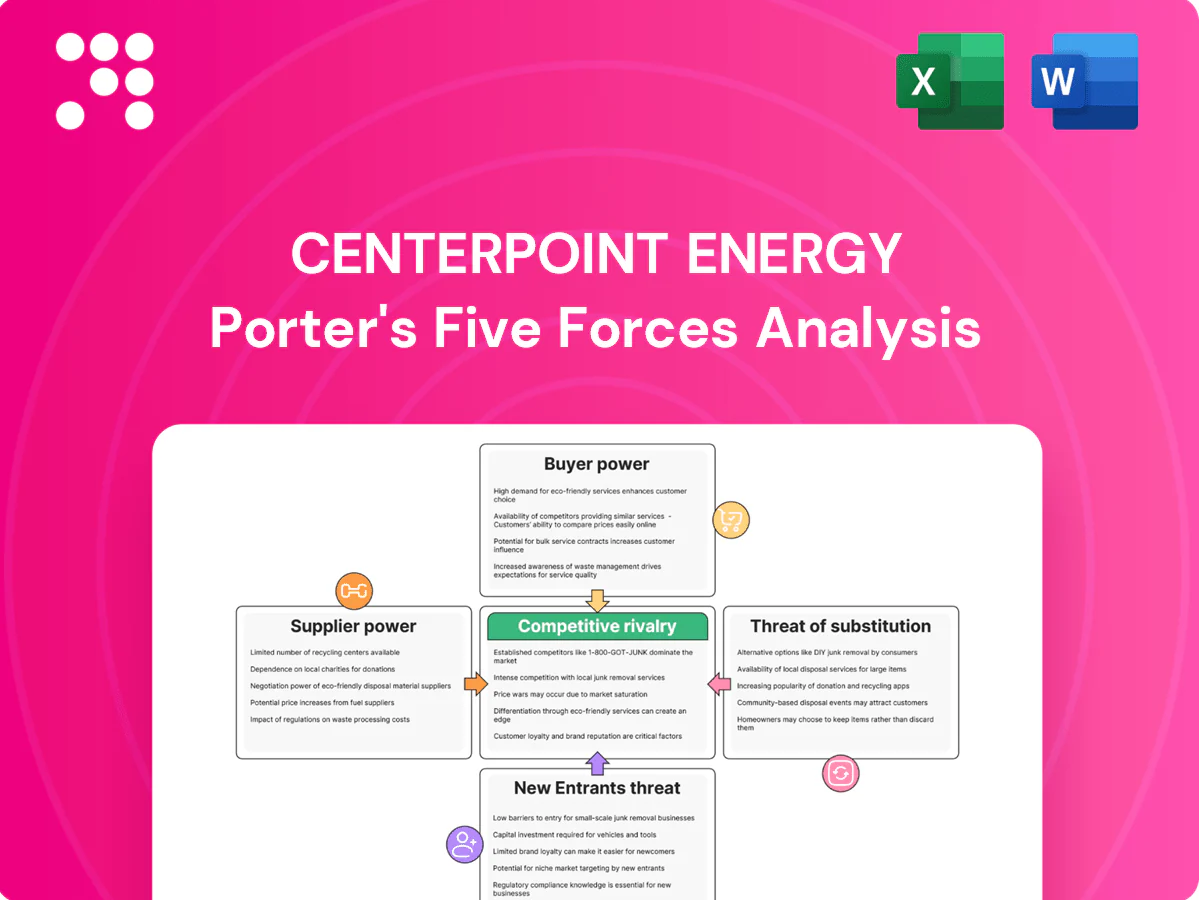
CenterPoint Energy’s Porter's Five Forces analysis assesses regulatory pressure, supplier bargaining, customer leverage, threat of new entrants, and substitute energy options to reveal industry competitiveness and margin risks. It highlights how regulation and infrastructure scale bolster defense but intensify capital needs. The report links each force to strategic implications and investment signals. This brief snapshot only scratches the surface—unlock the full Porter's Five Forces Analysis to explore CenterPoint Energy’s competitive dynamics, market pressures, and strategic advantages in detail.
Suppliers Bargaining Power

Concentrated equipment vendors
High-voltage transformers, smart meters and grid-automation gear are supplied by a limited set of OEMs, raising switching costs and creating dependency that keeps bargaining power with vendors. In 2024 industry lead times for transformers and specialized grid equipment ran roughly 12–24 months, lengthening project schedules and exposing CenterPoint to price inflation and delivery risk. CenterPoint mitigates this via multi-year sourcing and equipment standardization, but vendor concentration still confers material leverage to suppliers.
Fuel and commodity exposure
Natural gas for CenterPoint Energy's distribution is bought from producers and marketers with pricing tied to hubs and pipeline capacity; CenterPoint served about 5.6 million metered customers in 2024, so hub/basis moves can materially affect regional costs. Regulatory passthroughs largely shift commodity expense to customers, but 2024 hub volatility (Henry Hub near $3/MMBtu on average) and local basis spikes can stress operations and affordability. Diverse contracts and storage mitigate risk, yet upstream suppliers retain leverage during winter peaks.

Transmission and pipeline interconnections
Access to regional transmission and gas pipeline capacity for CenterPoint depends on third-party operators; U.S. pipeline transport capacity was about 100 billion cubic feet per day in 2024 (EIA), concentrating leverage with interconnector owners.
Congestion, tariff structures and maintenance outages can raise delivered fuel and wheeling costs and constrain reliability, driving volatile short-term margin impacts.
Firm transport rights and FERC/PUC oversight moderate supplier power, but interconnector owners still influence terms, scheduling and incident recovery timelines.

Skilled labor and contractors
Skilled lineworkers, corrosion technicians and specialized contractors remained in constrained supply in 2024, with industry reports noting post-storm demand spikes that force substantial overtime and contractor premium rates, lifting CenterPoint Energy’s O&M and storm restoration costs.
- Short supply of specialized crews post-storm
- Wage pressure and overtime increase O&M and restoration costs
- Long-term labor agreements and training pipelines mitigate but do not remove supplier power
Technology platforms and data systems
Technology platforms for AMI, outage management and cybersecurity are highly sticky and carry high integration and replacement costs; CenterPoint Energy serves about 2.2 million electric customers in 2024, amplifying the operational impact of vendor lock-in. Vendors retain pricing power over licenses, upgrades and support, and CenterPoint uses competitive RFPs and modular architectures to mitigate this, but lock-in sustains negotiation asymmetry.
- High stickiness: AMI/outage/cyber platforms
- Scale: ~2.2M electric customers (2024)
- Vendor leverage: licensing, upgrades, support
- Mitigation: competitive RFPs, modular architecture
- Residual risk: supplier lock-in → negotiation asymmetry
Supply risk: 12–24 months lead times; 5.6M gas, 2.2M electric
Supplier power is elevated due to concentrated OEMs for transformers/AMI and 12–24 month lead times, creating switching costs. Commodity and pipeline leverage (5.6M gas customers, 2.2M electric customers; U.S. pipeline ~100 Bcf/d) plus 2024 hub volatility (Henry Hub ~3 $/MMBtu) shift risk despite regulatory passthroughs. Skilled crew scarcity and sticky software contracts sustain supplier pricing power.
| Metric | 2024 |
|---|---|
| Metered customers | 5.6M gas; 2.2M electric |
| Transformer lead time | 12–24 months |
| Henry Hub avg | ~3 $/MMBtu |
| US pipeline cap | ~100 Bcf/d |
What is included in the product
 Detailed Word Document
Concise Porter’s Five Forces analysis tailored to CenterPoint Energy, assessing competitive rivalry, supplier and buyer power, threat of new entrants and substitutes, and regulatory barriers to highlight risks, pricing pressure, and strategic defenses that shape its utility market position.

 Customizable Excel Spreadsheet
One-sheet Porter's Five Forces for CenterPoint Energy—clear, customizable pressure levels and radar visualization that remove analysis bottlenecks; ready to copy into pitch decks, integrate into Excel dashboards, and use without macros so non-finance teams can act fast.
Customers Bargaining Power

Captive regulated customers
Most electric and gas customers are effectively captive to CenterPoint’s wires and pipes, with CenterPoint serving approximately 7 million customers as of 2024, limiting switching options. Regulatory frameworks set rates, service-quality standards, and cost recoveries, which dampen direct buyer bargaining power. Public utility commissions function as surrogate negotiators, reviewing rate cases and ROE outcomes on consumers’ behalf.
Large industrial and commercial load
Houston-area industrials and large C&I customers exert strong negotiating influence over CenterPoint Energy service terms and reliability expectations; CenterPoint's Houston distribution system serves roughly 2.2 million metered customers, concentrating demand among high‑usage accounts. These customers can time‑shift load or self‑generate at the margin (individual sites often >10 MW), shaping rate design debates and wielding outsized influence in regulatory proceedings.

Affordability and political scrutiny
Even with limited switching, customer sensitivity to bills forces regulatory commissions to tighten returns and riders for CenterPoint Energy, which serves about 7 million customers (2024). High-profile storms or outages amplify consumer advocates' leverage, driving contested hearings and delay. This indirect power compresses allowed revenue and can extend cost recovery timelines, with typical utility ROE outcomes in recent 2024 cases clustering around 9–11%.

Competitive home services customers
Competitive home services customers can easily switch to local contractors for unregulated repair and maintenance, increasing churn risk for CenterPoint, which serves about 7 million metered customers (2024). Price transparency and pervasive online reviews amplify buyer power and shorten decision cycles. CenterPoint must differentiate via brand trust, strong warranties and bundled service offerings to retain customers.
- High switching: local contractors readily available
- Review-driven: online ratings accelerate defections
- Differentiation: warranties, brand trust, bundles
Energy choice in certain markets
CenterPoint is primarily a delivery utility serving roughly 7.2 million customers (2023); in deregulated jurisdictions customers can pick retail gas or electric suppliers, notably in markets such as Texas, Ohio and Pennsylvania. When customers choose commodity providers, they shift pricing influence to competitive retailers, diluting CenterPoint’s leverage over the energy component of bills. Regulated delivery fees remain the company’s main rate-setting mechanism.
- CenterPoint customers ~7.2M (2023)
- Retail choice prevalent in large markets (e.g., ERCOT ~85% participation)
Utility network: ~7.0M customers; Houston ~2.2M; ERCOT retail choice ~85%; ROE 9–11%
Most customers are captive to CenterPoint’s wires, with about 7.0M customers (2024). Houston concentration (~2.2M metered customers) gives large industrials outsized leverage; typical ROE outcomes in 2024 clustered 9–11%. Retail choice (ERCOT ~85% participation) shifts commodity power to retailers while delivery fees remain regulated.
| Metric | Value |
|---|---|
| Total customers (2024) | ~7.0M |
| Houston metered | ~2.2M |
| ERCOT retail choice | ~85% |
| ROE range (2024) | 9–11% |
Same Document Delivered
CenterPoint Energy Porter's Five Forces Analysis
This preview shows the exact CenterPoint Energy Porter’s Five Forces analysis you’ll receive immediately after purchase—no placeholders or samples. The document is fully formatted, professionally written and ready for download and use the moment you buy. You’re viewing the final deliverable; completion of purchase grants instant access to this same file.

Elevate Your Analysis with the Complete Porter's Five Forces Analysis
CenterPoint Energy’s Porter's Five Forces analysis assesses regulatory pressure, supplier bargaining, customer leverage, threat of new entrants, and substitute energy options to reveal industry competitiveness and margin risks. It highlights how regulation and infrastructure scale bolster defense but intensify capital needs. The report links each force to strategic implications and investment signals. This brief snapshot only scratches the surface—unlock the full Porter's Five Forces Analysis to explore CenterPoint Energy’s competitive dynamics, market pressures, and strategic advantages in detail.
Suppliers Bargaining Power
Concentrated equipment vendors
High-voltage transformers, smart meters and grid-automation gear are supplied by a limited set of OEMs, raising switching costs and creating dependency that keeps bargaining power with vendors. In 2024 industry lead times for transformers and specialized grid equipment ran roughly 12–24 months, lengthening project schedules and exposing CenterPoint to price inflation and delivery risk. CenterPoint mitigates this via multi-year sourcing and equipment standardization, but vendor concentration still confers material leverage to suppliers.
Fuel and commodity exposure
Natural gas for CenterPoint Energy's distribution is bought from producers and marketers with pricing tied to hubs and pipeline capacity; CenterPoint served about 5.6 million metered customers in 2024, so hub/basis moves can materially affect regional costs. Regulatory passthroughs largely shift commodity expense to customers, but 2024 hub volatility (Henry Hub near $3/MMBtu on average) and local basis spikes can stress operations and affordability. Diverse contracts and storage mitigate risk, yet upstream suppliers retain leverage during winter peaks.
Transmission and pipeline interconnections
Access to regional transmission and gas pipeline capacity for CenterPoint depends on third-party operators; U.S. pipeline transport capacity was about 100 billion cubic feet per day in 2024 (EIA), concentrating leverage with interconnector owners.
Congestion, tariff structures and maintenance outages can raise delivered fuel and wheeling costs and constrain reliability, driving volatile short-term margin impacts.
Firm transport rights and FERC/PUC oversight moderate supplier power, but interconnector owners still influence terms, scheduling and incident recovery timelines.
Skilled labor and contractors
Skilled lineworkers, corrosion technicians and specialized contractors remained in constrained supply in 2024, with industry reports noting post-storm demand spikes that force substantial overtime and contractor premium rates, lifting CenterPoint Energy’s O&M and storm restoration costs.
- Short supply of specialized crews post-storm
- Wage pressure and overtime increase O&M and restoration costs
- Long-term labor agreements and training pipelines mitigate but do not remove supplier power
Technology platforms and data systems
Technology platforms for AMI, outage management and cybersecurity are highly sticky and carry high integration and replacement costs; CenterPoint Energy serves about 2.2 million electric customers in 2024, amplifying the operational impact of vendor lock-in. Vendors retain pricing power over licenses, upgrades and support, and CenterPoint uses competitive RFPs and modular architectures to mitigate this, but lock-in sustains negotiation asymmetry.
- High stickiness: AMI/outage/cyber platforms
- Scale: ~2.2M electric customers (2024)
- Vendor leverage: licensing, upgrades, support
- Mitigation: competitive RFPs, modular architecture
- Residual risk: supplier lock-in → negotiation asymmetry
Supply risk: 12–24 months lead times; 5.6M gas, 2.2M electric
Supplier power is elevated due to concentrated OEMs for transformers/AMI and 12–24 month lead times, creating switching costs. Commodity and pipeline leverage (5.6M gas customers, 2.2M electric customers; U.S. pipeline ~100 Bcf/d) plus 2024 hub volatility (Henry Hub ~3 $/MMBtu) shift risk despite regulatory passthroughs. Skilled crew scarcity and sticky software contracts sustain supplier pricing power.
| Metric | 2024 |
|---|---|
| Metered customers | 5.6M gas; 2.2M electric |
| Transformer lead time | 12–24 months |
| Henry Hub avg | ~3 $/MMBtu |
| US pipeline cap | ~100 Bcf/d |
What is included in the product
Detailed Word Document
Concise Porter’s Five Forces analysis tailored to CenterPoint Energy, assessing competitive rivalry, supplier and buyer power, threat of new entrants and substitutes, and regulatory barriers to highlight risks, pricing pressure, and strategic defenses that shape its utility market position.
Customizable Excel Spreadsheet
One-sheet Porter's Five Forces for CenterPoint Energy—clear, customizable pressure levels and radar visualization that remove analysis bottlenecks; ready to copy into pitch decks, integrate into Excel dashboards, and use without macros so non-finance teams can act fast.
Customers Bargaining Power
Captive regulated customers
Most electric and gas customers are effectively captive to CenterPoint’s wires and pipes, with CenterPoint serving approximately 7 million customers as of 2024, limiting switching options. Regulatory frameworks set rates, service-quality standards, and cost recoveries, which dampen direct buyer bargaining power. Public utility commissions function as surrogate negotiators, reviewing rate cases and ROE outcomes on consumers’ behalf.
Large industrial and commercial load
Houston-area industrials and large C&I customers exert strong negotiating influence over CenterPoint Energy service terms and reliability expectations; CenterPoint's Houston distribution system serves roughly 2.2 million metered customers, concentrating demand among high‑usage accounts. These customers can time‑shift load or self‑generate at the margin (individual sites often >10 MW), shaping rate design debates and wielding outsized influence in regulatory proceedings.
Affordability and political scrutiny
Even with limited switching, customer sensitivity to bills forces regulatory commissions to tighten returns and riders for CenterPoint Energy, which serves about 7 million customers (2024). High-profile storms or outages amplify consumer advocates' leverage, driving contested hearings and delay. This indirect power compresses allowed revenue and can extend cost recovery timelines, with typical utility ROE outcomes in recent 2024 cases clustering around 9–11%.
Competitive home services customers
Competitive home services customers can easily switch to local contractors for unregulated repair and maintenance, increasing churn risk for CenterPoint, which serves about 7 million metered customers (2024). Price transparency and pervasive online reviews amplify buyer power and shorten decision cycles. CenterPoint must differentiate via brand trust, strong warranties and bundled service offerings to retain customers.
- High switching: local contractors readily available
- Review-driven: online ratings accelerate defections
- Differentiation: warranties, brand trust, bundles
Energy choice in certain markets
CenterPoint is primarily a delivery utility serving roughly 7.2 million customers (2023); in deregulated jurisdictions customers can pick retail gas or electric suppliers, notably in markets such as Texas, Ohio and Pennsylvania. When customers choose commodity providers, they shift pricing influence to competitive retailers, diluting CenterPoint’s leverage over the energy component of bills. Regulated delivery fees remain the company’s main rate-setting mechanism.
- CenterPoint customers ~7.2M (2023)
- Retail choice prevalent in large markets (e.g., ERCOT ~85% participation)
Utility network: ~7.0M customers; Houston ~2.2M; ERCOT retail choice ~85%; ROE 9–11%
Most customers are captive to CenterPoint’s wires, with about 7.0M customers (2024). Houston concentration (~2.2M metered customers) gives large industrials outsized leverage; typical ROE outcomes in 2024 clustered 9–11%. Retail choice (ERCOT ~85% participation) shifts commodity power to retailers while delivery fees remain regulated.
| Metric | Value |
|---|---|
| Total customers (2024) | ~7.0M |
| Houston metered | ~2.2M |
| ERCOT retail choice | ~85% |
| ROE range (2024) | 9–11% |
Same Document Delivered
CenterPoint Energy Porter's Five Forces Analysis
This preview shows the exact CenterPoint Energy Porter’s Five Forces analysis you’ll receive immediately after purchase—no placeholders or samples. The document is fully formatted, professionally written and ready for download and use the moment you buy. You’re viewing the final deliverable; completion of purchase grants instant access to this same file.
Original: $10.00
-65%$10.00
$3.50Description
Elevate Your Analysis with the Complete Porter's Five Forces Analysis
CenterPoint Energy’s Porter's Five Forces analysis assesses regulatory pressure, supplier bargaining, customer leverage, threat of new entrants, and substitute energy options to reveal industry competitiveness and margin risks. It highlights how regulation and infrastructure scale bolster defense but intensify capital needs. The report links each force to strategic implications and investment signals. This brief snapshot only scratches the surface—unlock the full Porter's Five Forces Analysis to explore CenterPoint Energy’s competitive dynamics, market pressures, and strategic advantages in detail.
Suppliers Bargaining Power
Concentrated equipment vendors
High-voltage transformers, smart meters and grid-automation gear are supplied by a limited set of OEMs, raising switching costs and creating dependency that keeps bargaining power with vendors. In 2024 industry lead times for transformers and specialized grid equipment ran roughly 12–24 months, lengthening project schedules and exposing CenterPoint to price inflation and delivery risk. CenterPoint mitigates this via multi-year sourcing and equipment standardization, but vendor concentration still confers material leverage to suppliers.
Fuel and commodity exposure
Natural gas for CenterPoint Energy's distribution is bought from producers and marketers with pricing tied to hubs and pipeline capacity; CenterPoint served about 5.6 million metered customers in 2024, so hub/basis moves can materially affect regional costs. Regulatory passthroughs largely shift commodity expense to customers, but 2024 hub volatility (Henry Hub near $3/MMBtu on average) and local basis spikes can stress operations and affordability. Diverse contracts and storage mitigate risk, yet upstream suppliers retain leverage during winter peaks.
Transmission and pipeline interconnections
Access to regional transmission and gas pipeline capacity for CenterPoint depends on third-party operators; U.S. pipeline transport capacity was about 100 billion cubic feet per day in 2024 (EIA), concentrating leverage with interconnector owners.
Congestion, tariff structures and maintenance outages can raise delivered fuel and wheeling costs and constrain reliability, driving volatile short-term margin impacts.
Firm transport rights and FERC/PUC oversight moderate supplier power, but interconnector owners still influence terms, scheduling and incident recovery timelines.
Skilled labor and contractors
Skilled lineworkers, corrosion technicians and specialized contractors remained in constrained supply in 2024, with industry reports noting post-storm demand spikes that force substantial overtime and contractor premium rates, lifting CenterPoint Energy’s O&M and storm restoration costs.
- Short supply of specialized crews post-storm
- Wage pressure and overtime increase O&M and restoration costs
- Long-term labor agreements and training pipelines mitigate but do not remove supplier power
Technology platforms and data systems
Technology platforms for AMI, outage management and cybersecurity are highly sticky and carry high integration and replacement costs; CenterPoint Energy serves about 2.2 million electric customers in 2024, amplifying the operational impact of vendor lock-in. Vendors retain pricing power over licenses, upgrades and support, and CenterPoint uses competitive RFPs and modular architectures to mitigate this, but lock-in sustains negotiation asymmetry.
- High stickiness: AMI/outage/cyber platforms
- Scale: ~2.2M electric customers (2024)
- Vendor leverage: licensing, upgrades, support
- Mitigation: competitive RFPs, modular architecture
- Residual risk: supplier lock-in → negotiation asymmetry
Supply risk: 12–24 months lead times; 5.6M gas, 2.2M electric
Supplier power is elevated due to concentrated OEMs for transformers/AMI and 12–24 month lead times, creating switching costs. Commodity and pipeline leverage (5.6M gas customers, 2.2M electric customers; U.S. pipeline ~100 Bcf/d) plus 2024 hub volatility (Henry Hub ~3 $/MMBtu) shift risk despite regulatory passthroughs. Skilled crew scarcity and sticky software contracts sustain supplier pricing power.
| Metric | 2024 |
|---|---|
| Metered customers | 5.6M gas; 2.2M electric |
| Transformer lead time | 12–24 months |
| Henry Hub avg | ~3 $/MMBtu |
| US pipeline cap | ~100 Bcf/d |
What is included in the product
Detailed Word Document
Concise Porter’s Five Forces analysis tailored to CenterPoint Energy, assessing competitive rivalry, supplier and buyer power, threat of new entrants and substitutes, and regulatory barriers to highlight risks, pricing pressure, and strategic defenses that shape its utility market position.
Customizable Excel Spreadsheet
One-sheet Porter's Five Forces for CenterPoint Energy—clear, customizable pressure levels and radar visualization that remove analysis bottlenecks; ready to copy into pitch decks, integrate into Excel dashboards, and use without macros so non-finance teams can act fast.
Customers Bargaining Power
Captive regulated customers
Most electric and gas customers are effectively captive to CenterPoint’s wires and pipes, with CenterPoint serving approximately 7 million customers as of 2024, limiting switching options. Regulatory frameworks set rates, service-quality standards, and cost recoveries, which dampen direct buyer bargaining power. Public utility commissions function as surrogate negotiators, reviewing rate cases and ROE outcomes on consumers’ behalf.
Large industrial and commercial load
Houston-area industrials and large C&I customers exert strong negotiating influence over CenterPoint Energy service terms and reliability expectations; CenterPoint's Houston distribution system serves roughly 2.2 million metered customers, concentrating demand among high‑usage accounts. These customers can time‑shift load or self‑generate at the margin (individual sites often >10 MW), shaping rate design debates and wielding outsized influence in regulatory proceedings.
Affordability and political scrutiny
Even with limited switching, customer sensitivity to bills forces regulatory commissions to tighten returns and riders for CenterPoint Energy, which serves about 7 million customers (2024). High-profile storms or outages amplify consumer advocates' leverage, driving contested hearings and delay. This indirect power compresses allowed revenue and can extend cost recovery timelines, with typical utility ROE outcomes in recent 2024 cases clustering around 9–11%.
Competitive home services customers
Competitive home services customers can easily switch to local contractors for unregulated repair and maintenance, increasing churn risk for CenterPoint, which serves about 7 million metered customers (2024). Price transparency and pervasive online reviews amplify buyer power and shorten decision cycles. CenterPoint must differentiate via brand trust, strong warranties and bundled service offerings to retain customers.
- High switching: local contractors readily available
- Review-driven: online ratings accelerate defections
- Differentiation: warranties, brand trust, bundles
Energy choice in certain markets
CenterPoint is primarily a delivery utility serving roughly 7.2 million customers (2023); in deregulated jurisdictions customers can pick retail gas or electric suppliers, notably in markets such as Texas, Ohio and Pennsylvania. When customers choose commodity providers, they shift pricing influence to competitive retailers, diluting CenterPoint’s leverage over the energy component of bills. Regulated delivery fees remain the company’s main rate-setting mechanism.
- CenterPoint customers ~7.2M (2023)
- Retail choice prevalent in large markets (e.g., ERCOT ~85% participation)
Utility network: ~7.0M customers; Houston ~2.2M; ERCOT retail choice ~85%; ROE 9–11%
Most customers are captive to CenterPoint’s wires, with about 7.0M customers (2024). Houston concentration (~2.2M metered customers) gives large industrials outsized leverage; typical ROE outcomes in 2024 clustered 9–11%. Retail choice (ERCOT ~85% participation) shifts commodity power to retailers while delivery fees remain regulated.
| Metric | Value |
|---|---|
| Total customers (2024) | ~7.0M |
| Houston metered | ~2.2M |
| ERCOT retail choice | ~85% |
| ROE range (2024) | 9–11% |
Same Document Delivered
CenterPoint Energy Porter's Five Forces Analysis
This preview shows the exact CenterPoint Energy Porter’s Five Forces analysis you’ll receive immediately after purchase—no placeholders or samples. The document is fully formatted, professionally written and ready for download and use the moment you buy. You’re viewing the final deliverable; completion of purchase grants instant access to this same file.











