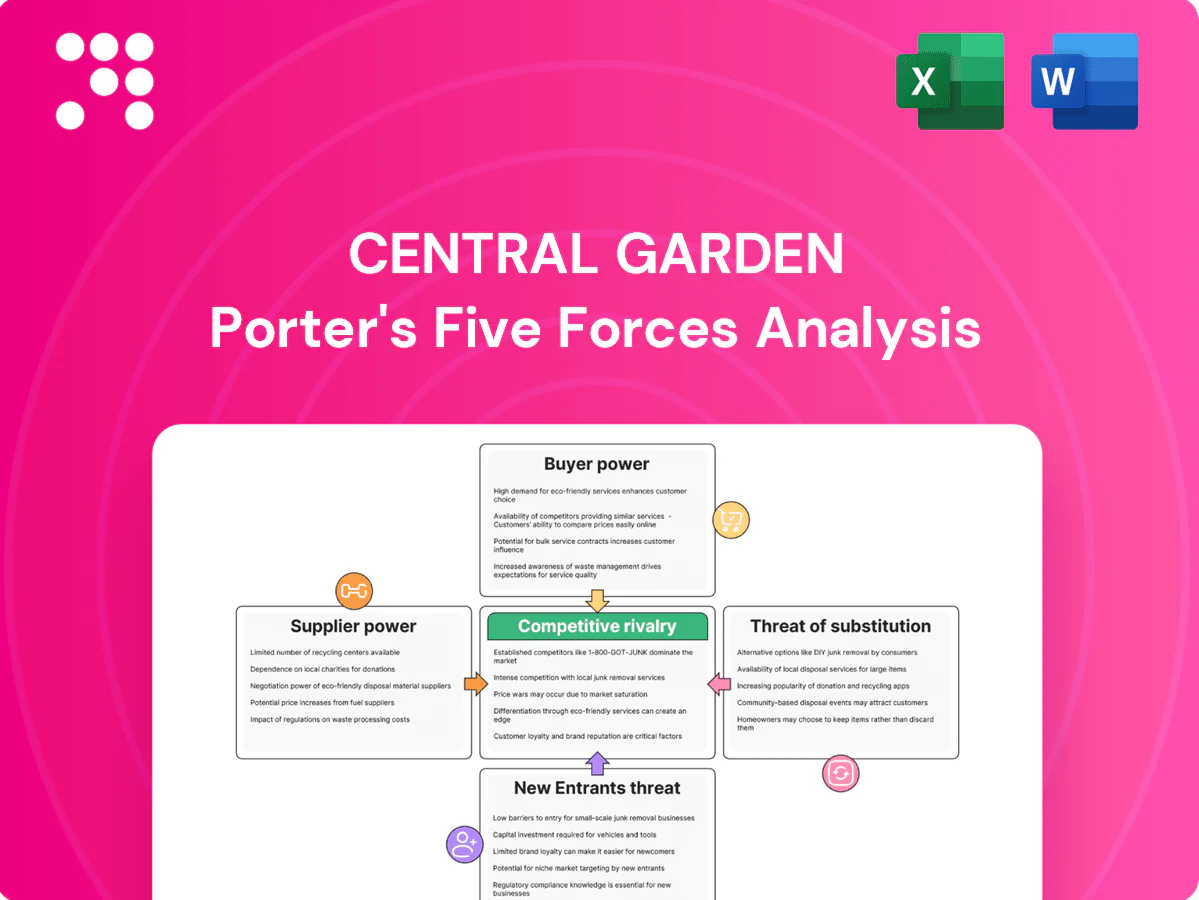
Central Garden Porter's Five Forces Analysis

Go Beyond the Preview—Access the Full Strategic Report
Central Garden’s Porter's Five Forces snapshot highlights supplier negotiating leverage, buyer sensitivity across retail and pro channels, moderate threat from substitutes, and rivalry driven by scale and product differentiation. It surfaces key strategic pressures affecting margins and growth potential. This brief only scratches the surface—unlock the full Porter's Five Forces Analysis to access force-by-force ratings, visuals, and actionable recommendations tailored to Central Garden.
Suppliers Bargaining Power

Diverse commodity inputs
Central relies on agricultural commodities (grains, proteins), chemicals and packaging from many suppliers, and fragmentation in inputs keeps switching options open; fiscal 2024 net sales were about $3.34 billion, underscoring scale-driven sourcing. Price volatility in grains and resins—heightened since 2022—can tighten supplier leverage during shocks, though hedging and multi-sourcing partially mitigate cost spikes.
Specialty chemicals concentration
Key herbicides, pesticides and active ingredients are often produced by a handful of major firms—Bayer, BASF, Corteva and FMC—constraining supplier breadth. Regulatory approvals (EPA, EU) limit substitutability and raise supplier power for approved chemistries. Long-term contracts and volume commitments secure supply but reduce short-term flexibility and negotiating leverage. Further upstream consolidation among these players could compress margins.

Logistics and freight dependence
Seasonal surges in spring/summer can boost Central Garden volumes by as much as 30%, increasing reliance on carriers and 3PLs for on-time delivery. Tight US trucking capacity in 2024 lifted spot rates and strengthened logistics providers' bargaining power. Diversified carrier networks and regional DCs cut exposure but do not eliminate delays. Fuel surcharges and occasional disruptions can add roughly 5–12% to transportation costs.

Private-label and contract mfg partners
For certain SKUs co-packers and contract manufacturers are integral; capacity constraints and reported high utilization can shift bargaining power—CENTa FY2024 net sales were about $3.1B, increasing reliance on partners for peak-season volumes. Dual-sourcing and selective in-house capacity reduce supplier leverage, while stringent quality and compliance needs narrow the qualified supplier base to a few certified co-packers.
- Dependence: high for seasonal SKUs
- Utilization: tight during peak season
- Mitigation: dual-sourcing + in-house
- Constraint: quality/compliance limits suppliers
Supplier switching and quality risks
Switching suppliers for pet food inputs or regulated chemicals requires audits, validations and traceability checks, increasing supplier stickiness and leverage while constraining rapid changes. Central’s scale and standardized specifications improve comparability and bidding, lowering some supplier power. Brand-quality safeguards and regulatory compliance limit aggressive supplier turnover, preserving continuity.
- Supplier audits raise switching cost
- Standard specs boost competitive bidding
- Quality controls restrict rapid turnover
Supplier concentration ups switching costs; $3.34B, ~30%
Central faces moderate-to-high supplier power: concentrated crop-chemical suppliers (Bayer, BASF, Corteva, FMC) and regulated inputs increase stickiness, while fragmented commodities and scale (FY2024 net sales $3.34B) enable multi-sourcing and hedging. Peak-season volumes can rise ~30%, and 2024 trucking pressures added ~5–12% to transport costs. Long-term contracts and audits limit rapid switching.
| Metric | Value |
|---|---|
| FY2024 net sales | $3.34B |
| Key chem supplier concentration | Top 4 firms |
| Peak volume uplift | ~30% |
| Transport cost impact (2024) | +5–12% |
What is included in the product
 Detailed Word Document
Uncovers how competitive rivalry, buyer and supplier power, threats of new entrants and substitutes, and industry dynamics shape Central Garden’s pricing, margins, and strategic risks, highlighting disruptive forces and barriers that protect or threaten incumbency.

 Customizable Excel Spreadsheet
A concise one-sheet Porter's Five Forces for Central Garden that highlights supplier/customer power, substitutes, new entrants, and rivalry—ideal for quick strategic fixes; customizable pressure levels and radar-chart export let non‑finance teams adapt scenarios and drop into decks or reports.
Customers Bargaining Power

Retail concentration
Mass merchants, home-improvement chains and big-box pet retailers exert strong buying power over Central Garden, negotiating price concessions, slotting fees and stringent vendor terms; Central reported approximately $3.4 billion in net sales in 2023, so concession impacts scale materially. Losing a top account—often representing more than 5% of revenue—would dent volumes and margins. Central mitigates this through a broad product portfolio and category-management support to retain shelf space.
Private label alternatives
Retailers increasingly push private label in fertilizers, bird feed and pet consumables, with private-label penetration in pet consumables reaching about 15% in 2024, raising customer price sensitivity and eroding branded pricing power. Central supplies private-label SKUs, partially offsetting volume loss, but a mix shift toward private label typically compresses gross margins by roughly 200–300 basis points versus branded assortments.

Low switching costs
Low switching costs let end consumers move among comparable pet treats and lawn products quickly, and retailers reallocate shelf space based on SKU performance and trade spend, which for CPG categories often runs 10–20% of revenue. Brand equity and product differentiation provide some buffer for Central Garden but are not absolute moats, so promotions and 6–12 month innovation cycles are critical to retention.

E-commerce channel dynamics
E-commerce channel dynamics raise customer bargaining power for Central Garden & Pet as platforms boost price transparency and promotion frequency; online pet sales reached about 24% of category sales in 2024 and Amazon accounted for ~40% of online pet product transactions, intensifying price pressure. Marketplaces lower entry barriers for niche rivals while subscribe-and-save drives share gains at discounted ASPs; omnichannel execution is required to defend margins.
- price transparency up — 24% e‑commerce share (2024)
- marketplace share ~40% of online pet sales
- subscribe models increase retention but cut ASPs
- omnichannel needed to sustain bargaining position
Seasonality and forecast accuracy
Garden demand is highly weather-sensitive, prompting retailers to demand flexible purchase terms and liberal returns to avoid inventory risk.
Overstocks during soft seasons increase markdown pressure on suppliers and squeeze margins; Central’s planning and vendor-managed inventory programs help smooth replenishment and reduce excess.
Despite these mitigations, large buyers still leverage seasonality to negotiate price concessions and extended payment terms.
- Retailer flexibility: returns and adjustable orders
- Inventory risk: overstocks → markdowns, margin pressure
- Central mitigants: planning + vendor-managed inventory
- Buyer leverage: seasonal timing used in negotiations
Mass merchant leverage, private-label and e-commerce press margins and volumes
Mass merchants and big-box chains wield strong leverage over Central Garden—net sales ~$3.4B (2023) and losing a top account (>5% revenue) would hit volumes and margins. Private label penetration ~15% in pet consumables (2024) tends to compress gross margins ~200–300 bps; Central also supplies private-label SKUs. E-commerce = 24% of category sales (2024), Amazon ~40% of online pet transactions, and subscription models lower ASPs; seasonality drives flexible return/payment demands.
| Metric | Value |
|---|---|
| Net sales (2023) | $3.4B |
| E‑commerce share (2024) | 24% |
| Amazon share (online) | ~40% |
| Private‑label pet consumables (2024) | ~15% |
| GM compression vs branded | ~200–300 bps |
| Top account concentration | >5% revenue |
Same Document Delivered
Central Garden Porter's Five Forces Analysis
This preview presents the complete Central Garden Porter's Five Forces analysis—covering competitive rivalry, threat of new entrants, supplier and buyer power, and substitution risks—in the exact format you'll receive. The document shown is the final, professionally formatted file available for immediate download after purchase. No placeholders or samples; what you see is what you get.

Go Beyond the Preview—Access the Full Strategic Report
Central Garden’s Porter's Five Forces snapshot highlights supplier negotiating leverage, buyer sensitivity across retail and pro channels, moderate threat from substitutes, and rivalry driven by scale and product differentiation. It surfaces key strategic pressures affecting margins and growth potential. This brief only scratches the surface—unlock the full Porter's Five Forces Analysis to access force-by-force ratings, visuals, and actionable recommendations tailored to Central Garden.
Suppliers Bargaining Power
Diverse commodity inputs
Central relies on agricultural commodities (grains, proteins), chemicals and packaging from many suppliers, and fragmentation in inputs keeps switching options open; fiscal 2024 net sales were about $3.34 billion, underscoring scale-driven sourcing. Price volatility in grains and resins—heightened since 2022—can tighten supplier leverage during shocks, though hedging and multi-sourcing partially mitigate cost spikes.
Specialty chemicals concentration
Key herbicides, pesticides and active ingredients are often produced by a handful of major firms—Bayer, BASF, Corteva and FMC—constraining supplier breadth. Regulatory approvals (EPA, EU) limit substitutability and raise supplier power for approved chemistries. Long-term contracts and volume commitments secure supply but reduce short-term flexibility and negotiating leverage. Further upstream consolidation among these players could compress margins.
Logistics and freight dependence
Seasonal surges in spring/summer can boost Central Garden volumes by as much as 30%, increasing reliance on carriers and 3PLs for on-time delivery. Tight US trucking capacity in 2024 lifted spot rates and strengthened logistics providers' bargaining power. Diversified carrier networks and regional DCs cut exposure but do not eliminate delays. Fuel surcharges and occasional disruptions can add roughly 5–12% to transportation costs.
Private-label and contract mfg partners
For certain SKUs co-packers and contract manufacturers are integral; capacity constraints and reported high utilization can shift bargaining power—CENTa FY2024 net sales were about $3.1B, increasing reliance on partners for peak-season volumes. Dual-sourcing and selective in-house capacity reduce supplier leverage, while stringent quality and compliance needs narrow the qualified supplier base to a few certified co-packers.
- Dependence: high for seasonal SKUs
- Utilization: tight during peak season
- Mitigation: dual-sourcing + in-house
- Constraint: quality/compliance limits suppliers
Supplier switching and quality risks
Switching suppliers for pet food inputs or regulated chemicals requires audits, validations and traceability checks, increasing supplier stickiness and leverage while constraining rapid changes. Central’s scale and standardized specifications improve comparability and bidding, lowering some supplier power. Brand-quality safeguards and regulatory compliance limit aggressive supplier turnover, preserving continuity.
- Supplier audits raise switching cost
- Standard specs boost competitive bidding
- Quality controls restrict rapid turnover
Supplier concentration ups switching costs; $3.34B, ~30%
Central faces moderate-to-high supplier power: concentrated crop-chemical suppliers (Bayer, BASF, Corteva, FMC) and regulated inputs increase stickiness, while fragmented commodities and scale (FY2024 net sales $3.34B) enable multi-sourcing and hedging. Peak-season volumes can rise ~30%, and 2024 trucking pressures added ~5–12% to transport costs. Long-term contracts and audits limit rapid switching.
| Metric | Value |
|---|---|
| FY2024 net sales | $3.34B |
| Key chem supplier concentration | Top 4 firms |
| Peak volume uplift | ~30% |
| Transport cost impact (2024) | +5–12% |
What is included in the product
Detailed Word Document
Uncovers how competitive rivalry, buyer and supplier power, threats of new entrants and substitutes, and industry dynamics shape Central Garden’s pricing, margins, and strategic risks, highlighting disruptive forces and barriers that protect or threaten incumbency.
Customizable Excel Spreadsheet
A concise one-sheet Porter's Five Forces for Central Garden that highlights supplier/customer power, substitutes, new entrants, and rivalry—ideal for quick strategic fixes; customizable pressure levels and radar-chart export let non‑finance teams adapt scenarios and drop into decks or reports.
Customers Bargaining Power
Retail concentration
Mass merchants, home-improvement chains and big-box pet retailers exert strong buying power over Central Garden, negotiating price concessions, slotting fees and stringent vendor terms; Central reported approximately $3.4 billion in net sales in 2023, so concession impacts scale materially. Losing a top account—often representing more than 5% of revenue—would dent volumes and margins. Central mitigates this through a broad product portfolio and category-management support to retain shelf space.
Private label alternatives
Retailers increasingly push private label in fertilizers, bird feed and pet consumables, with private-label penetration in pet consumables reaching about 15% in 2024, raising customer price sensitivity and eroding branded pricing power. Central supplies private-label SKUs, partially offsetting volume loss, but a mix shift toward private label typically compresses gross margins by roughly 200–300 basis points versus branded assortments.
Low switching costs
Low switching costs let end consumers move among comparable pet treats and lawn products quickly, and retailers reallocate shelf space based on SKU performance and trade spend, which for CPG categories often runs 10–20% of revenue. Brand equity and product differentiation provide some buffer for Central Garden but are not absolute moats, so promotions and 6–12 month innovation cycles are critical to retention.
E-commerce channel dynamics
E-commerce channel dynamics raise customer bargaining power for Central Garden & Pet as platforms boost price transparency and promotion frequency; online pet sales reached about 24% of category sales in 2024 and Amazon accounted for ~40% of online pet product transactions, intensifying price pressure. Marketplaces lower entry barriers for niche rivals while subscribe-and-save drives share gains at discounted ASPs; omnichannel execution is required to defend margins.
- price transparency up — 24% e‑commerce share (2024)
- marketplace share ~40% of online pet sales
- subscribe models increase retention but cut ASPs
- omnichannel needed to sustain bargaining position
Seasonality and forecast accuracy
Garden demand is highly weather-sensitive, prompting retailers to demand flexible purchase terms and liberal returns to avoid inventory risk.
Overstocks during soft seasons increase markdown pressure on suppliers and squeeze margins; Central’s planning and vendor-managed inventory programs help smooth replenishment and reduce excess.
Despite these mitigations, large buyers still leverage seasonality to negotiate price concessions and extended payment terms.
- Retailer flexibility: returns and adjustable orders
- Inventory risk: overstocks → markdowns, margin pressure
- Central mitigants: planning + vendor-managed inventory
- Buyer leverage: seasonal timing used in negotiations
Mass merchant leverage, private-label and e-commerce press margins and volumes
Mass merchants and big-box chains wield strong leverage over Central Garden—net sales ~$3.4B (2023) and losing a top account (>5% revenue) would hit volumes and margins. Private label penetration ~15% in pet consumables (2024) tends to compress gross margins ~200–300 bps; Central also supplies private-label SKUs. E-commerce = 24% of category sales (2024), Amazon ~40% of online pet transactions, and subscription models lower ASPs; seasonality drives flexible return/payment demands.
| Metric | Value |
|---|---|
| Net sales (2023) | $3.4B |
| E‑commerce share (2024) | 24% |
| Amazon share (online) | ~40% |
| Private‑label pet consumables (2024) | ~15% |
| GM compression vs branded | ~200–300 bps |
| Top account concentration | >5% revenue |
Same Document Delivered
Central Garden Porter's Five Forces Analysis
This preview presents the complete Central Garden Porter's Five Forces analysis—covering competitive rivalry, threat of new entrants, supplier and buyer power, and substitution risks—in the exact format you'll receive. The document shown is the final, professionally formatted file available for immediate download after purchase. No placeholders or samples; what you see is what you get.
Description
Go Beyond the Preview—Access the Full Strategic Report
Central Garden’s Porter's Five Forces snapshot highlights supplier negotiating leverage, buyer sensitivity across retail and pro channels, moderate threat from substitutes, and rivalry driven by scale and product differentiation. It surfaces key strategic pressures affecting margins and growth potential. This brief only scratches the surface—unlock the full Porter's Five Forces Analysis to access force-by-force ratings, visuals, and actionable recommendations tailored to Central Garden.
Suppliers Bargaining Power
Diverse commodity inputs
Central relies on agricultural commodities (grains, proteins), chemicals and packaging from many suppliers, and fragmentation in inputs keeps switching options open; fiscal 2024 net sales were about $3.34 billion, underscoring scale-driven sourcing. Price volatility in grains and resins—heightened since 2022—can tighten supplier leverage during shocks, though hedging and multi-sourcing partially mitigate cost spikes.
Specialty chemicals concentration
Key herbicides, pesticides and active ingredients are often produced by a handful of major firms—Bayer, BASF, Corteva and FMC—constraining supplier breadth. Regulatory approvals (EPA, EU) limit substitutability and raise supplier power for approved chemistries. Long-term contracts and volume commitments secure supply but reduce short-term flexibility and negotiating leverage. Further upstream consolidation among these players could compress margins.
Logistics and freight dependence
Seasonal surges in spring/summer can boost Central Garden volumes by as much as 30%, increasing reliance on carriers and 3PLs for on-time delivery. Tight US trucking capacity in 2024 lifted spot rates and strengthened logistics providers' bargaining power. Diversified carrier networks and regional DCs cut exposure but do not eliminate delays. Fuel surcharges and occasional disruptions can add roughly 5–12% to transportation costs.
Private-label and contract mfg partners
For certain SKUs co-packers and contract manufacturers are integral; capacity constraints and reported high utilization can shift bargaining power—CENTa FY2024 net sales were about $3.1B, increasing reliance on partners for peak-season volumes. Dual-sourcing and selective in-house capacity reduce supplier leverage, while stringent quality and compliance needs narrow the qualified supplier base to a few certified co-packers.
- Dependence: high for seasonal SKUs
- Utilization: tight during peak season
- Mitigation: dual-sourcing + in-house
- Constraint: quality/compliance limits suppliers
Supplier switching and quality risks
Switching suppliers for pet food inputs or regulated chemicals requires audits, validations and traceability checks, increasing supplier stickiness and leverage while constraining rapid changes. Central’s scale and standardized specifications improve comparability and bidding, lowering some supplier power. Brand-quality safeguards and regulatory compliance limit aggressive supplier turnover, preserving continuity.
- Supplier audits raise switching cost
- Standard specs boost competitive bidding
- Quality controls restrict rapid turnover
Supplier concentration ups switching costs; $3.34B, ~30%
Central faces moderate-to-high supplier power: concentrated crop-chemical suppliers (Bayer, BASF, Corteva, FMC) and regulated inputs increase stickiness, while fragmented commodities and scale (FY2024 net sales $3.34B) enable multi-sourcing and hedging. Peak-season volumes can rise ~30%, and 2024 trucking pressures added ~5–12% to transport costs. Long-term contracts and audits limit rapid switching.
| Metric | Value |
|---|---|
| FY2024 net sales | $3.34B |
| Key chem supplier concentration | Top 4 firms |
| Peak volume uplift | ~30% |
| Transport cost impact (2024) | +5–12% |
What is included in the product
Detailed Word Document
Uncovers how competitive rivalry, buyer and supplier power, threats of new entrants and substitutes, and industry dynamics shape Central Garden’s pricing, margins, and strategic risks, highlighting disruptive forces and barriers that protect or threaten incumbency.
Customizable Excel Spreadsheet
A concise one-sheet Porter's Five Forces for Central Garden that highlights supplier/customer power, substitutes, new entrants, and rivalry—ideal for quick strategic fixes; customizable pressure levels and radar-chart export let non‑finance teams adapt scenarios and drop into decks or reports.
Customers Bargaining Power
Retail concentration
Mass merchants, home-improvement chains and big-box pet retailers exert strong buying power over Central Garden, negotiating price concessions, slotting fees and stringent vendor terms; Central reported approximately $3.4 billion in net sales in 2023, so concession impacts scale materially. Losing a top account—often representing more than 5% of revenue—would dent volumes and margins. Central mitigates this through a broad product portfolio and category-management support to retain shelf space.
Private label alternatives
Retailers increasingly push private label in fertilizers, bird feed and pet consumables, with private-label penetration in pet consumables reaching about 15% in 2024, raising customer price sensitivity and eroding branded pricing power. Central supplies private-label SKUs, partially offsetting volume loss, but a mix shift toward private label typically compresses gross margins by roughly 200–300 basis points versus branded assortments.
Low switching costs
Low switching costs let end consumers move among comparable pet treats and lawn products quickly, and retailers reallocate shelf space based on SKU performance and trade spend, which for CPG categories often runs 10–20% of revenue. Brand equity and product differentiation provide some buffer for Central Garden but are not absolute moats, so promotions and 6–12 month innovation cycles are critical to retention.
E-commerce channel dynamics
E-commerce channel dynamics raise customer bargaining power for Central Garden & Pet as platforms boost price transparency and promotion frequency; online pet sales reached about 24% of category sales in 2024 and Amazon accounted for ~40% of online pet product transactions, intensifying price pressure. Marketplaces lower entry barriers for niche rivals while subscribe-and-save drives share gains at discounted ASPs; omnichannel execution is required to defend margins.
- price transparency up — 24% e‑commerce share (2024)
- marketplace share ~40% of online pet sales
- subscribe models increase retention but cut ASPs
- omnichannel needed to sustain bargaining position
Seasonality and forecast accuracy
Garden demand is highly weather-sensitive, prompting retailers to demand flexible purchase terms and liberal returns to avoid inventory risk.
Overstocks during soft seasons increase markdown pressure on suppliers and squeeze margins; Central’s planning and vendor-managed inventory programs help smooth replenishment and reduce excess.
Despite these mitigations, large buyers still leverage seasonality to negotiate price concessions and extended payment terms.
- Retailer flexibility: returns and adjustable orders
- Inventory risk: overstocks → markdowns, margin pressure
- Central mitigants: planning + vendor-managed inventory
- Buyer leverage: seasonal timing used in negotiations
Mass merchant leverage, private-label and e-commerce press margins and volumes
Mass merchants and big-box chains wield strong leverage over Central Garden—net sales ~$3.4B (2023) and losing a top account (>5% revenue) would hit volumes and margins. Private label penetration ~15% in pet consumables (2024) tends to compress gross margins ~200–300 bps; Central also supplies private-label SKUs. E-commerce = 24% of category sales (2024), Amazon ~40% of online pet transactions, and subscription models lower ASPs; seasonality drives flexible return/payment demands.
| Metric | Value |
|---|---|
| Net sales (2023) | $3.4B |
| E‑commerce share (2024) | 24% |
| Amazon share (online) | ~40% |
| Private‑label pet consumables (2024) | ~15% |
| GM compression vs branded | ~200–300 bps |
| Top account concentration | >5% revenue |
Same Document Delivered
Central Garden Porter's Five Forces Analysis
This preview presents the complete Central Garden Porter's Five Forces analysis—covering competitive rivalry, threat of new entrants, supplier and buyer power, and substitution risks—in the exact format you'll receive. The document shown is the final, professionally formatted file available for immediate download after purchase. No placeholders or samples; what you see is what you get.











