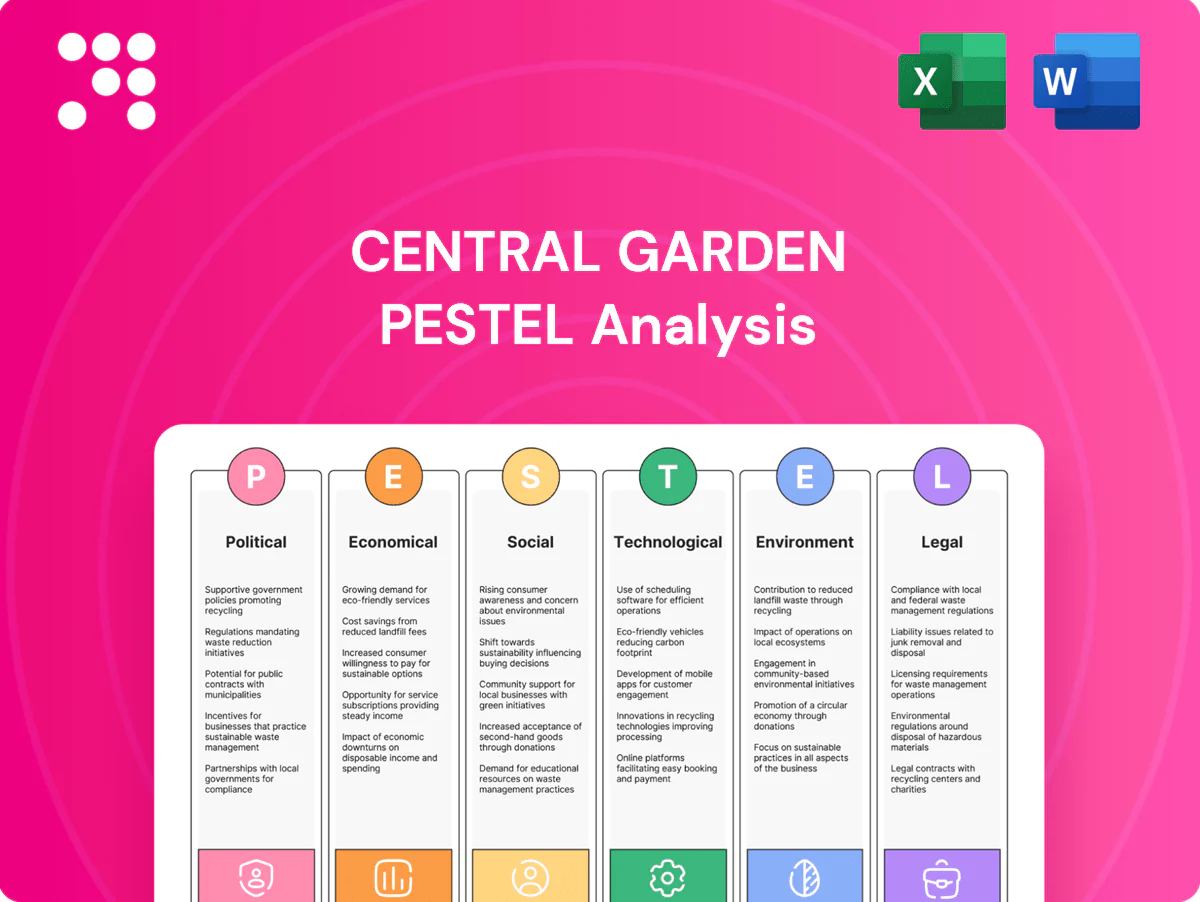
Central Garden PESTLE Analysis

Make Smarter Strategic Decisions with a Complete PESTEL View
Our PESTLE analysis of Central Garden dissects political, economic, social, technological, legal and environmental forces shaping its growth, from regulatory pressures to consumer trends and sustainability risks. Ideal for investors and strategists, it translates external trends into actionable implications and strategic options. Purchase the full report to access detailed insights, data tables and ready-to-use recommendations.
Political factors

Agro-chemical policy shifts
Shifts in agro-chemical policy — exemplified by EPA revocation of chlorpyrifos tolerances in 2021 and an EPA FY2024 budget near $11 billion — can change approvals and labeling, forcing reformulations. Central must monitor EPA and USDA guidance and risk assessments to anticipate product changes. Growing political pressure for pollinator protection has led to tighter reviews of neonicotinoids. Proactive lobbying and stewardship programs can reduce disruption and compliance costs.
Trade tariffs and sourcing
Tariffs on inputs can raise COGS; US Section 301 tariffs on Chinese goods remain up to 25% and Section 232 levies 25% on steel and 10% on aluminum, directly affecting metals- and metal-assemblies costs. Shifts in US-China and US-Mexico trade stances have already re-routed supply chains, prompting Central to pursue multi-country sourcing and commodity hedging. Policy-driven reshoring incentives, notably the CHIPS Act (about $52 billion) and the IRA (roughly $391 billion in clean-energy incentives), can justify domestic capacity investments.

Farm bill and rural programs
US Farm Bill provisions shape ag inputs, conservation and feed markets by directing subsidies, crop insurance and conservation programs that affect acreage and input use. The 2018 Farm Bill set a CRP cap of 27 million acres and CRP enrollment was about 22 million acres in 2023 (USDA), influencing demand for seed and habitat products. Wildlife habitat funding under USDA conservation programs directly affects wild bird feed consumption. Monitoring USDA program updates enables Central to align assortments with subsidy- and conservation-driven demand shifts.

Infrastructure and logistics policy
Investments in ports, rail and trucking regulations materially affect Central Garden freight costs and reliability; US logistics costs were about 8.0% of GDP in 2022 per CSCMP, underscoring sensitivity to modal efficiency. Hours-of-service limits from FMCSA and tightening EPA emissions rules constrain carrier capacity and can raise rates. Central benefits from policy-driven port and rail upgrades but must plan for transitional disruption and higher short-term freight spend. Strategic placement of distribution centers reduces exposure to regional bottlenecks and regulatory shifts.
- Freight-cost sensitivity: logistics ≈ 8.0% of US GDP (CSCMP 2022)
- Regulatory constraints: FMCSA hours-of-service, EPA emissions rules
- Opportunity: federal/state port & rail upgrades improve long-term reliability
- Mitigation: strategic DC placement lowers bottleneck risk
Local ordinances on landscaping
Local ordinances increasingly limit fertilizer, pesticide and lawn watering; landscapes account for 30–60% of household outdoor water use, driving rules that vary by city and season. This patchwork forces Central to offer tailored SKUs and retailer education, while municipal momentum for drought‑tolerant landscapes can shift product mix and demand.
- Regulation impact: SKU customization
- Retailer training: compliance sales
- Market shift: drought‑tolerant products
Regulation, tariffs and logistics squeeze margins; CHIPS/IRA spur reshoring
Regulatory shifts (EPA FY2024 ~$11B; chlorpyrifos tolerances revoked 2021) force reformulations and stewardship costs; pollinator/neonic reviews raise compliance. Tariffs (Section 301/232 up to 25%) and logistics (≈8.0% of US GDP) increase COGS and supply‑chain risk; CHIPS $52B and IRA $391B create reshoring incentives. Farm Bill CRP ~22M acres (2023) and local water/pesticide bans shift SKU mix and retailer programs.
| Factor | Data | Impact |
|---|---|---|
| Regulation | EPA ~$11B FY24 | Reformulation/compliance costs |
| Trade | Tariffs up to 25% | Higher input COGS |
| Logistics | 8.0% of GDP | Freight sensitivity |
| Policy | CRP ~22M acres | Demand shifts for habitat/feed |
What is included in the product
 Detailed Word Document
Explores how external macro-environmental factors uniquely affect Central Garden across Political, Economic, Social, Technological, Environmental and Legal dimensions, with data-backed trends and forward-looking insights to identify risks and opportunities for executives, investors and strategists.

 Customizable Excel Spreadsheet
A compact, visually segmented PESTLE summary for Central Garden that supports quick alignment in meetings and can be dropped into presentations or shared across teams.
Economic factors

Consumer spending cycles
Pet spend reached about 143.6 billion USD in 2024 and US lawn/garden retail sales were roughly 60 billion USD, underscoring discretionary exposure to real disposable income. Elevated inflation (CPI ~3–4% in 2024) and Fed funds ~5.25–5.50% in 2025 compress margins, driving retailers to tighten inventory and boost promos. Central should flex pack sizes and price points to defend unit volume, while value-tier and club formats provide share gains and buffer downturns.
Commodity and feed costs
Grains, proteins, fats and birdseed are volatile inputs for Central Garden; CBOT corn traded roughly 4–6 USD/bu and soybeans ~10–13 USD/bu through 2024–mid‑2025, so spikes compress margins unless pricing passes through quickly. Forward contracts and formula pricing with major retailers have been used to smooth shocks and protect gross margin. Nutrition reformulation (ingredient substitution, concentrated blends) reduces cost exposure while maintaining product quality.

Retailer consolidation
Mass merchants and pet specialty chains—led by Walmart (FY2024 revenue 611.3 billion USD) and large specialty retailers—wield pricing and slotting power, increasing private-label pressure while enabling scale promotions. Central needs differentiated brands plus selective private-label partnerships, and joint business planning to secure shelf space and endcaps.

E-commerce and DTC economics
Shipping bulky pet products drives unit costs materially, often adding double-digit percentage to fulfillment expense and pressuring margins; subscribe-and-save models for consumables raise LTV and forecastability, with subscriptions driving retention uplifts commonly cited in industry reports. Omnichannel fulfillment and retailer media networks have reduced CAC for brands in 2024, while pack/weight optimization and dropship lower shipping and inventory carrying costs.
- Bulky shipping: higher per-unit fulfillment
- Subscribe-and-save: improves LTV/forecastability
- Omnichannel + retailer media: lowers CAC
- Pack/weight & dropship: cut shipping/inventory costs
Labor and logistics costs
Tight US labor markets pushed average hourly earnings up about 4.2% YoY in 2024, increasing manufacturing and DC wage costs and squeezing margins. Volatile fuel and ocean freight swings — container rates still ~35% below 2021 peaks while diesel averaged near $3.80/gal in 2024 — affect delivered margins. Automation and network optimization have lowered per-unit labor and transport costs, and nearshoring trends cut lead times and working capital needs.
- Wage growth ~+4.2% (2024)
- Diesel ~$3.80/gal (2024)
- Container rates ~35% below 2021 peak
- Automation & network optimization reduce unit costs
- Nearshoring stabilizes lead times & working capital
Regulation, tariffs and logistics squeeze margins; CHIPS/IRA spur reshoring
Pet spend ~143.6B USD (2024) and US lawn/garden ~60B USD make Central revenue-sensitive to real disposable income; CPI ~3–4% (2024) and Fed funds ~5.25–5.50% (2025) compress margins. Corn 4–6 USD/bu, soybeans 10–13 USD/bu (2024–mid‑2025) drive input volatility; forwards/formula pricing and reformulation mitigate risk. Bulky shipping and fulfillment add double-digit % to unit cost; subscribe-and-save and pack optimization improve LTV and reduce CAC.
| Metric | 2024/2025 |
|---|---|
| Pet spend | 143.6B USD (2024) |
| US lawn/garden | ~60B USD (2024) |
| Corn / Soybeans | 4–6 / 10–13 USD/bu (2024–H1 2025) |
Full Version Awaits
Central Garden PESTLE Analysis
The preview shown here is the exact Central Garden PESTLE Analysis you’ll receive after purchase—fully formatted, professionally structured, and ready to use. No placeholders or surprises: the content, layout, and data visible now are the final downloadable file. Instant access upon payment.

Make Smarter Strategic Decisions with a Complete PESTEL View
Our PESTLE analysis of Central Garden dissects political, economic, social, technological, legal and environmental forces shaping its growth, from regulatory pressures to consumer trends and sustainability risks. Ideal for investors and strategists, it translates external trends into actionable implications and strategic options. Purchase the full report to access detailed insights, data tables and ready-to-use recommendations.
Political factors
Agro-chemical policy shifts
Shifts in agro-chemical policy — exemplified by EPA revocation of chlorpyrifos tolerances in 2021 and an EPA FY2024 budget near $11 billion — can change approvals and labeling, forcing reformulations. Central must monitor EPA and USDA guidance and risk assessments to anticipate product changes. Growing political pressure for pollinator protection has led to tighter reviews of neonicotinoids. Proactive lobbying and stewardship programs can reduce disruption and compliance costs.
Trade tariffs and sourcing
Tariffs on inputs can raise COGS; US Section 301 tariffs on Chinese goods remain up to 25% and Section 232 levies 25% on steel and 10% on aluminum, directly affecting metals- and metal-assemblies costs. Shifts in US-China and US-Mexico trade stances have already re-routed supply chains, prompting Central to pursue multi-country sourcing and commodity hedging. Policy-driven reshoring incentives, notably the CHIPS Act (about $52 billion) and the IRA (roughly $391 billion in clean-energy incentives), can justify domestic capacity investments.
Farm bill and rural programs
US Farm Bill provisions shape ag inputs, conservation and feed markets by directing subsidies, crop insurance and conservation programs that affect acreage and input use. The 2018 Farm Bill set a CRP cap of 27 million acres and CRP enrollment was about 22 million acres in 2023 (USDA), influencing demand for seed and habitat products. Wildlife habitat funding under USDA conservation programs directly affects wild bird feed consumption. Monitoring USDA program updates enables Central to align assortments with subsidy- and conservation-driven demand shifts.
Infrastructure and logistics policy
Investments in ports, rail and trucking regulations materially affect Central Garden freight costs and reliability; US logistics costs were about 8.0% of GDP in 2022 per CSCMP, underscoring sensitivity to modal efficiency. Hours-of-service limits from FMCSA and tightening EPA emissions rules constrain carrier capacity and can raise rates. Central benefits from policy-driven port and rail upgrades but must plan for transitional disruption and higher short-term freight spend. Strategic placement of distribution centers reduces exposure to regional bottlenecks and regulatory shifts.
- Freight-cost sensitivity: logistics ≈ 8.0% of US GDP (CSCMP 2022)
- Regulatory constraints: FMCSA hours-of-service, EPA emissions rules
- Opportunity: federal/state port & rail upgrades improve long-term reliability
- Mitigation: strategic DC placement lowers bottleneck risk
Local ordinances on landscaping
Local ordinances increasingly limit fertilizer, pesticide and lawn watering; landscapes account for 30–60% of household outdoor water use, driving rules that vary by city and season. This patchwork forces Central to offer tailored SKUs and retailer education, while municipal momentum for drought‑tolerant landscapes can shift product mix and demand.
- Regulation impact: SKU customization
- Retailer training: compliance sales
- Market shift: drought‑tolerant products
Regulation, tariffs and logistics squeeze margins; CHIPS/IRA spur reshoring
Regulatory shifts (EPA FY2024 ~$11B; chlorpyrifos tolerances revoked 2021) force reformulations and stewardship costs; pollinator/neonic reviews raise compliance. Tariffs (Section 301/232 up to 25%) and logistics (≈8.0% of US GDP) increase COGS and supply‑chain risk; CHIPS $52B and IRA $391B create reshoring incentives. Farm Bill CRP ~22M acres (2023) and local water/pesticide bans shift SKU mix and retailer programs.
| Factor | Data | Impact |
|---|---|---|
| Regulation | EPA ~$11B FY24 | Reformulation/compliance costs |
| Trade | Tariffs up to 25% | Higher input COGS |
| Logistics | 8.0% of GDP | Freight sensitivity |
| Policy | CRP ~22M acres | Demand shifts for habitat/feed |
What is included in the product
Detailed Word Document
Explores how external macro-environmental factors uniquely affect Central Garden across Political, Economic, Social, Technological, Environmental and Legal dimensions, with data-backed trends and forward-looking insights to identify risks and opportunities for executives, investors and strategists.
Customizable Excel Spreadsheet
A compact, visually segmented PESTLE summary for Central Garden that supports quick alignment in meetings and can be dropped into presentations or shared across teams.
Economic factors
Consumer spending cycles
Pet spend reached about 143.6 billion USD in 2024 and US lawn/garden retail sales were roughly 60 billion USD, underscoring discretionary exposure to real disposable income. Elevated inflation (CPI ~3–4% in 2024) and Fed funds ~5.25–5.50% in 2025 compress margins, driving retailers to tighten inventory and boost promos. Central should flex pack sizes and price points to defend unit volume, while value-tier and club formats provide share gains and buffer downturns.
Commodity and feed costs
Grains, proteins, fats and birdseed are volatile inputs for Central Garden; CBOT corn traded roughly 4–6 USD/bu and soybeans ~10–13 USD/bu through 2024–mid‑2025, so spikes compress margins unless pricing passes through quickly. Forward contracts and formula pricing with major retailers have been used to smooth shocks and protect gross margin. Nutrition reformulation (ingredient substitution, concentrated blends) reduces cost exposure while maintaining product quality.
Retailer consolidation
Mass merchants and pet specialty chains—led by Walmart (FY2024 revenue 611.3 billion USD) and large specialty retailers—wield pricing and slotting power, increasing private-label pressure while enabling scale promotions. Central needs differentiated brands plus selective private-label partnerships, and joint business planning to secure shelf space and endcaps.
E-commerce and DTC economics
Shipping bulky pet products drives unit costs materially, often adding double-digit percentage to fulfillment expense and pressuring margins; subscribe-and-save models for consumables raise LTV and forecastability, with subscriptions driving retention uplifts commonly cited in industry reports. Omnichannel fulfillment and retailer media networks have reduced CAC for brands in 2024, while pack/weight optimization and dropship lower shipping and inventory carrying costs.
- Bulky shipping: higher per-unit fulfillment
- Subscribe-and-save: improves LTV/forecastability
- Omnichannel + retailer media: lowers CAC
- Pack/weight & dropship: cut shipping/inventory costs
Labor and logistics costs
Tight US labor markets pushed average hourly earnings up about 4.2% YoY in 2024, increasing manufacturing and DC wage costs and squeezing margins. Volatile fuel and ocean freight swings — container rates still ~35% below 2021 peaks while diesel averaged near $3.80/gal in 2024 — affect delivered margins. Automation and network optimization have lowered per-unit labor and transport costs, and nearshoring trends cut lead times and working capital needs.
- Wage growth ~+4.2% (2024)
- Diesel ~$3.80/gal (2024)
- Container rates ~35% below 2021 peak
- Automation & network optimization reduce unit costs
- Nearshoring stabilizes lead times & working capital
Regulation, tariffs and logistics squeeze margins; CHIPS/IRA spur reshoring
Pet spend ~143.6B USD (2024) and US lawn/garden ~60B USD make Central revenue-sensitive to real disposable income; CPI ~3–4% (2024) and Fed funds ~5.25–5.50% (2025) compress margins. Corn 4–6 USD/bu, soybeans 10–13 USD/bu (2024–mid‑2025) drive input volatility; forwards/formula pricing and reformulation mitigate risk. Bulky shipping and fulfillment add double-digit % to unit cost; subscribe-and-save and pack optimization improve LTV and reduce CAC.
| Metric | 2024/2025 |
|---|---|
| Pet spend | 143.6B USD (2024) |
| US lawn/garden | ~60B USD (2024) |
| Corn / Soybeans | 4–6 / 10–13 USD/bu (2024–H1 2025) |
Full Version Awaits
Central Garden PESTLE Analysis
The preview shown here is the exact Central Garden PESTLE Analysis you’ll receive after purchase—fully formatted, professionally structured, and ready to use. No placeholders or surprises: the content, layout, and data visible now are the final downloadable file. Instant access upon payment.
Original: $10.00
-65%$10.00
$3.50Description
Make Smarter Strategic Decisions with a Complete PESTEL View
Our PESTLE analysis of Central Garden dissects political, economic, social, technological, legal and environmental forces shaping its growth, from regulatory pressures to consumer trends and sustainability risks. Ideal for investors and strategists, it translates external trends into actionable implications and strategic options. Purchase the full report to access detailed insights, data tables and ready-to-use recommendations.
Political factors
Agro-chemical policy shifts
Shifts in agro-chemical policy — exemplified by EPA revocation of chlorpyrifos tolerances in 2021 and an EPA FY2024 budget near $11 billion — can change approvals and labeling, forcing reformulations. Central must monitor EPA and USDA guidance and risk assessments to anticipate product changes. Growing political pressure for pollinator protection has led to tighter reviews of neonicotinoids. Proactive lobbying and stewardship programs can reduce disruption and compliance costs.
Trade tariffs and sourcing
Tariffs on inputs can raise COGS; US Section 301 tariffs on Chinese goods remain up to 25% and Section 232 levies 25% on steel and 10% on aluminum, directly affecting metals- and metal-assemblies costs. Shifts in US-China and US-Mexico trade stances have already re-routed supply chains, prompting Central to pursue multi-country sourcing and commodity hedging. Policy-driven reshoring incentives, notably the CHIPS Act (about $52 billion) and the IRA (roughly $391 billion in clean-energy incentives), can justify domestic capacity investments.
Farm bill and rural programs
US Farm Bill provisions shape ag inputs, conservation and feed markets by directing subsidies, crop insurance and conservation programs that affect acreage and input use. The 2018 Farm Bill set a CRP cap of 27 million acres and CRP enrollment was about 22 million acres in 2023 (USDA), influencing demand for seed and habitat products. Wildlife habitat funding under USDA conservation programs directly affects wild bird feed consumption. Monitoring USDA program updates enables Central to align assortments with subsidy- and conservation-driven demand shifts.
Infrastructure and logistics policy
Investments in ports, rail and trucking regulations materially affect Central Garden freight costs and reliability; US logistics costs were about 8.0% of GDP in 2022 per CSCMP, underscoring sensitivity to modal efficiency. Hours-of-service limits from FMCSA and tightening EPA emissions rules constrain carrier capacity and can raise rates. Central benefits from policy-driven port and rail upgrades but must plan for transitional disruption and higher short-term freight spend. Strategic placement of distribution centers reduces exposure to regional bottlenecks and regulatory shifts.
- Freight-cost sensitivity: logistics ≈ 8.0% of US GDP (CSCMP 2022)
- Regulatory constraints: FMCSA hours-of-service, EPA emissions rules
- Opportunity: federal/state port & rail upgrades improve long-term reliability
- Mitigation: strategic DC placement lowers bottleneck risk
Local ordinances on landscaping
Local ordinances increasingly limit fertilizer, pesticide and lawn watering; landscapes account for 30–60% of household outdoor water use, driving rules that vary by city and season. This patchwork forces Central to offer tailored SKUs and retailer education, while municipal momentum for drought‑tolerant landscapes can shift product mix and demand.
- Regulation impact: SKU customization
- Retailer training: compliance sales
- Market shift: drought‑tolerant products
Regulation, tariffs and logistics squeeze margins; CHIPS/IRA spur reshoring
Regulatory shifts (EPA FY2024 ~$11B; chlorpyrifos tolerances revoked 2021) force reformulations and stewardship costs; pollinator/neonic reviews raise compliance. Tariffs (Section 301/232 up to 25%) and logistics (≈8.0% of US GDP) increase COGS and supply‑chain risk; CHIPS $52B and IRA $391B create reshoring incentives. Farm Bill CRP ~22M acres (2023) and local water/pesticide bans shift SKU mix and retailer programs.
| Factor | Data | Impact |
|---|---|---|
| Regulation | EPA ~$11B FY24 | Reformulation/compliance costs |
| Trade | Tariffs up to 25% | Higher input COGS |
| Logistics | 8.0% of GDP | Freight sensitivity |
| Policy | CRP ~22M acres | Demand shifts for habitat/feed |
What is included in the product
Detailed Word Document
Explores how external macro-environmental factors uniquely affect Central Garden across Political, Economic, Social, Technological, Environmental and Legal dimensions, with data-backed trends and forward-looking insights to identify risks and opportunities for executives, investors and strategists.
Customizable Excel Spreadsheet
A compact, visually segmented PESTLE summary for Central Garden that supports quick alignment in meetings and can be dropped into presentations or shared across teams.
Economic factors
Consumer spending cycles
Pet spend reached about 143.6 billion USD in 2024 and US lawn/garden retail sales were roughly 60 billion USD, underscoring discretionary exposure to real disposable income. Elevated inflation (CPI ~3–4% in 2024) and Fed funds ~5.25–5.50% in 2025 compress margins, driving retailers to tighten inventory and boost promos. Central should flex pack sizes and price points to defend unit volume, while value-tier and club formats provide share gains and buffer downturns.
Commodity and feed costs
Grains, proteins, fats and birdseed are volatile inputs for Central Garden; CBOT corn traded roughly 4–6 USD/bu and soybeans ~10–13 USD/bu through 2024–mid‑2025, so spikes compress margins unless pricing passes through quickly. Forward contracts and formula pricing with major retailers have been used to smooth shocks and protect gross margin. Nutrition reformulation (ingredient substitution, concentrated blends) reduces cost exposure while maintaining product quality.
Retailer consolidation
Mass merchants and pet specialty chains—led by Walmart (FY2024 revenue 611.3 billion USD) and large specialty retailers—wield pricing and slotting power, increasing private-label pressure while enabling scale promotions. Central needs differentiated brands plus selective private-label partnerships, and joint business planning to secure shelf space and endcaps.
E-commerce and DTC economics
Shipping bulky pet products drives unit costs materially, often adding double-digit percentage to fulfillment expense and pressuring margins; subscribe-and-save models for consumables raise LTV and forecastability, with subscriptions driving retention uplifts commonly cited in industry reports. Omnichannel fulfillment and retailer media networks have reduced CAC for brands in 2024, while pack/weight optimization and dropship lower shipping and inventory carrying costs.
- Bulky shipping: higher per-unit fulfillment
- Subscribe-and-save: improves LTV/forecastability
- Omnichannel + retailer media: lowers CAC
- Pack/weight & dropship: cut shipping/inventory costs
Labor and logistics costs
Tight US labor markets pushed average hourly earnings up about 4.2% YoY in 2024, increasing manufacturing and DC wage costs and squeezing margins. Volatile fuel and ocean freight swings — container rates still ~35% below 2021 peaks while diesel averaged near $3.80/gal in 2024 — affect delivered margins. Automation and network optimization have lowered per-unit labor and transport costs, and nearshoring trends cut lead times and working capital needs.
- Wage growth ~+4.2% (2024)
- Diesel ~$3.80/gal (2024)
- Container rates ~35% below 2021 peak
- Automation & network optimization reduce unit costs
- Nearshoring stabilizes lead times & working capital
Regulation, tariffs and logistics squeeze margins; CHIPS/IRA spur reshoring
Pet spend ~143.6B USD (2024) and US lawn/garden ~60B USD make Central revenue-sensitive to real disposable income; CPI ~3–4% (2024) and Fed funds ~5.25–5.50% (2025) compress margins. Corn 4–6 USD/bu, soybeans 10–13 USD/bu (2024–mid‑2025) drive input volatility; forwards/formula pricing and reformulation mitigate risk. Bulky shipping and fulfillment add double-digit % to unit cost; subscribe-and-save and pack optimization improve LTV and reduce CAC.
| Metric | 2024/2025 |
|---|---|
| Pet spend | 143.6B USD (2024) |
| US lawn/garden | ~60B USD (2024) |
| Corn / Soybeans | 4–6 / 10–13 USD/bu (2024–H1 2025) |
Full Version Awaits
Central Garden PESTLE Analysis
The preview shown here is the exact Central Garden PESTLE Analysis you’ll receive after purchase—fully formatted, professionally structured, and ready to use. No placeholders or surprises: the content, layout, and data visible now are the final downloadable file. Instant access upon payment.











